
Downwards movement was expected. A small red candlestick fits the Elliott wave count.
Summary: The short term target is at 2,103 and may be met next week. The main wave count will remain relatively bullish while price remains above the long held bull trend line on the daily chart. Only when this is breached by a close of 3% or more of market value will the main wave count expect a trend change at primary or cycle degree. The trend remains up unless proven otherwise.
Note: Most days the text for daily charts changes little and the text for hourly charts is rewritten. I will be making changes each day italicised so that long standing members can easily skim through and see what’s new every day.
To see a weekly chart and how to draw trend lines go here.
Bull Wave Count
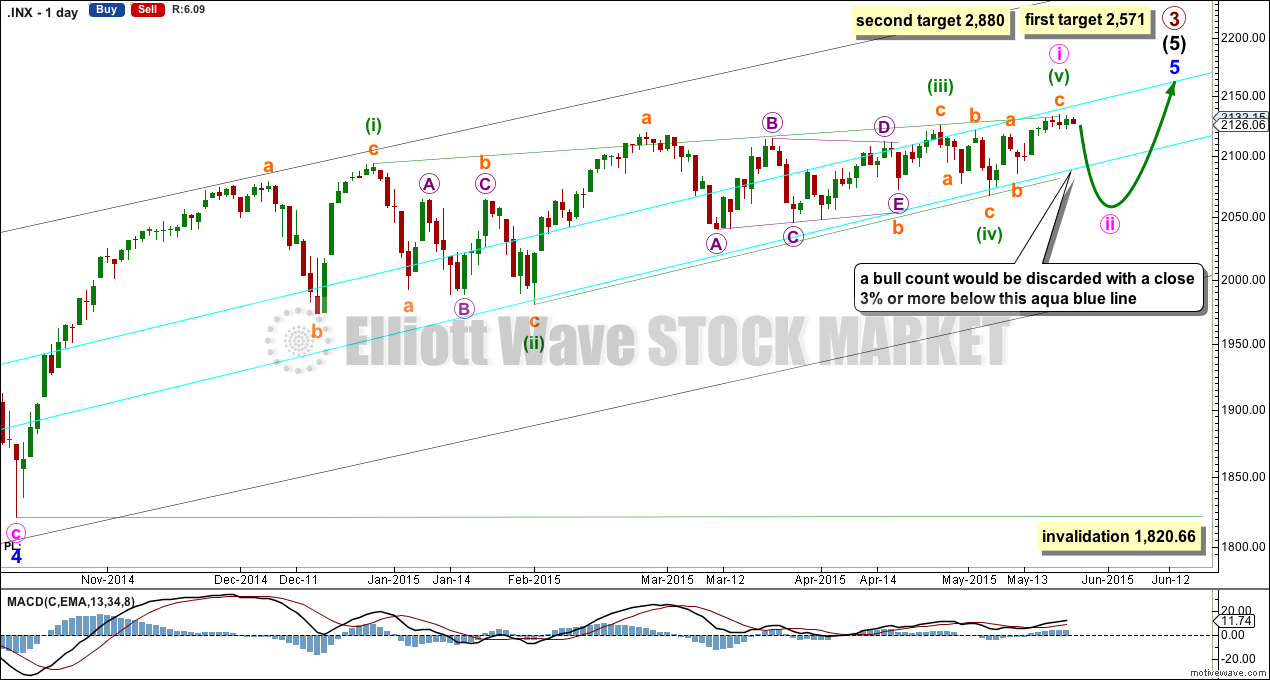
The bull wave count sees primary 1-2-3 within an impulse for a cycle degree wave V.
The bear wave count sees primary A-B-C zigzag for a cycle degree B wave.
We should always assume the trend remains the same until proven otherwise. I will have the main wave count relatively bullish while price remains above the lower aqua blue trend line which has provided support for this bull market since 2011. Only when that trend line is breached by a close of 3% or more of market value will I have my main wave count bearish.
The complete contracting diagonal may have been only minute wave i as a leading diagonal within minor wave 5.
At 2,571 intermediate wave (5) would reach 1.618 the length of intermediate wave (3). If upwards movement keeps going past this first target, or when price gets there the structure is incomplete, then the second target would be used.
At 2,880 primary wave 3 would reach 2.618 the length of primary wave 1.
There is now a complete contracting diagonal structure, although the final fifth wave has only slightly overshot the (i)-(iii) trend line. There is now first confirmation of a trend change at least at a small degree on the hourly chart. Normally a second wave correction following a first wave leading diagonal is very deep. In this case it may be expected to be shallow due to strong support offered by the lower aqua blue trend line.
For both main and alternate bull wave counts some downwards movement is now expected. For this main bull count it may be a low degree second wave for minute wave ii, which should not breach the lower aqua blue trend line by a close of 3% or more of market value. An overshoot (like that seen for the end of minor wave 4) may be expected only.
Minute wave ii may not move beyond the start of minute wave i below 1,820.66. While this price point would provide final price invalidation of this bull wave count, it would be discarded before this point is passed when the aqua blue trend line is breached.
Hourly Wave Count
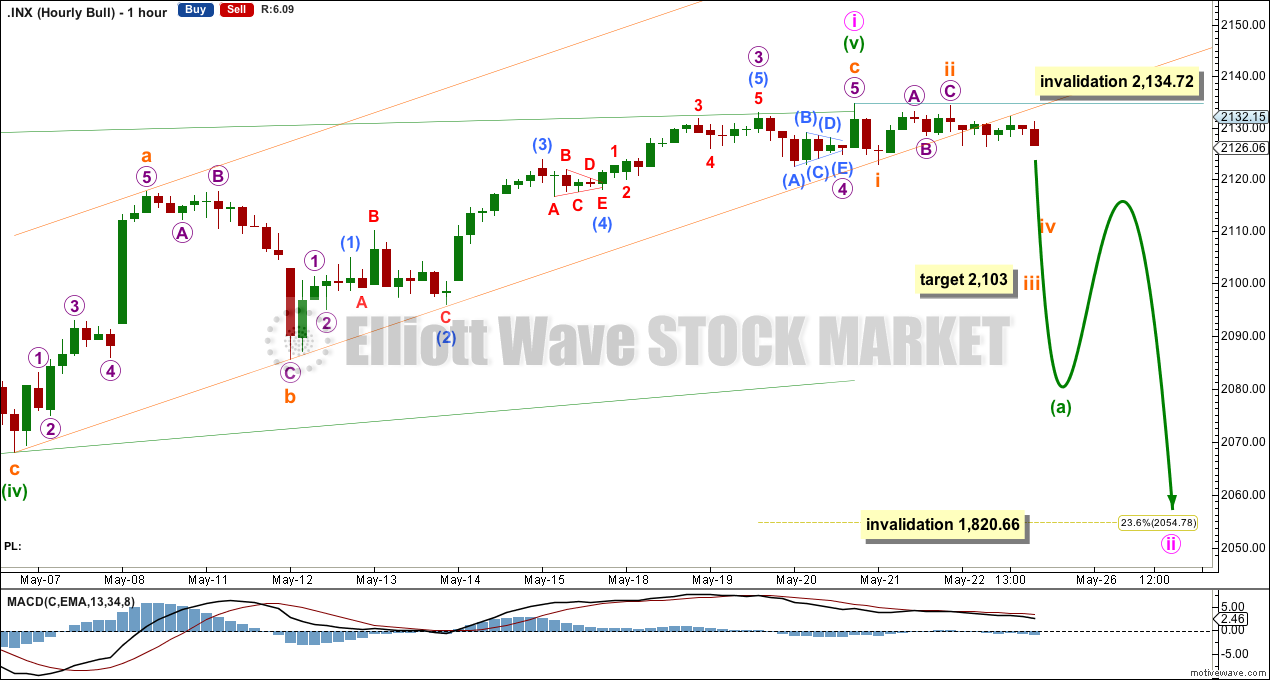
The lower orange trend line is now breached by at a few hourly candlesticks below it and not touching it. This provides trend channel confirmation that minuette wave (v) should be over.
At 2,103 subminuette wave iii would reach 2.618 the length of subminuette wave i.
Minute wave ii may end about the 0.236 Fibonacci ratio of minute wave i at 2,054.78, may last about two weeks, and must subdivide as a three wave structure most likely a zigzag. Despite this being a second wave correction following a leading diagonal (they are normally very deep), I would expect this one to be more shallow due to strong support provided by the long held bullish trend line on the daily chart.
If subminuette wave ii continues further it may not move beyond the start of subminuette wave i above 2,134.72.
Alternate Bull Wave Count
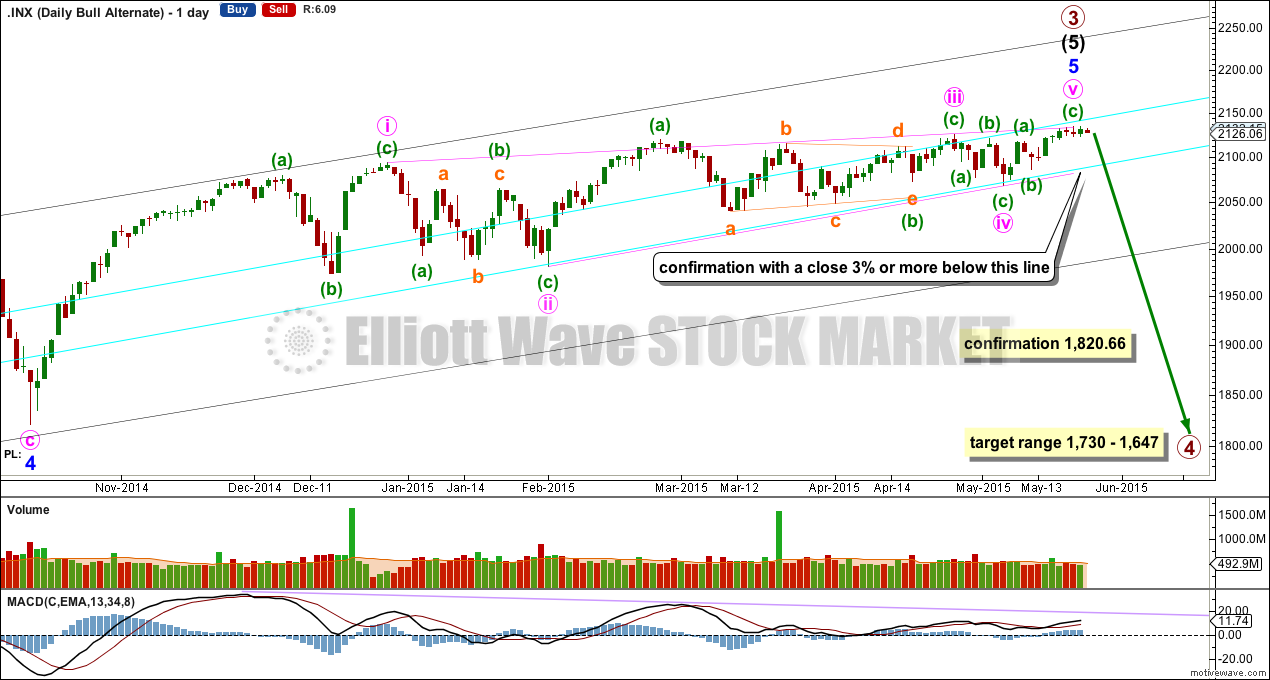
It is possible that the S&P has seen a primary degree (or for the bear count below a cycle degree) trend change three days ago. If not there, then another one or two days of a very little more upwards movement to overshoot the upper pink i-iii trend line would give this contracting diagonal a very typical look.
This alternate bull wave count simply moves the degree of labelling within the contracting diagonal all up one degree to see it as an ending diagonal for minor wave 5.
This wave count absolutely requires confirmation at the daily chart level before any confidence may be had in a primary (or cycle) degree trend change. Confirmation would come with:
1. A close of 3% or more of market value below the lower aqua blue trend line.
2. A clear five down on the daily chart.
3. A new low below 1,820.66.
As each condition is met the probability of a substantial trend change would increase.
Primary wave 4 would most likely be a time consuming flat, triangle or combination in order to exhibit structural alternation with the zigzag of primary wave 2. Primary wave 2 lasted 12 weeks. Primary wave 4 is likely to be longer in duration because combinations and triangles particularly are more time consuming than zigzags which tend to be quick corrections. Primary wave 4 may be expected to last more than 12 weeks, and may end with a total Fibonacci 13 or more likely 21 weeks.
Bear Wave Count
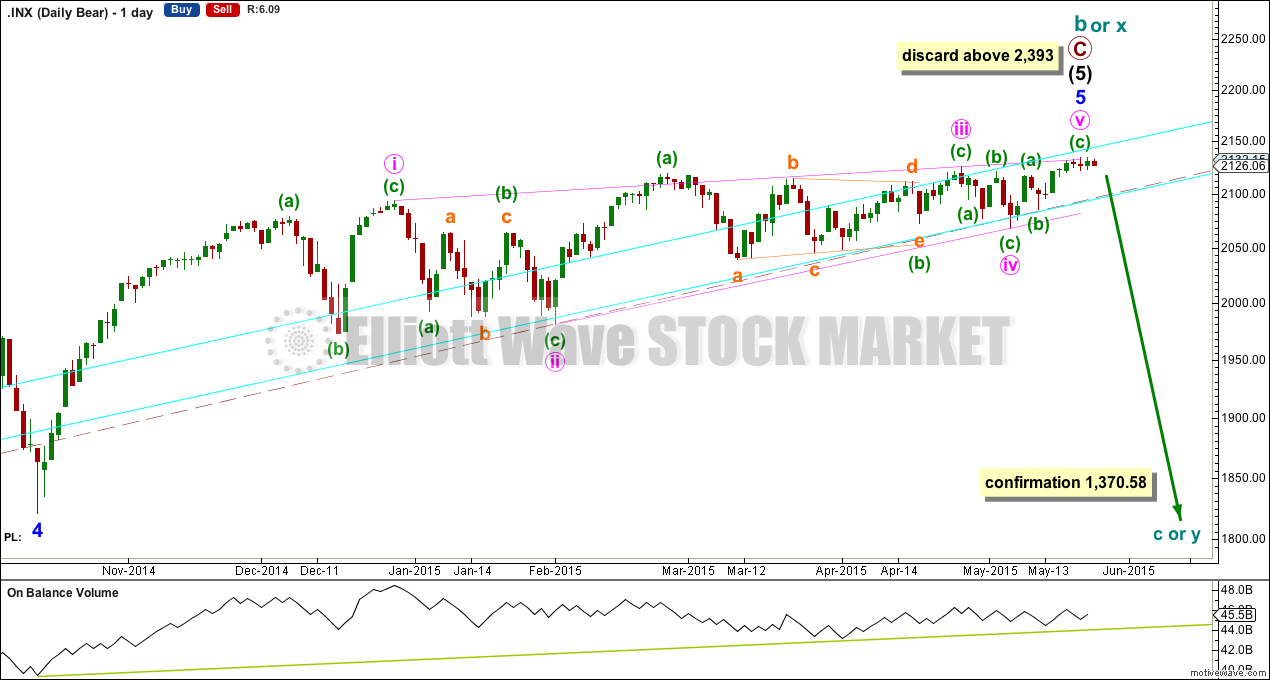
The subdivisions within primary waves A-B-C are seen in absolutely exactly the same way as primary waves 1-2-3 for the bull wave count.
To see the difference at the monthly chart level between the bull and bear ideas look at the last historical analysis here.
At cycle degree wave b is over the maximum common length of 138% the length of cycle wave a, at 170% the length of cycle wave a. At 2,393 cycle wave b would be twice the length of cycle wave a and at that point this bear wave count should be discarded.
While we have no confirmation of this wave count we should assume the trend remains the same, upwards. This wave count requires confirmation before I have confidence in it. Full and final confirmation that the market is crashing would only come with a new low below 1,370.58. However, structure and momentum should tell us long before that point which wave count is correct, bull or bear.
On Balance Volume should continue to find support at the trend lines drawn. When the longer held green trend line is broken by OBV a trend change would be supported.
Technical Analysis
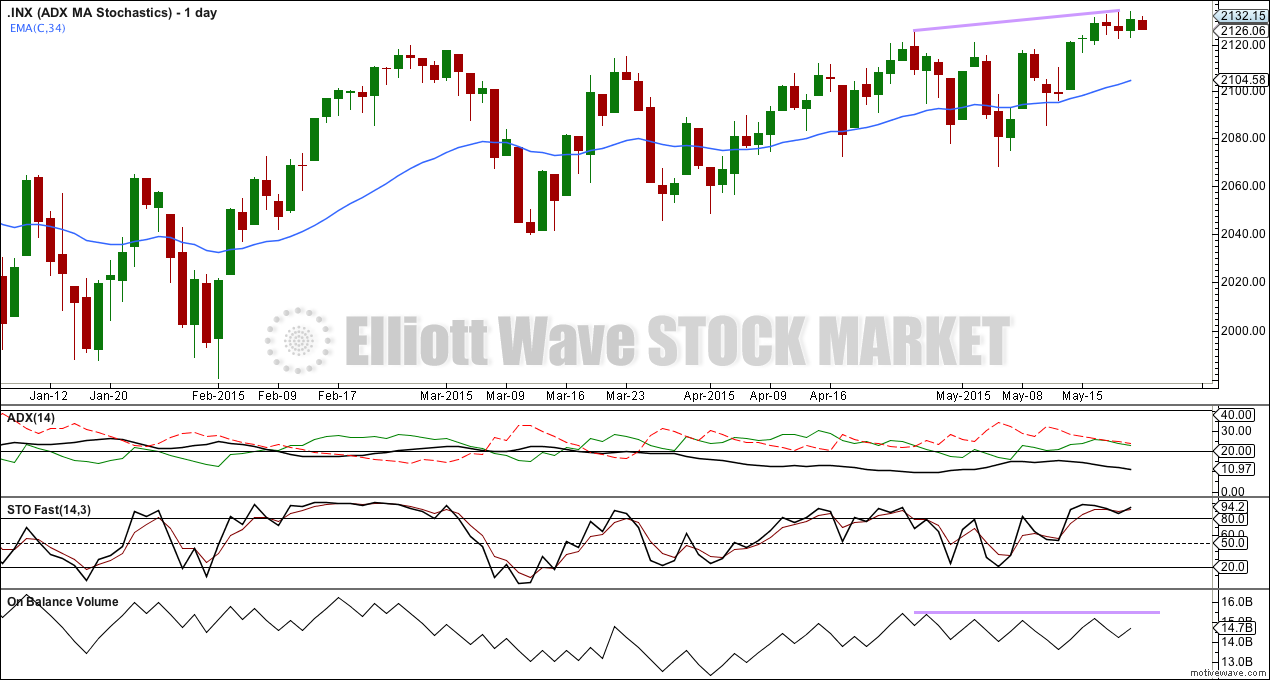
Data for yesterday’s session for ADX is still declining and at 10.97 well below 15. This continues to indicate price is within a trading range, there is no clear trend. Low volatility and short swings may be expected. A range trading system would best be employed, as opposed to a trend trading system.
While price made new highs On Balance Volume failed to confirm. DJIA confirmed new highs, but DJT and Nasdaq have failed to confirm new highs. The bear market is not confirmed. This indicates a potential trend change, but confirmation in the opposite direction is required for confidence.
Stochastics remains overbought indicating at least some downwards movement from here.
This analysis is published about 09:23 p.m. EST.
Pending death cross in Transports about to cement ongoing DOW theory non-confirmation. Last October’s low saw a bounce off 200 dma so next intermediate low should end quite a bit lower, possibly at the 377 dma
Lara,
I like the italics for new material. What a great idea!
Thanks,
Rodney