
Upwards movement may now be over for the S&P. The Elliott wave structure is now complete, just short of the target at 2,135 to 2,137.
Summary: Upwards movement may have ended on Tuesday slightly short of the target. A trend change, no matter what degree, still requires some confirmation. I will look first for a clear breach of the upwards sloping orange channel on the hourly chart. Only when this is breached by downwards movement would I be confident that price is trending lower. While price remains within that channel, it is entirely possible that we may see another one or two days of slight more upwards movement to overshoot the i-iii trend line of the contracting diagonal.
Click charts to enlarge.
To see a weekly chart and how to draw trend lines go here.
Bull Wave Count
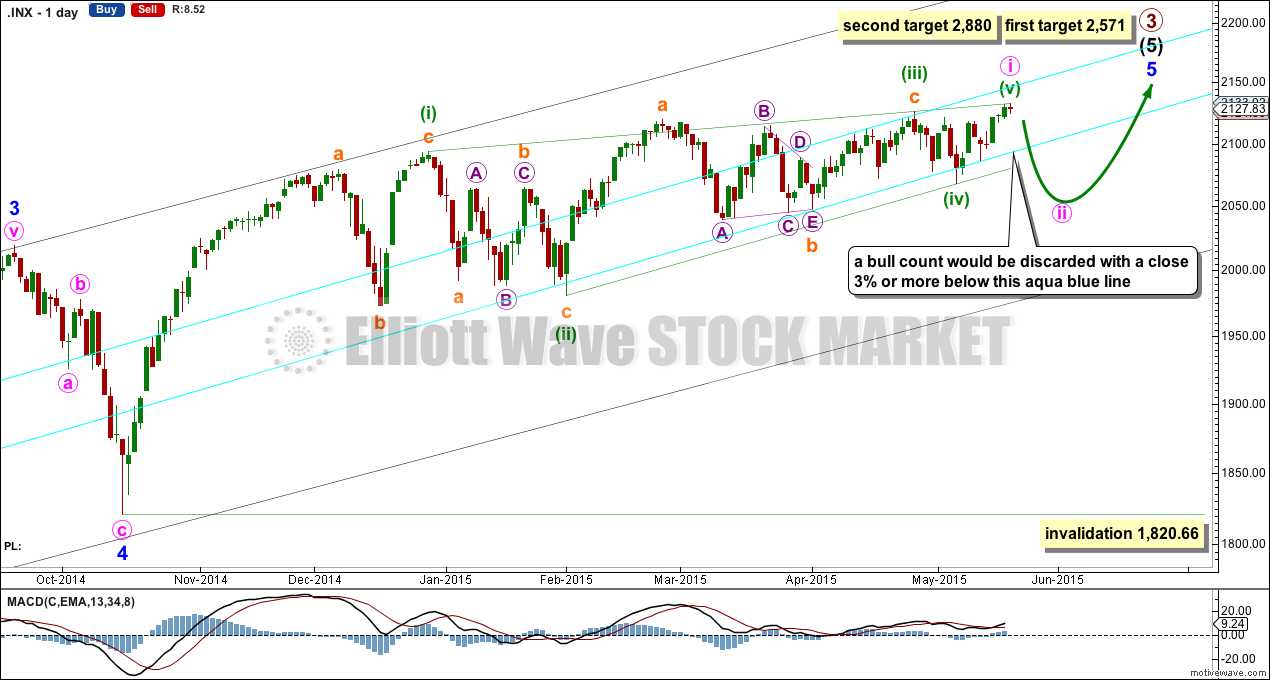
The bull wave count sees primary 1-2-3 within an impulse for a cycle degree wave V.
The bear wave count sees primary A-B-C zigzag for a cycle degree B wave.
We should always assume the trend remains the same until proven otherwise. I will have the main wave count bullish while price remains above the lower aqua blue trend line which has provided support for this bull market since 2011. Only when that trend line is breached by a close of 3% or more of market value will I have my main wave count bearish.
Today for this main wave count I am moving the diagonal structure down one degree. This may have been only minute wave i as a leading diagonal within minor wave 5.
At 2,571 intermediate wave (5) would reach 1.618 the length of intermediate wave (3). If upwards movement keeps going past this first target, or when price gets there the structure is incomplete, then the second target would be used.
At 2,880 primary wave 3 would reach 2.618 the length of primary wave 1.
There is now a complete contracting diagonal structure, although the final fifth wave did not overshoot the (i)-(iii) trend line as expected. It may yet do so for another one or two days upwards movement, and so confirmation at the hourly chart level is absolutely required before any confidence may be had in this structure being complete.
For both main and alternate bull wave counts some downwards movement is now expected. For this main bull count it may be a low degree second wave for minute wave ii, which should not breach the lower aqua blue trend line by a close of 3% or more of market value. An overshoot (like that seen for the end of minor wave 4) may be expected only.
Minute wave ii may not move beyond the start of minute wave i below 1,820.66. While this price point would provide final price invalidation of this bull wave count, it would be discarded before this point is passed when the aqua blue trend line is breached.
Hourly Wave Count
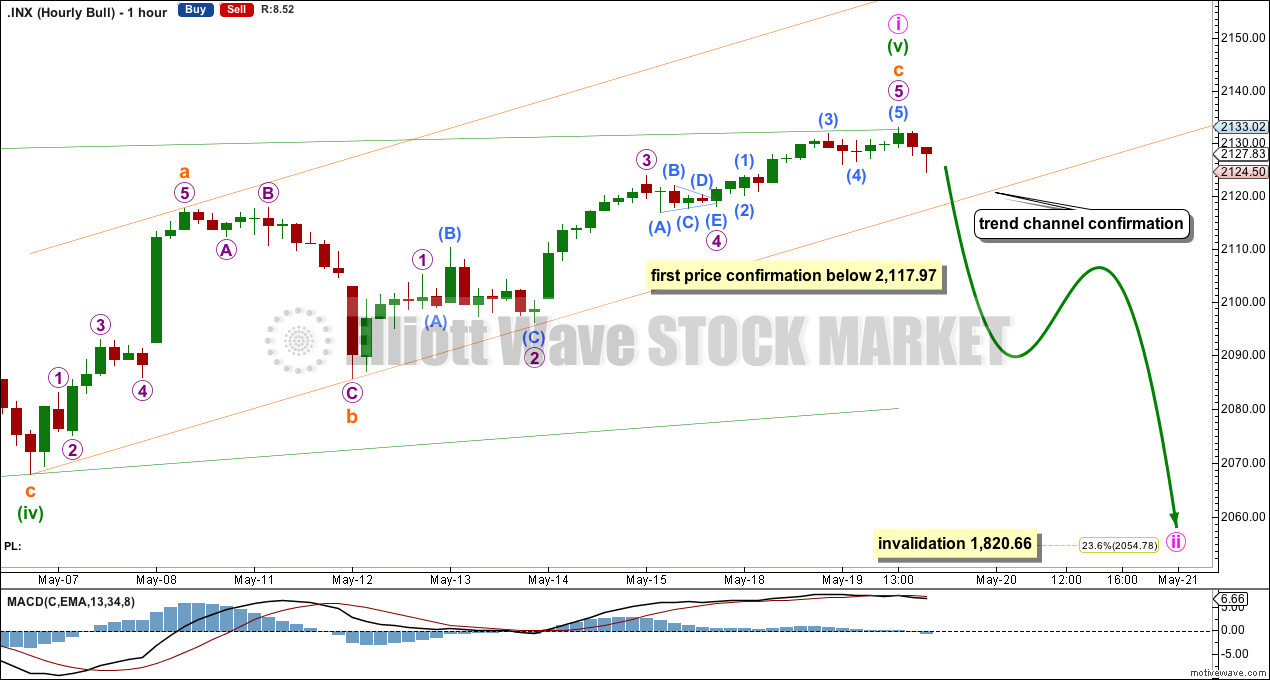
This wave count requires confirmation. First confirmation would come with a clear breach of the channel containing the final zigzag of the diagonal. When the lower orange trend line is breached by at least one full hourly candlestick below it and not touching it then minuette wave (v) would be confirmed as over.
A new low below 2,117.97 would provide first price confirmation of a trend change. At that stage downwards movement may not be a second wave correction within the final fifth wave of micro wave 5, and so micro wave 5 would have to be over.
Minute wave ii may end about the 0.236 Fibonacci ratio of minute wave i at 2,054.78, may last about two weeks, and must subdivide as a three wave structure most likely a zigzag. Despite this being a second wave correction following a leading diagonal (they are normally very deep), I would expect this one to be more shallow due to strong support provided by the long held bullish trend line on the daily chart.
Alternate Bull Wave Count
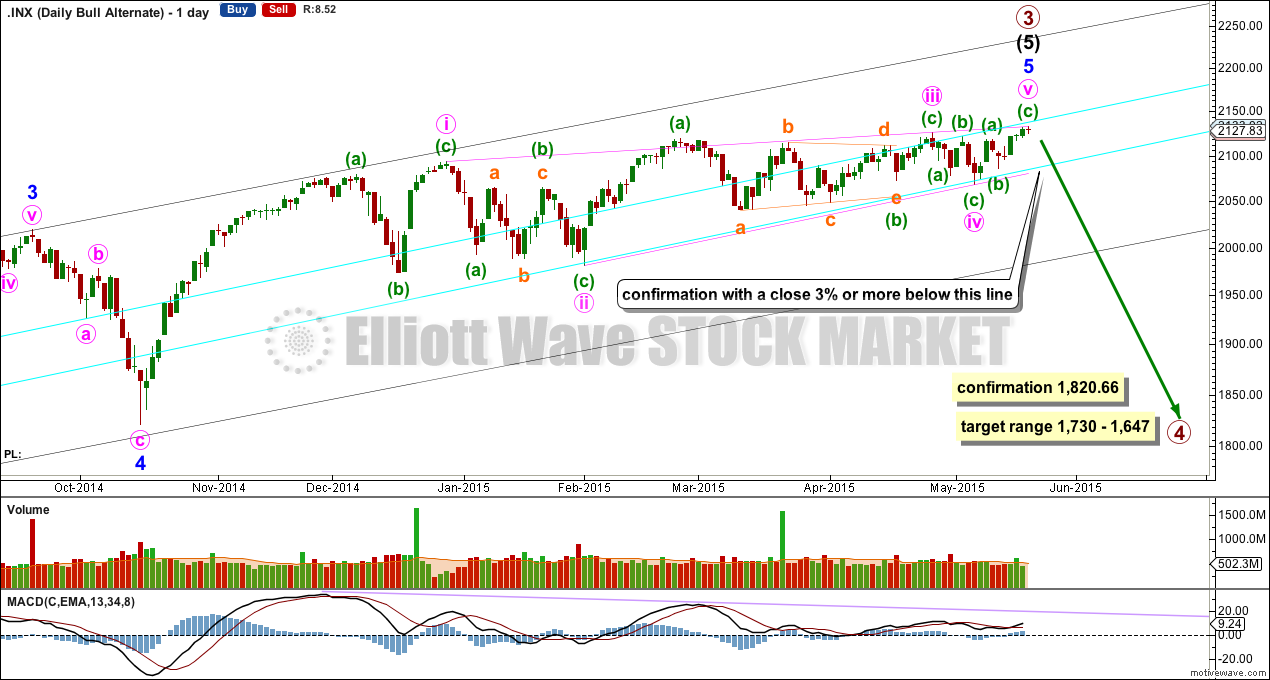
As stated yesterday, when the contracting diagonal is complete this wave count will become and alternate because we should always assume the trend remains the same until proven otherwise.
It is possible that the S&P has seen a primary (or for the bear count below a cycle degree) degree trend change today. If not today, then another one or two days of a very little more upwards movement to overshoot the upper pink i-iii trend line would give this contracting diagonal a very typical look.
This wave count absolutely requires confirmation at the daily chart level before any confidence may be had in a primary (or cycle) degree trend change. Confirmation would come with:
1. A close of 3% or more of market value below the lower aqua blue trend line.
2. A clear five down on the daily chart.
3. A new low below 1,820.66.
As each condition is met the probability of a substantial trend change would increase.
Primary wave 4 would most likely be a time consuming flat, triangle or combination in order to exhibit structural alternation with the zigzag of primary wave 2. Primary wave 2 lasted 12 weeks. Primary wave 4 is likely to be longer in duration because combinations and triangles particularly are more time consuming than zigzags which tend to be quick corrections. Primary wave 4 may be expected to last more than 12 weeks, and may end with a total Fibonacci 13 or more likely 21 weeks.
Bear Wave Count
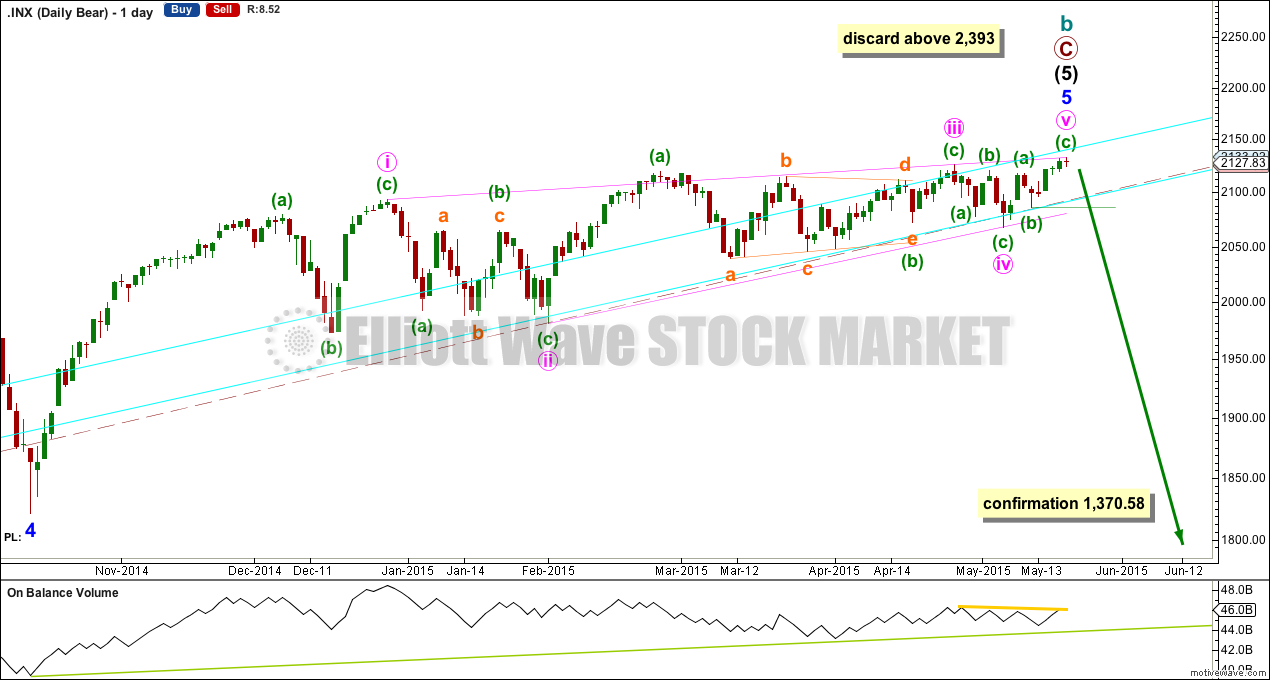
The subdivisions within primary waves A-B-C are seen in absolutely exactly the same way as primary waves 1-2-3 for the bull wave count.
To see the difference at the monthly chart level between the bull and bear ideas look at the last historical analysis here.
At cycle degree wave b is over the maximum common length of 138% the length of cycle wave a, at 170% the length of cycle wave a. At 2,393 cycle wave b would be twice the length of cycle wave a and at that point this bear wave count should be discarded.
While we have no confirmation of this wave count we should assume the trend remains the same, upwards. This wave count requires confirmation before I have confidence in it. Full and final confirmation that the market is crashing would only come with a new low below 1,370.58. However, structure and momentum should tell us long before that point which wave count is correct, bull or bear.
On Balance Volume should continue to find support at the trend lines drawn. When the longer held green trend line is broken by OBV a trend change would be supported.
Technical Analysis
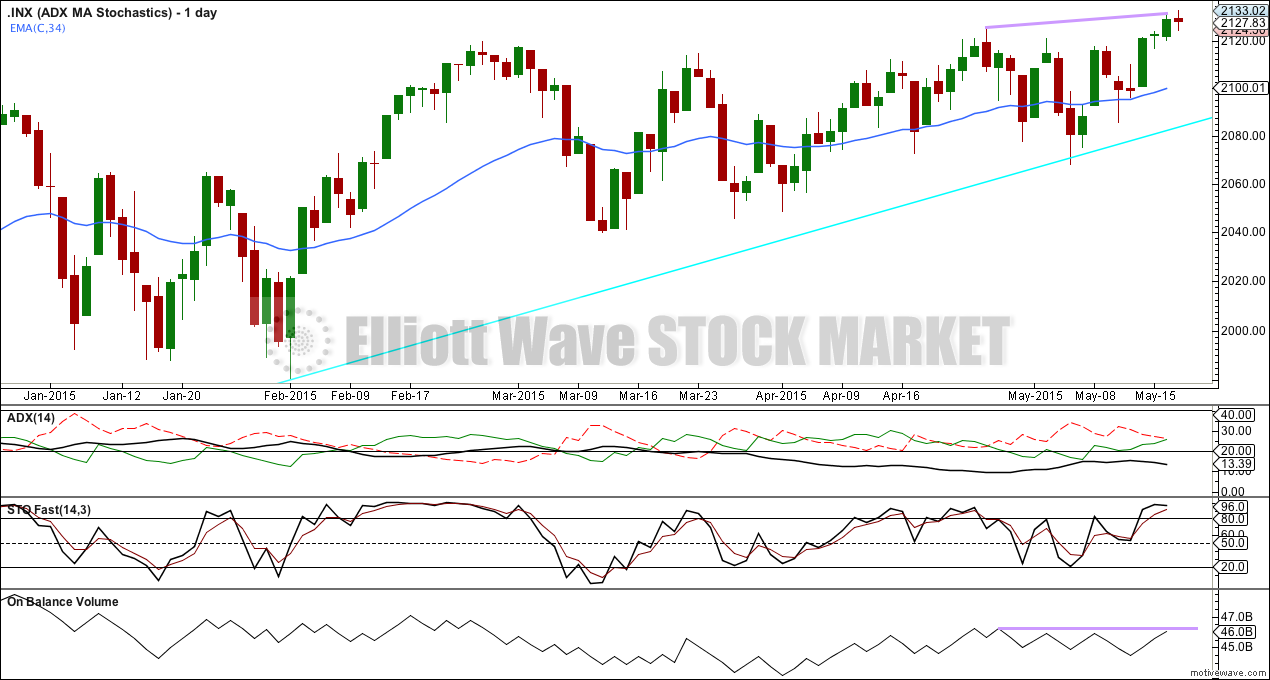
At the close of today’s session I have only data up to and including yesterday for ADX, Stochastics and On Balance Volume.
Yesterday, while price made new all time highs, ADX turned down very slightly and was below 15. This indicates no trend. If there was an upwards trend (as indicated by price) it was very weak.
Stochastics remained in overbought territory, but very slightly levelled off as price made new highs. This was the smallest negative divergence, indicating again a weak trend.
On Balance Volume had turned up, but had not managed to make a new high (indicated by the lilac horizontal line on OBV) while price made a new high. This small negative divergence also indicated a weak trend.
This analysis is published about 06:43 p.m. EST.
Huge amount of buying power expended today from look of TRIN. Transports peeling away from 200 DMA with conviction.