
Downwards movement has deepened the correction, which remains above the trend line and invalidation point.
Summary: It is fairly likely that minuette wave (b) is over and minuette wave (c) up has begun. The short term target is at 2,135 for upwards movement to end. Alternatively, it is still possible and somewhat likely that minuette wave (b) may move lower as a double zigzag to end when price finds support at the lower pink trend line of the diagonal.
Click charts to enlarge.
To see a weekly chart and how to draw trend lines go here.
Bull Wave Count
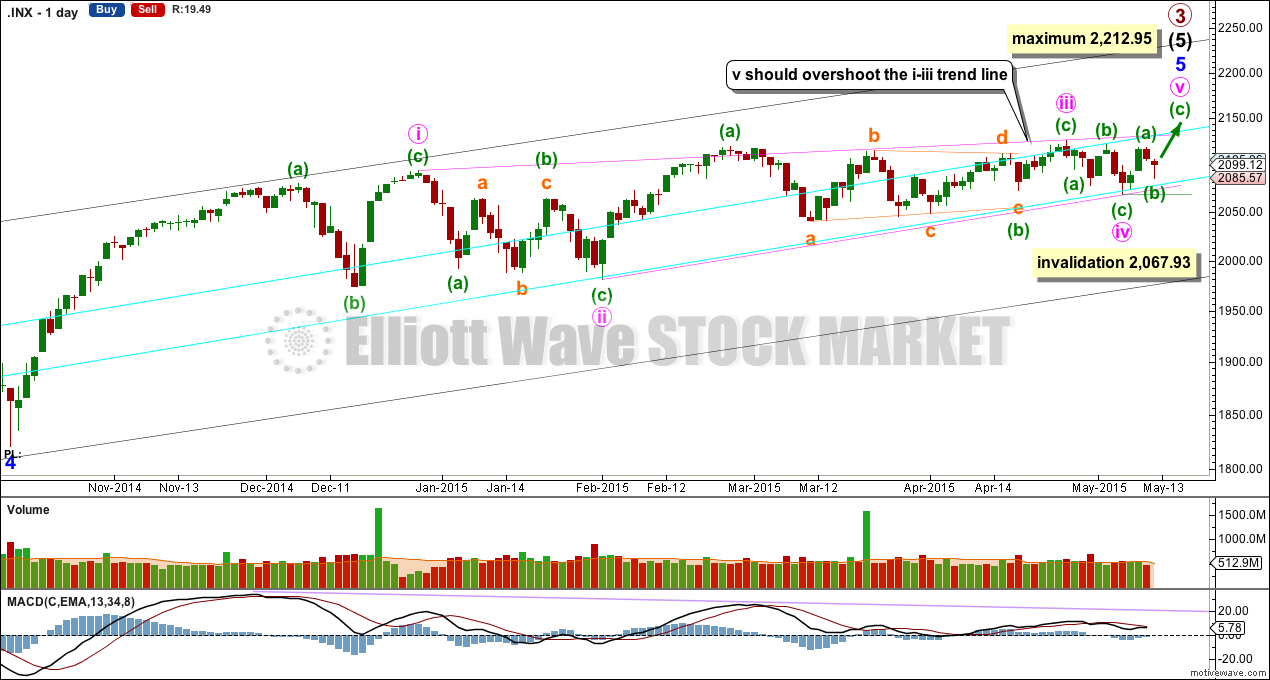
The bull wave count sees primary 1-2-3 within an impulse for a cycle degree wave V.
The bear wave count sees primary A-B-C zigzag for a cycle degree B wave.
The subdivisions for this upwards movement for both bull and bear wave counts are 5-3-5. The wave counts don’t diverge and won’t for months yet.
Minor wave 5 is an ending contracting diagonal, detailed on the daily chart below.
All this choppy overlapping movement with declining momentum fits for a diagonal. An ending diagonal requires all sub waves to be zigzags, and the fourth wave must overlap back into first wave price territory. Elliott wave convention is to always draw the trend lines about a diagonal to indicate the structure is a diagonal.
The diagonal for minor wave 5 would be contracting: minute wave iii is shorter than minute wave i.
Minute wave iv is extremely likely to be over at the lower aqua blue trend line. If minute wave v begins here then it has a limit. It may not be longer than equality with minute wave iii at 2,212.95.
Within minute wave v, minuette wave (b) may not move beyond the start of minuette wave (a) below 2,067.93.
Within impulses, the S&P often exhibits a Fibonacci ratio between two of its three actionary waves and rarely between all three. Within primary wave 3, there is already a close Fibonacci ratio between intermediate waves (1) and (3), and within intermediate wave (5) there is already a reasonable Fibonacci ratio between minor waves 3 and 1. It is unlikely that either minor wave 5 or intermediate wave (5) will exhibit a Fibonacci ratio. This means a target for primary wave 3 calculated at intermediate or minor degree would not have a good probability.
The target at 2,190 from the weekly chart looks to be too high. I would not expect such a large overshoot of the diagonal trend line.
Actionary waves within diagonals don’t normally exhibit Fibonacci ratios to each other. So the target cannot be reliably calculated at minute degree.
A better way to see where minute wave v is likely to end is the i-iii trend line. It is very common for the fifth wave of a contracting diagonal to overshoot the i-iii trend line. Only when this line is overshot would I consider and end to primary wave 3.
First Hourly Wave Count
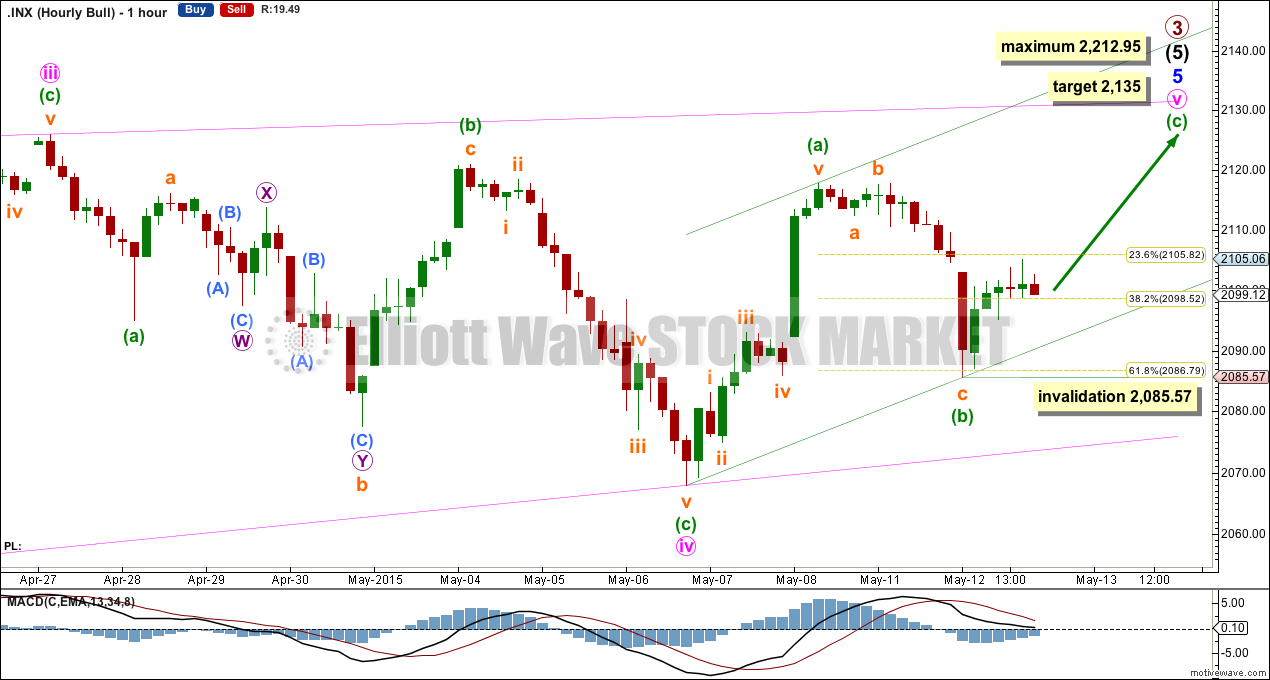
Minuette wave (b) has moved lower and subdivides as a zigzag ending just below the 0.618 Fibonacci ratio. Because of the depth and duration it is more likely that minuette wave (b) is now over.
However, on the five minute chart the first upwards wave within minuette wave (c) has a corrective count of seven; this upward movement does not subdivide as a completed five. It may resolve itself with some more upwards movement when markets open tomorrow, but if it does not then the second hourly wave count below must be considered as a serious possibility for the short term.
If minuette wave (b) is over now, then at 2,135 minuette wave (c) would reach equality in length with minuette wave (a). If this target is wrong it may be too low not allowing for a big enough overshoot of the pink i-iii trend line of the diagonal.
Within minuette wave (c) no second wave correction may move beyond the start of its first wave below 2,085.57.
Second Hourly Wave Count
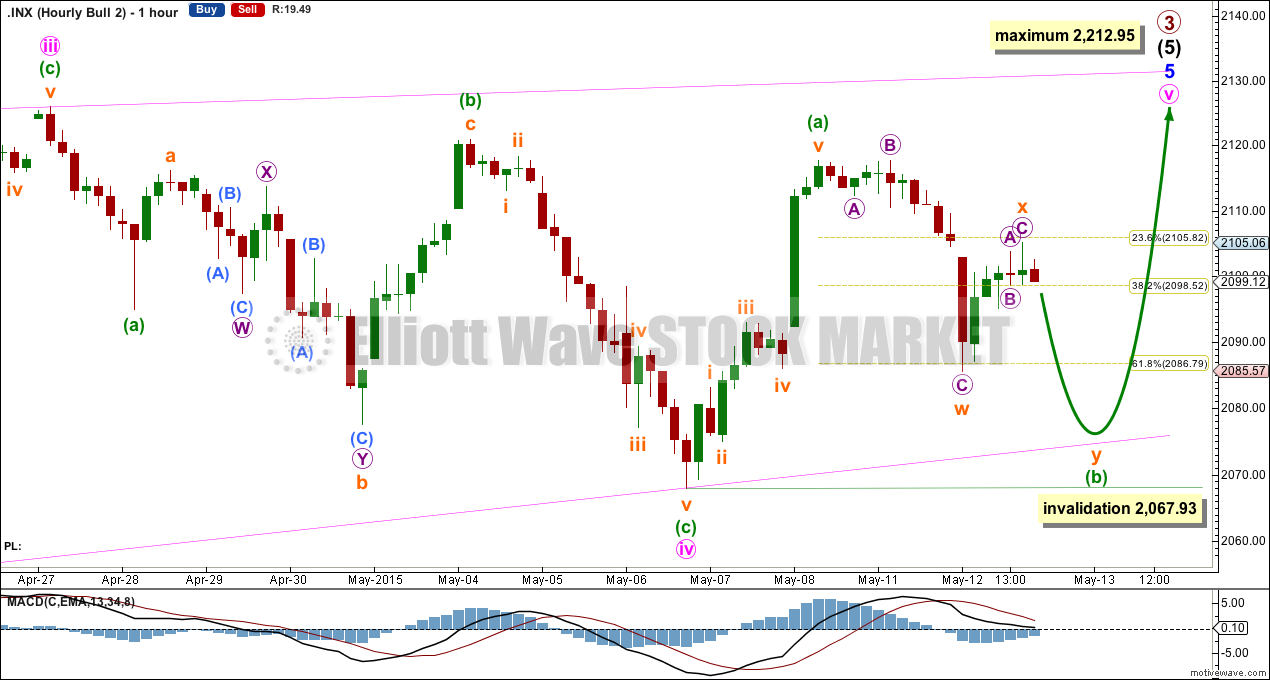
This second wave count simply moves the degree of labelling within minuette wave (b) all down one degree and looks at the possibility that it may continue lower as a double zigzag.
I am considering a double zigzag for this wave count because subminuette wave x is brief and shallow. If this were to be a combination the X wave would most likely be deeper than this. Double zigzags normally have brief shallow X waves.
If minuette wave (b) continues lower it may end when price finds support at the lower pink ii-iv trend line of the diagonal. I would not expect this trend line to be breached while minor wave 5 is incomplete.
Minuette wave (b) may not move beyond the start of minuette wave (a) below 2,067.93.
This second wave count expects another one or two days of downwards movement.
Bear Wave Count
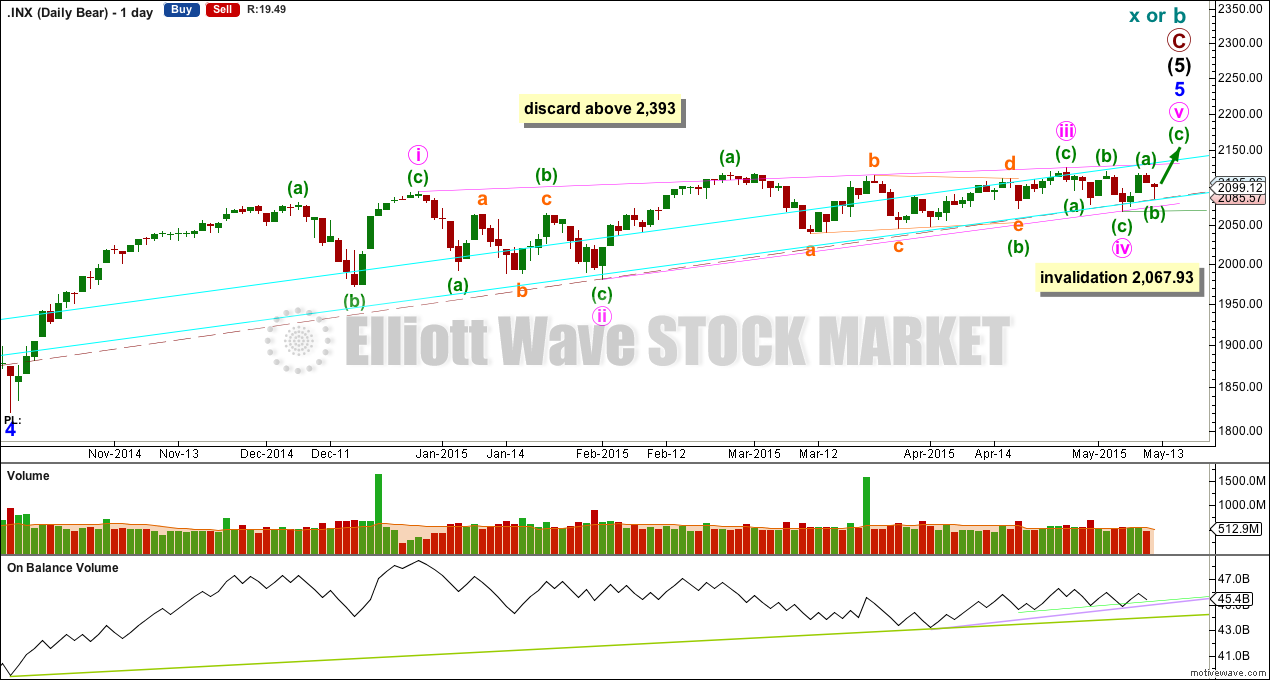
The subdivisions within primary waves A-B-C are seen in absolutely exactly the same way as primary waves 1-2-3 for the bull wave count.
To see the difference at the monthly chart level between the bull and bear ideas look at the last historical analysis here.
At cycle degree wave b is over the maximum common length of 138% the length of cycle wave a, at 167% the length of cycle wave a. At 2,393 cycle wave b would be twice the length of cycle wave a and at that point this bear wave count should be discarded.
While we have no confirmation of this wave count we should assume the trend remains the same, upwards. This wave count requires confirmation before I have confidence in it. Full and final confirmation that the market is crashing would only come with a new low below 1,370.58. However, structure and momentum should tell us long before that point which wave count is correct, bull or bear.
On Balance Volume should continue to find support at the trend lines drawn. When the longer held green trend line is broken by OBV a trend change would be supported.
This analysis is published about 09:11 p.m. EST.
Another failure yesterday (number six) of transports to re-take and hold 200 DMA… I think a reversal is very close….