
Upwards movement is not enough to invalidate or confirm any of the three hourly wave counts from last Elliott wave analysis.
Summary: A new high above 2,125.92 would confirm the final fifth wave up is underway. While price remains below 2,125.92 it is possible that the fourth wave is still unfolding and will move price lower to 2,071, but not below 2,013.27.
To see a weekly chart showing how to draw trend lines and the structure of primary wave 3 go here.
Click charts to enlarge.
Bull Wave Count
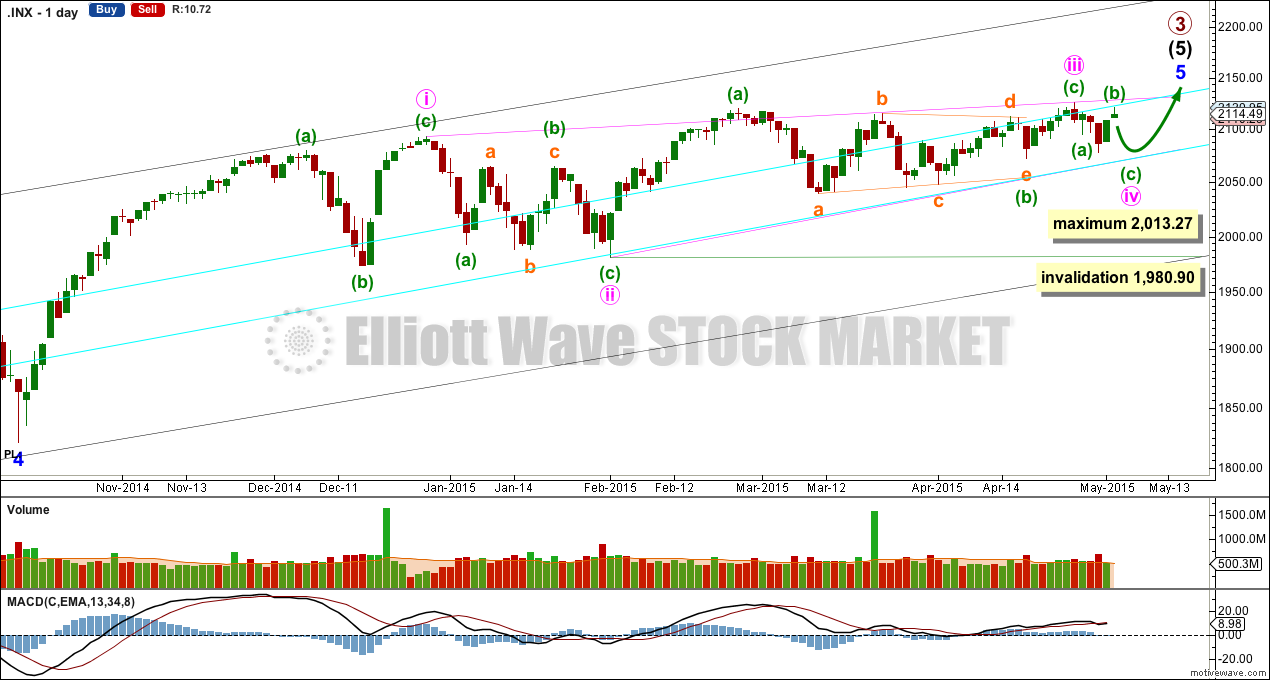
Both bull and bear wave counts see minor wave 5 as an ending contracting diagonal.
Minor wave 5 begins here as labelled. All this choppy overlapping movement with declining momentum fits for a diagonal. An ending diagonal requires all sub waves to be zigzags, and the fourth wave must overlap back into first wave price territory. Elliott wave convention is to always draw the trend lines about a diagonal to indicate the structure is a diagonal.
The diagonal for minor wave 5 would be contracting: minute wave iii is shorter than minute wave i. Minute wave iv must be shorter than minute wave ii, the maximum length for minute wave iv is equality in length with minute wave ii at 2,013.27. The rule for the end of a fourth wave within a diagonal is it must overlap back into minute wave i price territory below 2,093.55 and it may not move beyond the end of minute wave ii below 1,980.90.
Minute wave iv would be most likely to end when price again comes to touch the lower aqua blue trend line.
I don’t have a target for primary wave 3 to end yet because I don’t think minor wave 5 will exhibit a Fibonacci ratio to either of minor waves 3 and 1, because there is already a ratio between 3 and 1. Likewise at intermediate degree: intermediate waves (1) and (3) have a close ratio so intermediate wave (5) may not exhibit a ratio to either of (1) or (3). The best way to see where this upwards movement is likely to end is the i-iii trend line of the diagonal, as it is likely to be slightly overshot.
I will present only two wave counts today and leave wave count #1 from last analysis out, because it adds nothing to the analysis and it was the least likely of the three.
I favour the main hourly wave count (labelled #3 in last analysis) because it would see minute wave iv last longer (maybe to end in another three days totalling a Fibonacci eight) and move lower to again come to touch the lower aqua blue trend line.
Main Hourly Wave Count
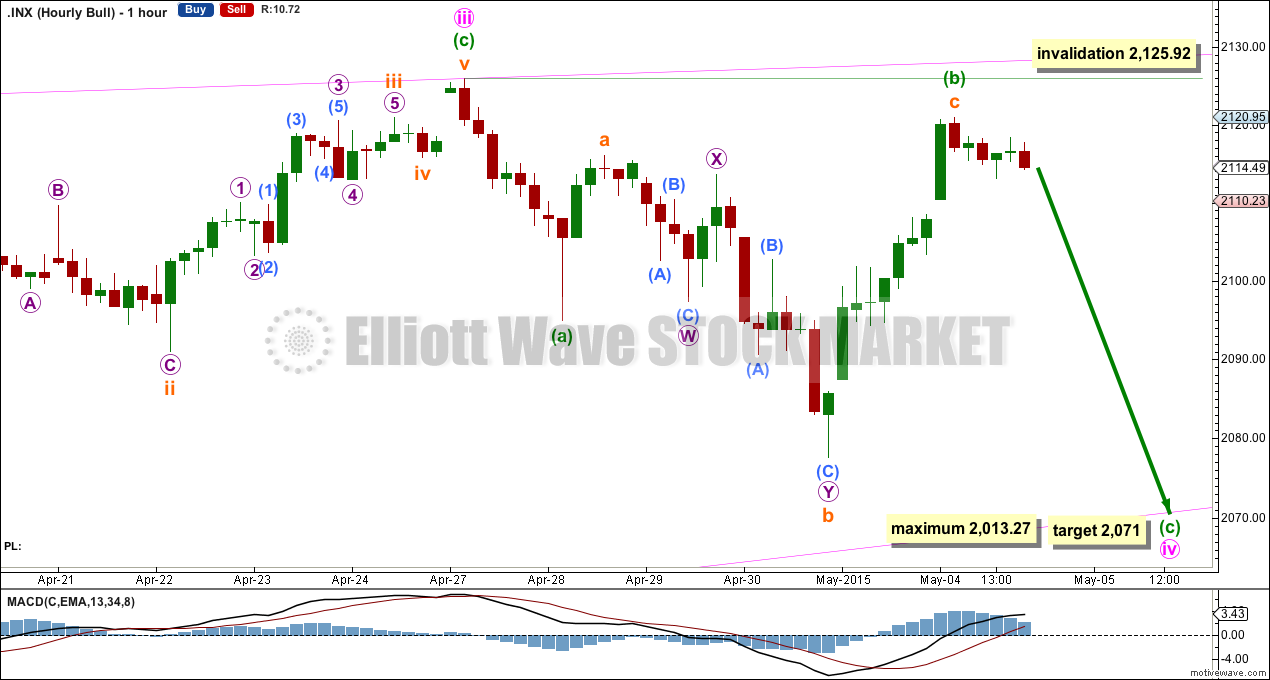
If minute wave iv is not over then the best fit for it to continue is minuette wave (a) as a short impulse, and minuette wave (b) an expanded flat correction. The subdivisions within subminuette wave c are seen as a five wave structure, with a very short first and an extended third wave on the five minute chart.
Within the expanded flat of minuette wave (b) subminuette wave b is 1.8 times the length of subminuette wave a. This is less than twice the length of subminuette wave a so it is acceptable. Subminuette wave c has moved slightly above the end of subminuette wave a at 2,116.09 avoiding a truncation and a very rare running flat.
At 2,071 minuette wave (c) would reach 1.618 the length of minuette wave (a). This target would nicely bring price down to touch the lower aqua blue trend line on the daily chart. If it takes three days to get there then minute wave iv may total a Fiboancci eight days (sessions).
Minute wave iv may not be longer than equality with minute wave ii because the diagonal is contracting and may not move below 2,013.27.
Alternate Hourly Wave Count
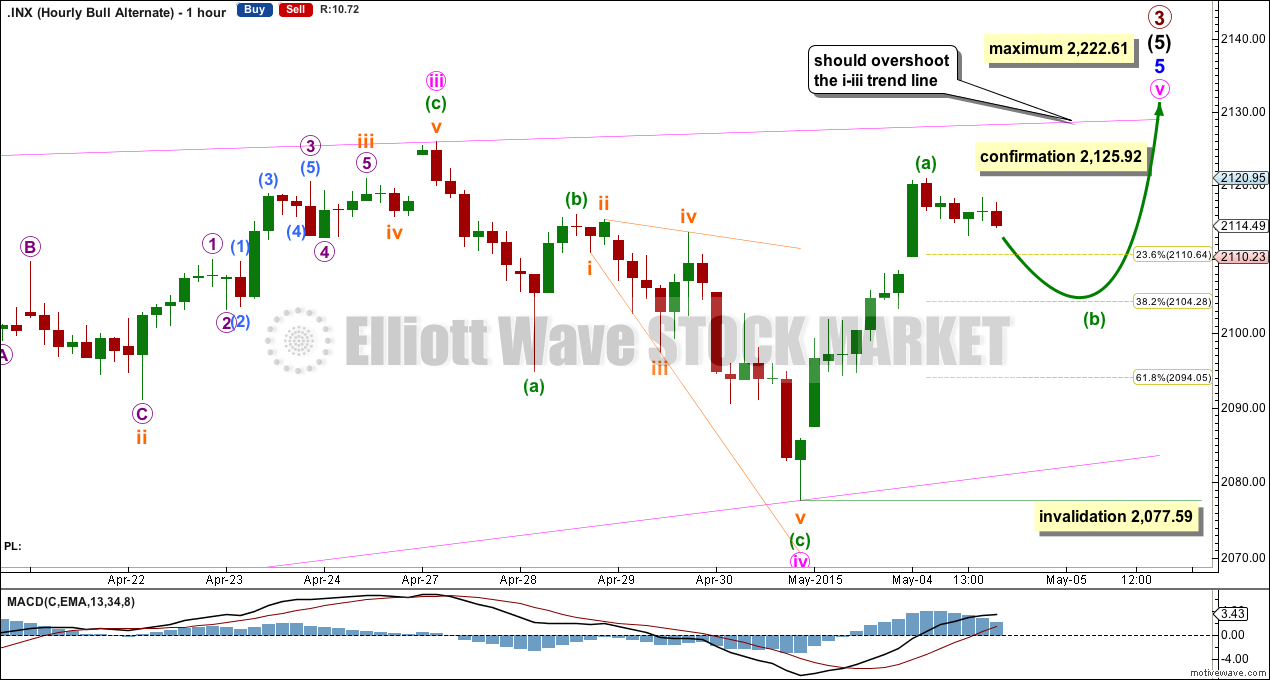
This is the bullish wave count. It is possible to see minute wave iv as a complete zigzag if minuette wave (c) is an ending expanding diagonal.
Minute wave v must subdivide as a zigzag because this is a fifth wave within an ending diagonal. All the sub waves at minute degree must be zigzags.
Within minute wave v minuette wave (a) may be complete. This upwards movement subdivides as a five wave impulse on the five minute chart with a very short first wave and an extended third wave.
Minuette wave (b) would most likely correct down to the 0.382 Fibonacci ratio about 2,104. It may not move beyond the start of minuette wave (a) below 2,077.59.
When minuette waves (a) and (b) are complete then a price target for minute wave v to end can be calculated using the ratio between minuette waves (a) and (c). That cannot be done yet.
This wave count requires confirmation above 2,125.92.
If minute wave iv is over then minute wave v may not be longer than equality with minute wave iii, because the diagonal of minor wave 5 is contracting and a third wave may never be the shortest. Minute wave v has its limit at 2,222.61.
Minute wave v would be extremely likely to overshoot the i-iii trend line of the diagonal. Only when that line is overshot would this wave count look for a trend change. When minuette waves (a) and (b) within minute wave v are complete then the ratio between minuette waves (a) and (c) may be used to calculate a price target for upwards movement to end. That cannot be done yet.
Bear Wave Count
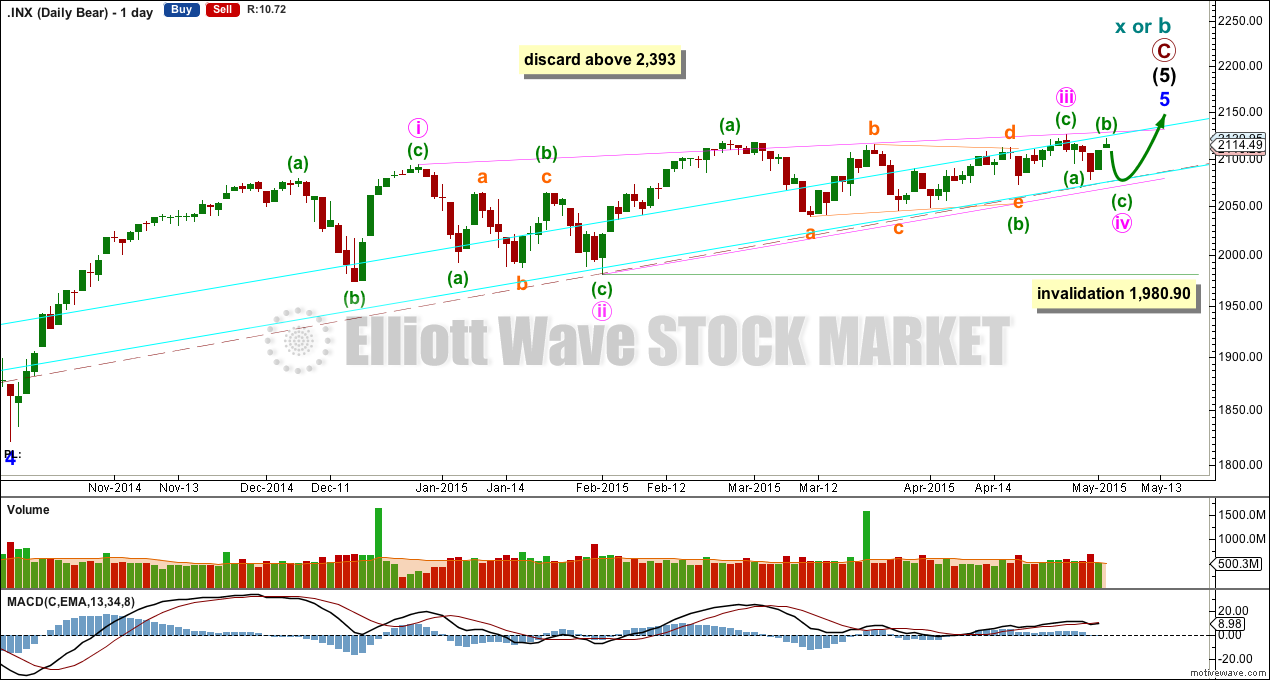
The subdivisions within primary waves A-B-C are seen in absolutely exactly the same way as primary waves 1-2-3 for the bull wave count. The alternate bull wave count idea also works perfectly for this bear wave count.
To see the difference at the monthly chart level between the bull and bear ideas look at the last historical analysis here.
At cycle degree wave b is over the maximum common length of 138% the length of cycle wave a, at 167% the length of cycle wave a. At 2,393 cycle wave b would be twice the length of cycle wave a and at that point this bear wave count should be discarded.
While we have no confirmation of this wave count we should assume the trend remains the same, upwards. This wave count requires confirmation before I have confidence in it. Full and final confirmation that the market is crashing would only come with a new low below 1,370.58. However, structure and momentum should tell us long before that point which wave count is correct, bull or bear.
This analysis is published about 04:52 p.m. EST.
Looks like there will be a return to the 2077 area prior to final wave up; sitting on a few SPY puts to capture the move…