
A new low below 2,086.38 indicated further downwards movement to end before 2,013.27, most likely to end at the lower aqua blue trend line.
Summary: I have just the one bull and the one bear wave count today. They both expect the same direction next and they won’t diverge probably for months. In the short term tomorrow I expect a little more downwards movement to 2,065 which may bring price to touch the lower aqua blue trend line. I do not expect price to move below 2,013.27 prior to new highs.
Click charts to enlarge.
Bull Wave Count
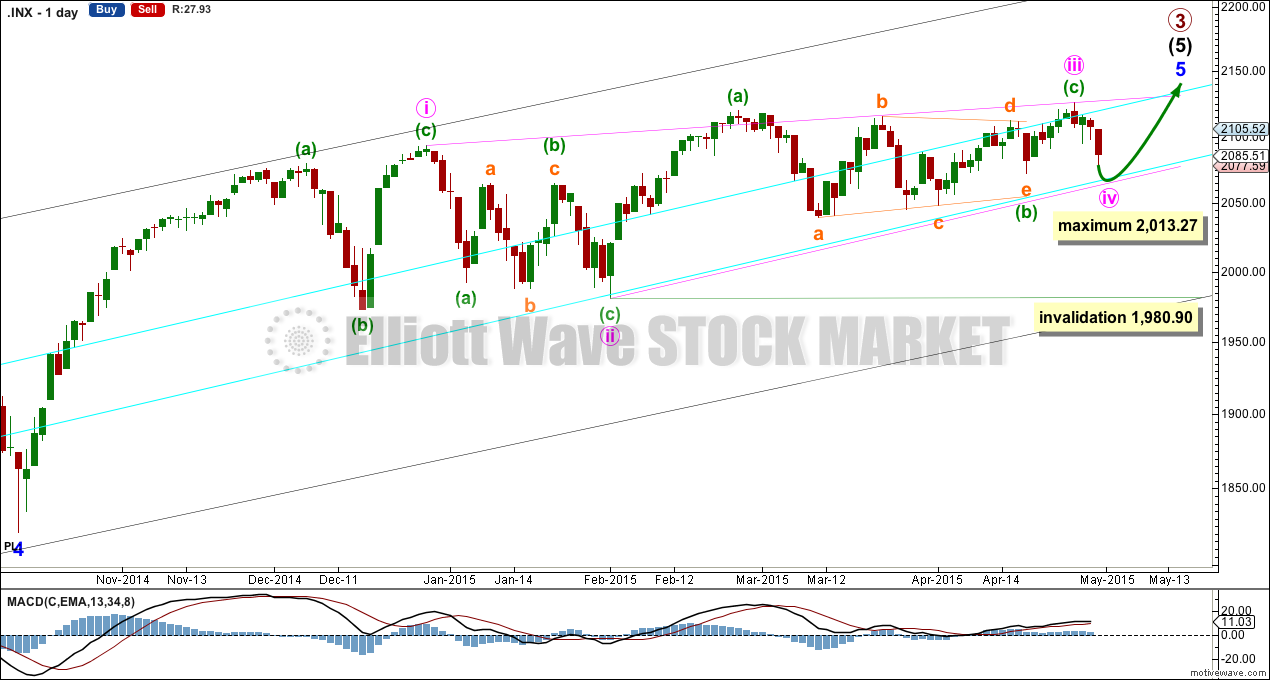
Both bull and bear wave counts see minor wave 5 as an ending contracting diagonal.
Minor wave 5 begins here as labelled. All this choppy overlapping movement with declining momentum fits for a diagonal. An ending diagonal requires all sub waves to be zigzags, and the fourth wave must overlap back into first wave price territory. Elliott wave convention is to always draw the trend lines about a diagonal to indicate the structure is a diagonal.
The diagonal for minor wave 5 would be contracting: minute wave iii is shorter than minute wave i. Minute wave iv must be shorter than minute wave ii, the maximum length for minute wave iv is equality in length with minute wave ii at 2,013.27. The rule for the end of a fourth wave within a diagonal is it must overlap back into minute wave i price territory below 2,093.55 and it may not move beyond the end of minute wave ii below 1,980.90.
Minute wave iv would be most likely to end when price again comes to touch the lower aqua blue trend line.
I don’t have a target for primary wave 3 to end yet because I don’t think minor wave 5 will exhibit a Fibonacci ratio to either of minor waves 3 and 1, because there is already a ratio between 3 and 1. Likewise at intermediate degree: intermediate waves (1) and (3) have a close ratio so intermediate wave (5) may not exhibit a ratio to either of (1) or (3). The best way to see where this upwards movement is likely to end is the i-iii trend line of the diagonal, as it is likely to be slightly overshot.
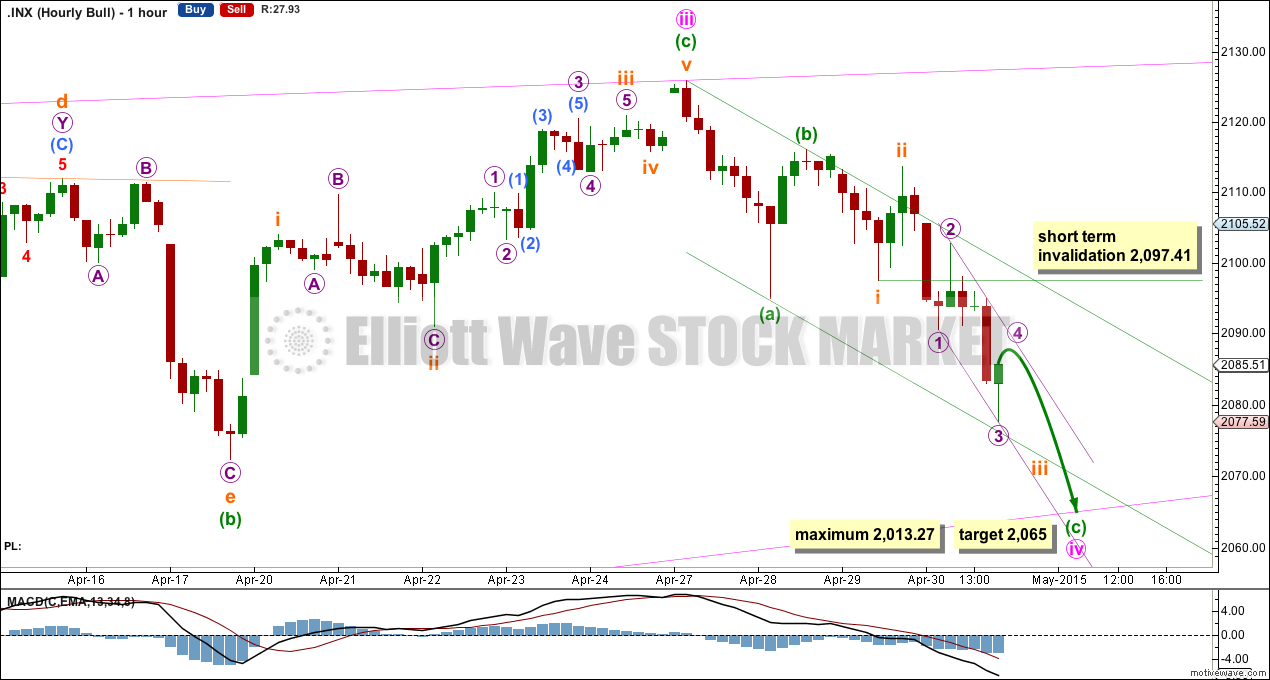
Minute wave iv must subdivide as a zigzag and must have a corrective wave count of 3, 7, 11 etc (adding multiples of 4 as each sub wave extends). So far it has a count of seven so it is possible it could be complete. However, I would expect it to last a little longer than just two days and to reach down to the lower aqua blue trend line on the daily chart. In trying to label it as a complete zigzag minuette wave (c) would have to be an ending diagonal, and the wave lengths within that idea do not meet the rules for diagonals because the actionary waves would be increasing in length while the reactionary waves would be decreasing in length.
At 2,065 minuette wave (c) would reach 1.618 the length of minuette wave (a).
Within minuette wave (c) subminuette waves i and ii are complete. Subminuette waves iii, iv and v need to complete. I have drawn a narrow channel about subminuette wave iii. The upper edge may show where micro wave 4 finds resistance. This often works, but not always, and is less likely to work if the channel is particularly steep as this one is.
I have also drawn a wider channel about this zigzag of minute wave iv. Minuette wave (c), if it is time consuming, may end about the lower edge of this green channel. If it is quicker it may overshoot the lower edge of this channel. When this wider green channel is clearly breached by a full hourly candlestick above it and not touching the upper edge that shall provide trend channel confirmation that the zigzag of minute wave iv is over and the final wave up for minute wave v would then have begun to new highs.
Subminuette wave iv may not move into subminuette wave i price territory above 2,097.41. This invalidation point only applies while the structure of minute wave iv is incomplete.
Minute wave iv may not be longer than equality in length with minute wave ii at 2,013.27.
Bear Wave Count
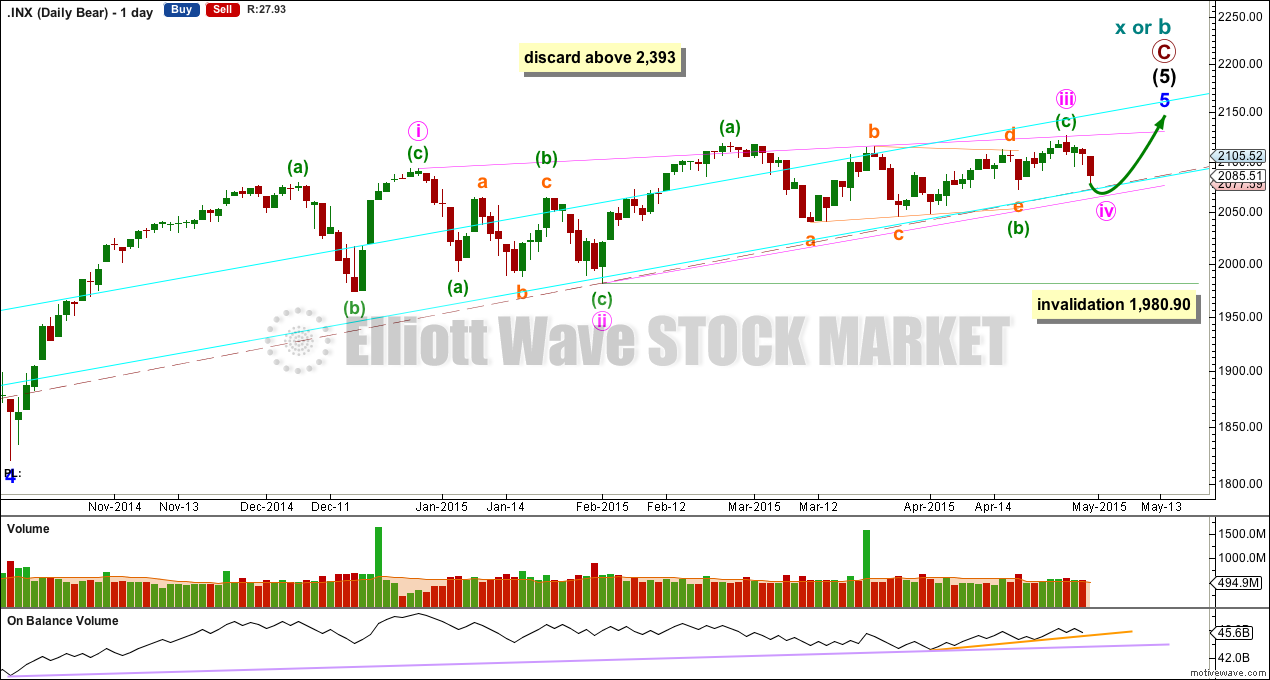
The subdivisions within primary waves A-B-C are seen in absolutely exactly the same way as primary waves 1-2-3 for the bull wave count. The alternate bull wave count idea also works perfectly for this bear wave count.
To see the difference at the monthly chart level between the bull and bear ideas look at the last historical analysis here.
At cycle degree wave b is over the maximum common length of 138% the length of cycle wave a, at 167% the length of cycle wave a. At 2,393 cycle wave b would be twice the length of cycle wave a and at that point this bear wave count should be discarded.
While we have no confirmation of this wave count we should assume the trend remains the same, upwards. This wave count requires confirmation before I have confidence in it. Full and final confirmation that the market is crashing would only come with a new low below 1,370.58. However, structure and momentum should tell us long before that point which wave count is correct, bull or bear.
Weekly Wave Count – On Balance Volume
On Balance Volume is finding support at two recent trend lines, the longer held lilac line is shown also on the weekly chart below. In the first instance for this bear wave count the shorter daily trend line (orange) needs to be breached. After that a breach of the lilac line would indicate a potential trend change for the S&P.
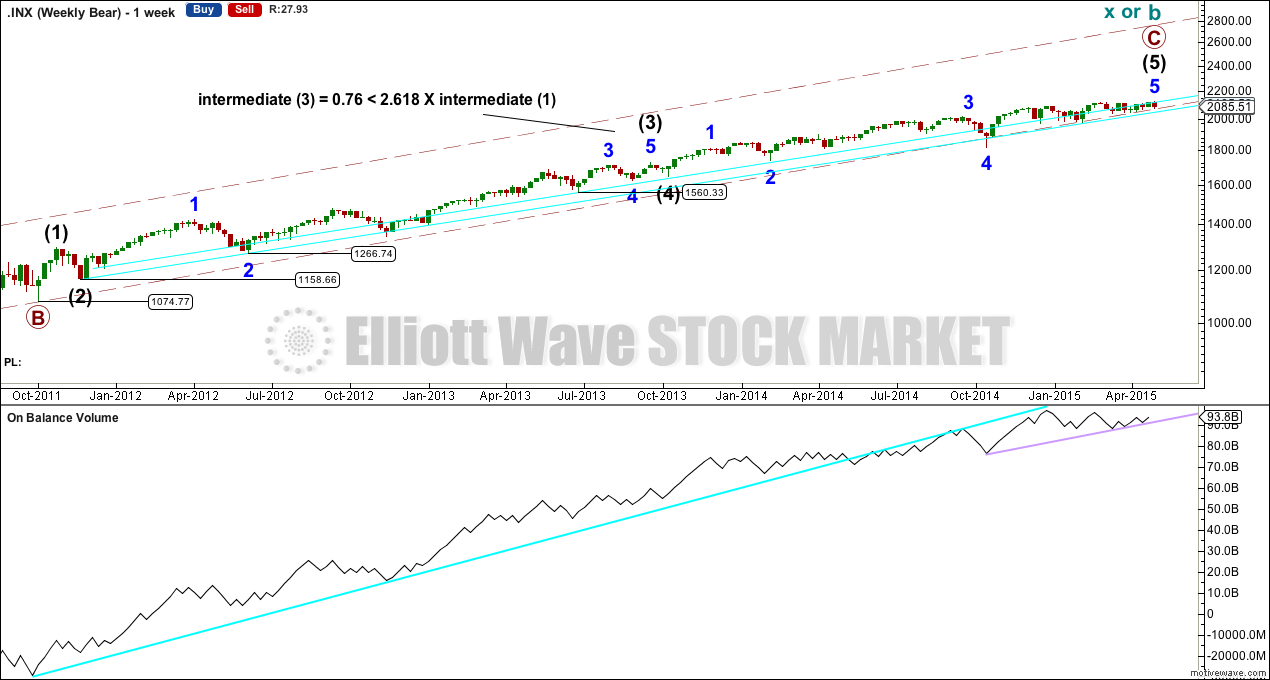
I have noticed a couple of interesting things happening with On Balance Volume at the weekly chart level. An important trend line (blue) was breached back in May 2014, which then provided resistance. A smaller trend line (lilac) is providing support. If this smaller trend line is breached then OBV would be indicating a potential trend change.
This analysis is published about 08:50 p.m. EST.
Looks like C down completed yesterday. Looking for VIX to trade below 12 to signal impending new high…