Upwards movement was expected, but did not happen. Price remains within the diagonal trend lines and above the invalidation point on the hourly Elliott wave chart.
Summary: I have a new wave count today which is a slight variation on yesterday’s wave count. A new high above 2,125.92 would indicate more upwards movement, but only to a short term target at 2,132 – 2,134. A new low below 2,086.38 would indicate more downwards movement to end below 2,093.55 and above 2,013.27, most likely to end when price again touches the lower aqua blue trend line.
Click charts to enlarge.
Weekly Bull Wave Count
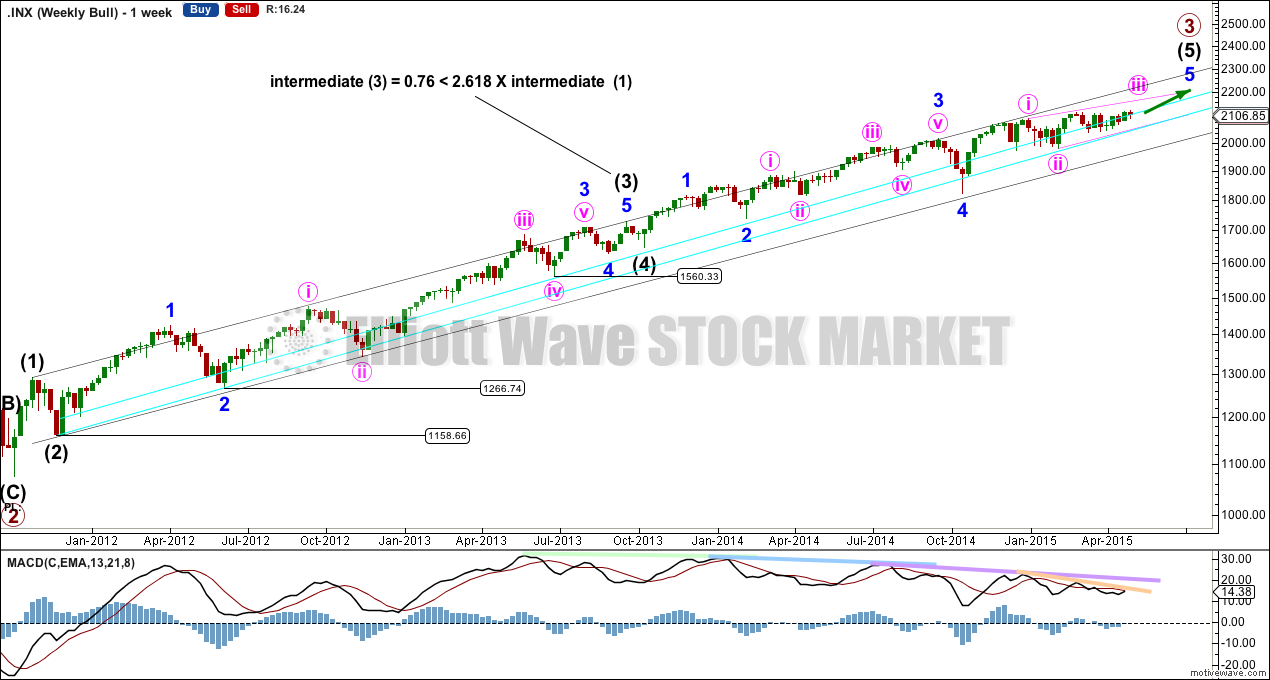
At the weekly chart level I want to see a wave count with intermediate wave (3) at just under 2.618 the length of intermediate wave (1), and subdividing perfectly as an impulse. At the weekly chart level intermediate wave (3) has stronger momentum so far than intermediate waves (1) and (5). This third wave cannot be the weakest.
The two daily charts below both see intermediate waves (3) and (4) as labelled here.
There is now quadruple technical divergence between price and MACD. This indicates a maturing trend.
If intermediate wave (5) is seen as an impulse with a combination for minor wave 2 and a zigzag for minor wave 4 (perfect alternation) then at the weekly chart level minor wave 3 does not have the weakest momentum. Minor wave 3 is 11 points longer than 1.618 the length of minor wave 1. Minor wave 5 is seen as an ending contracting diagonal.
Keep drawing the aqua blue trend lines on weekly and daily charts on a semi log scale as shown. The lower line is repeatedly tested, shallow and long held. It is highly technically significant and should continue to provide support while the S&P is in a bull market.
First Bull Wave Count
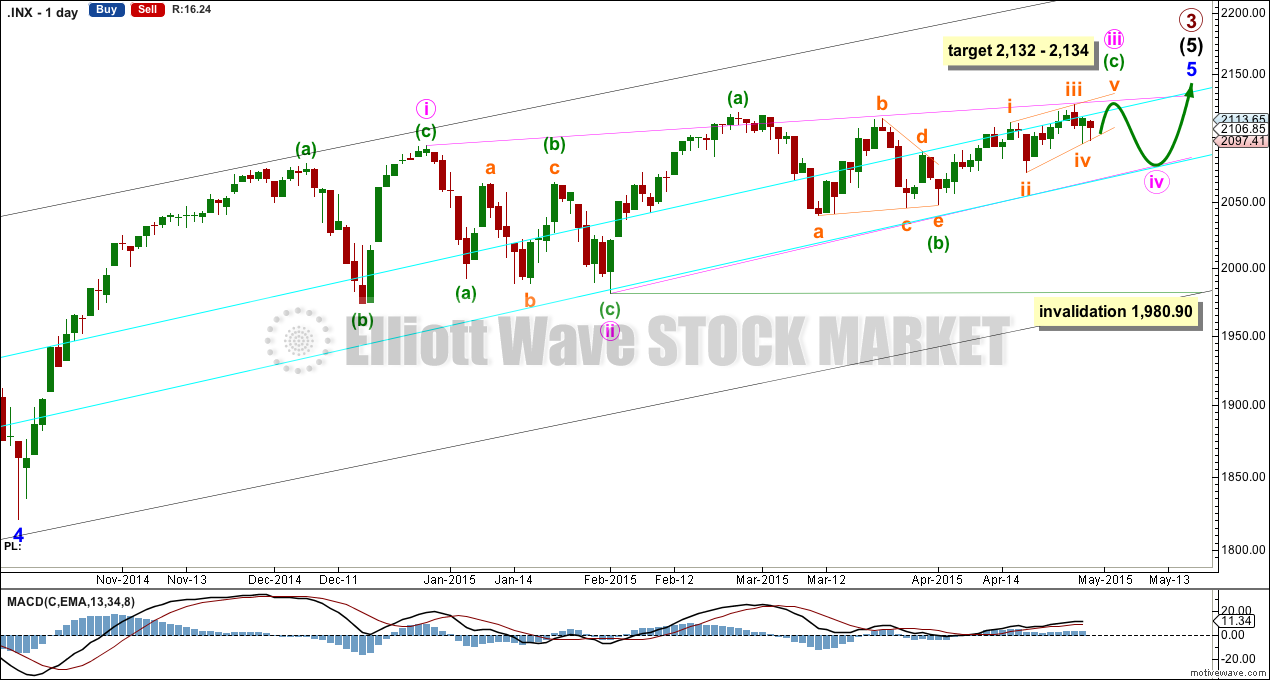
Both bull daily wave counts see minor wave 5 as an ending contracting diagonal. They have an even probability; I can favour neither wave count. Neither wave count has any problems which reduce its probability below the other, nor does either wave count have any specific points which increase its probability over the other.
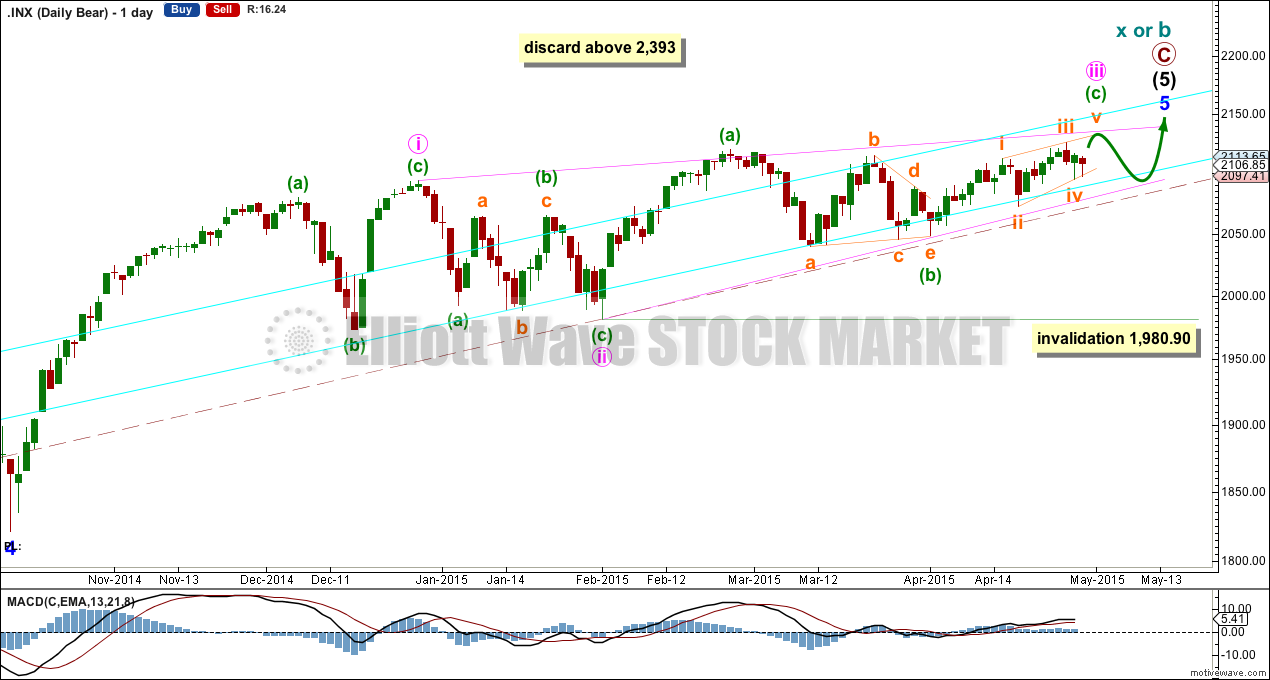
Minor wave 5 begins here as labelled. All this choppy overlapping movement with declining momentum fits for a diagonal. An ending diagonal requires all sub waves to be zigzags, and the fourth wave must overlap back into first wave price territory. Elliott wave convention is to always draw the trend lines about a diagonal to indicate the structure is a diagonal.
If there is a triangle as labelled here then it may be a B wave within one of the zigzags of the diagonal.
Minute wave iii must subdivide as a zigzag because it is a third wave within a diagonal. At 2,134 minuette wave (c) would reach 0.618 the length of minuette wave (a).
When minute wave iii is over then it will be known if the diagonal is expanding or contracting (a contracting diagonal is more common). When minute wave iii is over then minute wave iv must move back down into minute wave i price territory below 2,093.55. The rule for the end of a fourth wave of a diagonal is it may not move beyond the end of the second wave here below 1,980.90. Minute wave iv may find strong support at the lower aqua blue trend line.
Within this diagonal for minor wave 5 minute wave ii is a 0.41 correction of minute wave i. This is more shallow than the normal depth of 0.66 to 0.81, but in this case it may have been forced to be more shallow than usual by the strong support offered by the lower aqua blue trend line. If it ends there the diagonal would be contracting.
A final zigzag up for minute wave v would still be required to complete the entire structure. It would most likely overshoot the i-iii trend line.
I don’t have a target for primary wave 3 to end yet because I don’t think minor wave 5 will exhibit a Fibonacci ratio to either of minor waves 3 and 1, because there is already a ratio between 3 and 1. Likewise at intermediate degree; intermediate waves (1) and (3) have a close ratio so intermediate wave (5) may not exhibit a ratio to either of (1) or (3). The best way to see where this upwards movement is likely to end is the i-iii trend line of the diagonal, as it is likely to be slightly overshot.
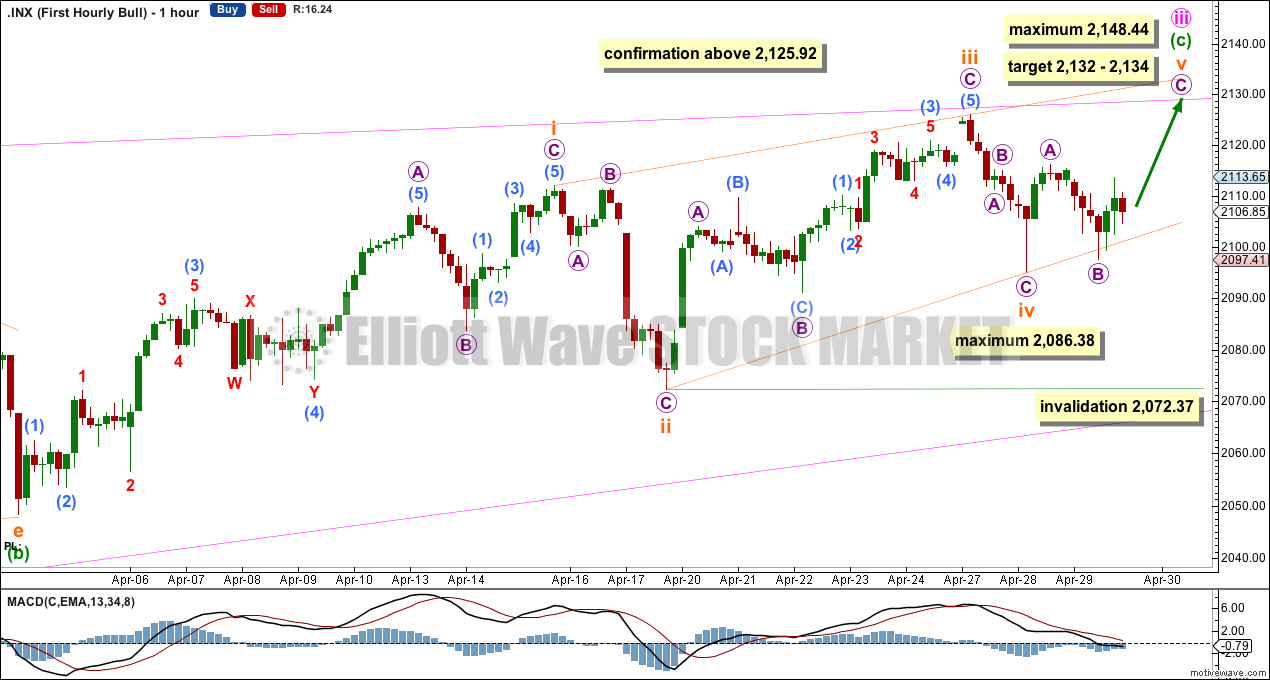
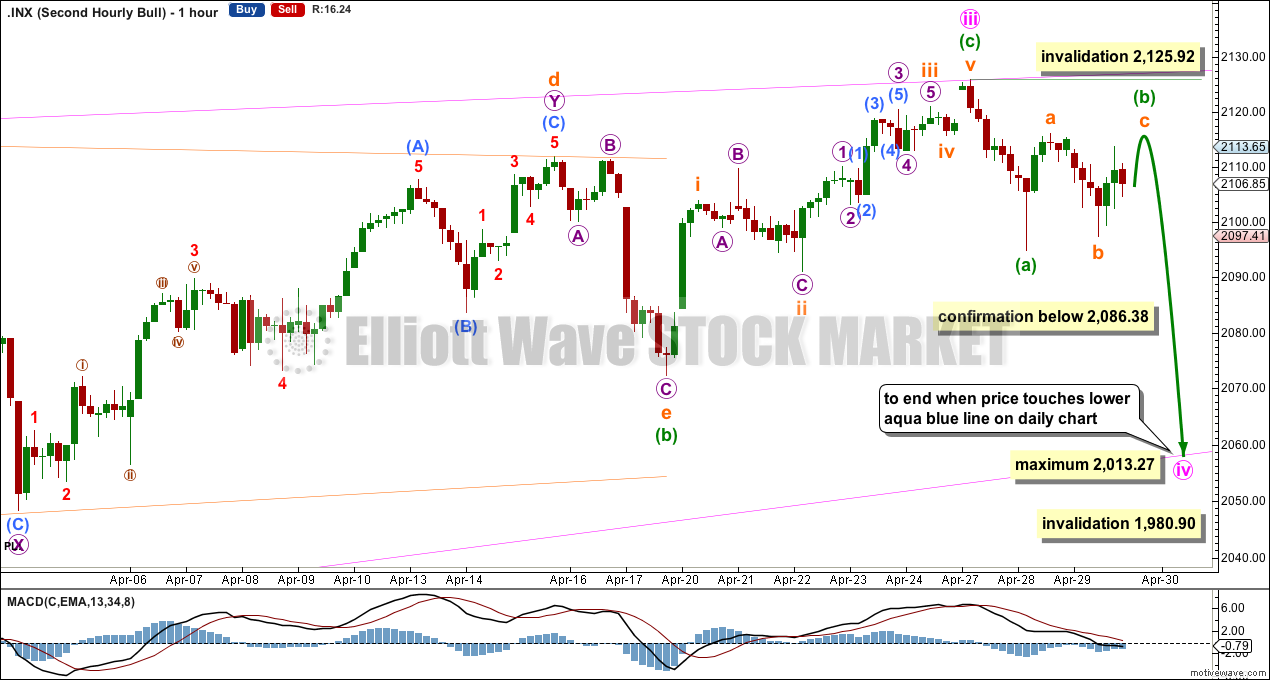
The hourly chart shows only minuette wave (c) so far within minute wave iii.
Minuette wave (c) must subdivide as a five wave structure, either an impulse or an ending diagonal.
This wave count sees minuette wave (c) as an ending contracting diagonal.
Within the ending diagonal subminuette wave ii is 0.62 of subminuette wave i, and subminuette wave iv 0.58 of subminuette wave iii. The normal range for second and fourth waves of diagonals is between 0.66 to 0.81. That these waves are slightly shallower than the normal range is only a slight detraction.
If subminuette wave iv continues any lower then because the diagonal is contracting it should not be longer than subminuette wave ii. This gives a limit for subminuette wave iv to no lower than 2,086.38. If price moves below 2,086.38 I would discard the first wave count in favour of the second.
If subminuette wave v has begun then at 2,132 micro wave C would reach 1.618 the length of micro wave A.
The diagonal of minuette wave (c) is contracting. This limits subminuette wave v to no longer than equality with subminuette wave iii at 2,148.44.
The rule for a fourth wave within a diagonal is it must overlap back into first wave price territory (it does) and it may not move beyond the end of the second wave below 2,072.37.
Second Bullish Wave Count
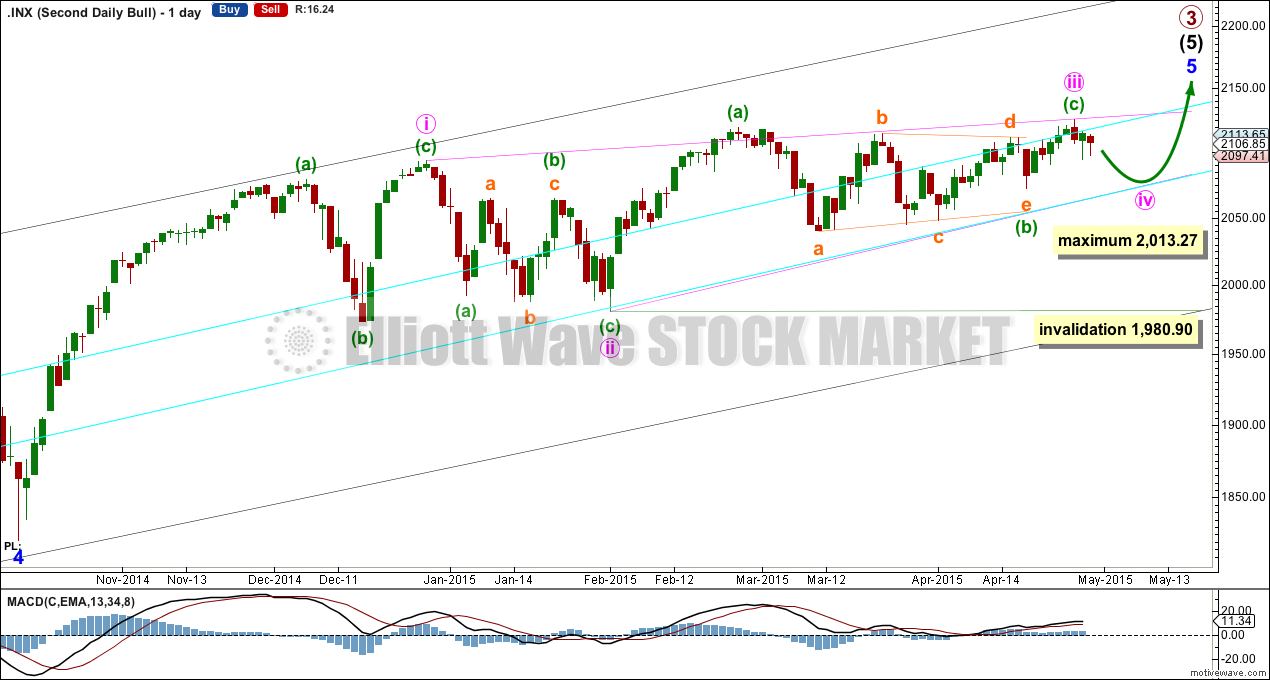
Both bull wave counts are identical up to the high labelled minuette wave (a) within minute wave iii zigzag.
Thereafter, this second bull wave count looks at the possible triangle ending later, with a strong undershoot of the a-c trend line for the final e wave.
If the triangle within minute wave iii ends there then minute wave iii may be over. Minute wave iv may be underway.
The diagonal for minor wave 5 would be contracting: minute wave iii is shorter than minute wave i. Minute wave iv must be shorter than minute wave ii, the maximum length for minute wave iv is equality in length with minute wave ii at 2,013.27. The rule for the end of a fourth wave within a diagonal is it must overlap back into minute wave i price territory below 2,093.55 and it may not move beyond the end of minute wave ii below 1,980.90.
Minute wave iv would be most likely to end when price again comes to touch the lower aqua blue trend line.
If minute wave iv has begun then it must subdivide as a zigzag and it must move below 2,093.55 so that it overlaps back into minute wave i price territory.
Minute wave iv must end below 2,093.55 and above 2,103.27. Within this range, when price touches the lower aqua blue trend line, this is when and where I would expect minute wave iv to end.
Within the zigzag of minute wave iv minuette wave (b) may not move beyond the start of minuette wave (a) above 2,125.92.
If price makes a new low below 2,086.38 I would discard the first bull wave count leaving only this second count.
Bear Wave Count
The subdivisions within primary waves A-B-C are seen in absolutely exactly the same way as primary waves 1-2-3 for the bull wave count. The alternate bull wave count idea also works perfectly for this bear wave count.
To see the difference at the monthly chart level between the bull and bear ideas look at the last historical analysis here.
At cycle degree wave b is over the maximum common length of 138% the length of cycle wave a, at 167% the length of cycle wave a. At 2,393 cycle wave b would be twice the length of cycle wave a and at that point this bear wave count should be discarded.
While we have no confirmation of this wave count we should assume the trend remains the same, upwards. This wave count requires confirmation before I have confidence in it. Full and final confirmation that the market is crashing would only come with a new low below 1,370.58. However, structure and momentum should tell us long before that point which wave count is correct, bull or bear.
This analysis is published about 09:15 p.m. EST.

Social mood in the US is turning decidedly negative. You may not have seen the news on the ongoing protests in places like Ferguson, New Youk, and Baltimore but unrest over things like excessive police force seems to be spreading. Hope to visit beautiful NZ someday..they should build a LOTR theme park!!!
Wave four getting pretty close to wave one territory to fulfill ending diagonal requirements. Final icing on the cake would be blow-off overshoot above ED 1-3 trend-line…would not be surprised to see intra-day print above 2150.00
How quickly should we expect retrace to return to ED orgination?
If the bear wave count is correct then we need to see all vestiges of bearishness evaporate in one more push to new all time highs.
I’m noticing some interesting things socially. But then, I’m in New Zealand and although we’re affected by the USA we are a different market.
So this is just a commentary, it’s not definitive, and it may be subject to disbelief. That’s okay.
I noticed a lot of bright fluro colours out recently. You can’t get much brighter than fluro, and the last time I recall fluro colours was in 1987. The 1987 stock market crash hit NZ very hard.
Last weekend I notice colours for womens clothing are now very dull, browns and greys for our winter. Such a big change. With the short lead time between manufacture and sale now I wonder if this is an indicator of social mood turning.
There’s still plenty of talk about bubbles popping here in NZ ATM, I think that needs to go before the market would be ready to turn here.
I can’t really comment on social mood in the USA, what with being literally on the other side of the planet and all.