Downwards movement was expected, but did not happen. The main Elliott wave count (which was unconfirmed) was invalidated. I have two remaining Elliott wave counts.
Summary: The target for the main wave count is now at 2,187. The target for the more bullish alternate is first at 2,571.
Click charts to enlarge.
Bullish Wave Count
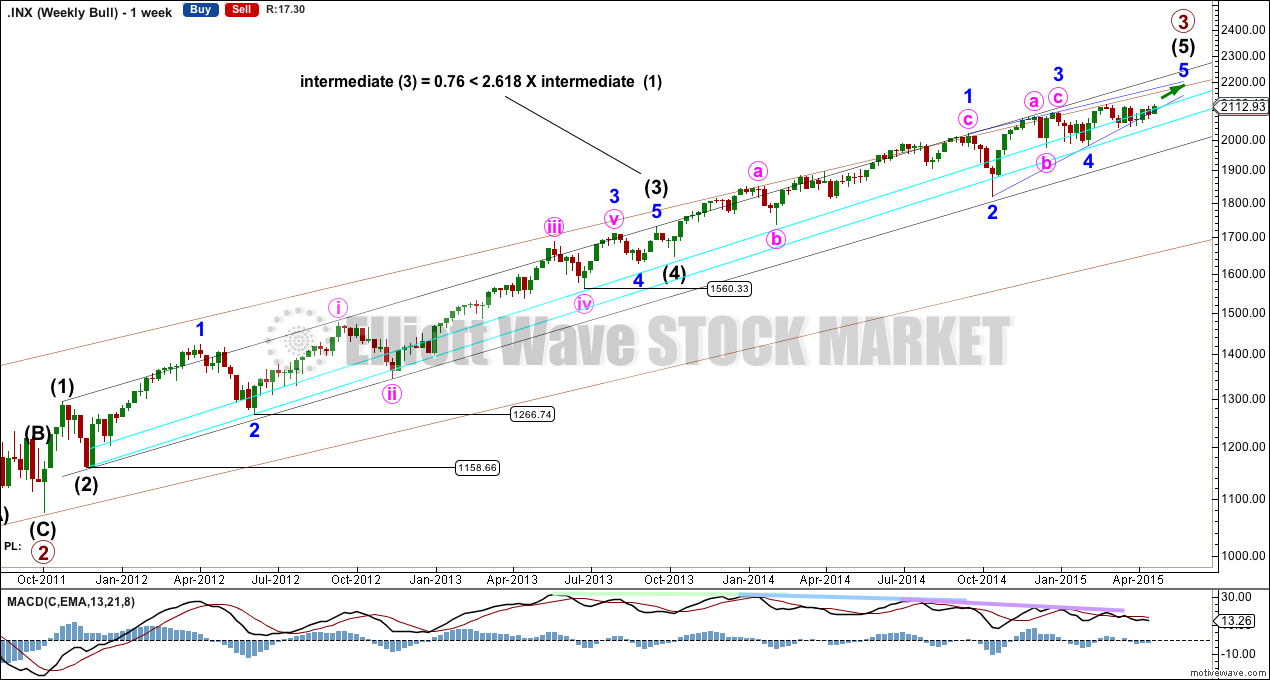
At the weekly chart level I want to see a wave count with intermediate wave (3) at just under 2.618 the length of intermediate wave (1), and subdividing perfectly as an impulse. At the weekly chart level intermediate wave (3) has stronger momentum so far than intermediate wave (5). So far the third wave is not the weakest. If intermediate wave (5) shows an increase in momentum at the weekly chart level beyond that seen for intermediate wave (3) this wave count must be revised.
The two bullish daily charts below both see intermediate waves (3) and (4) as labelled here.
There is now quadruple technical divergence between price and MACD. This indicates a maturing trend. For this reason I will keep the main wave count as the less bullish of the two.
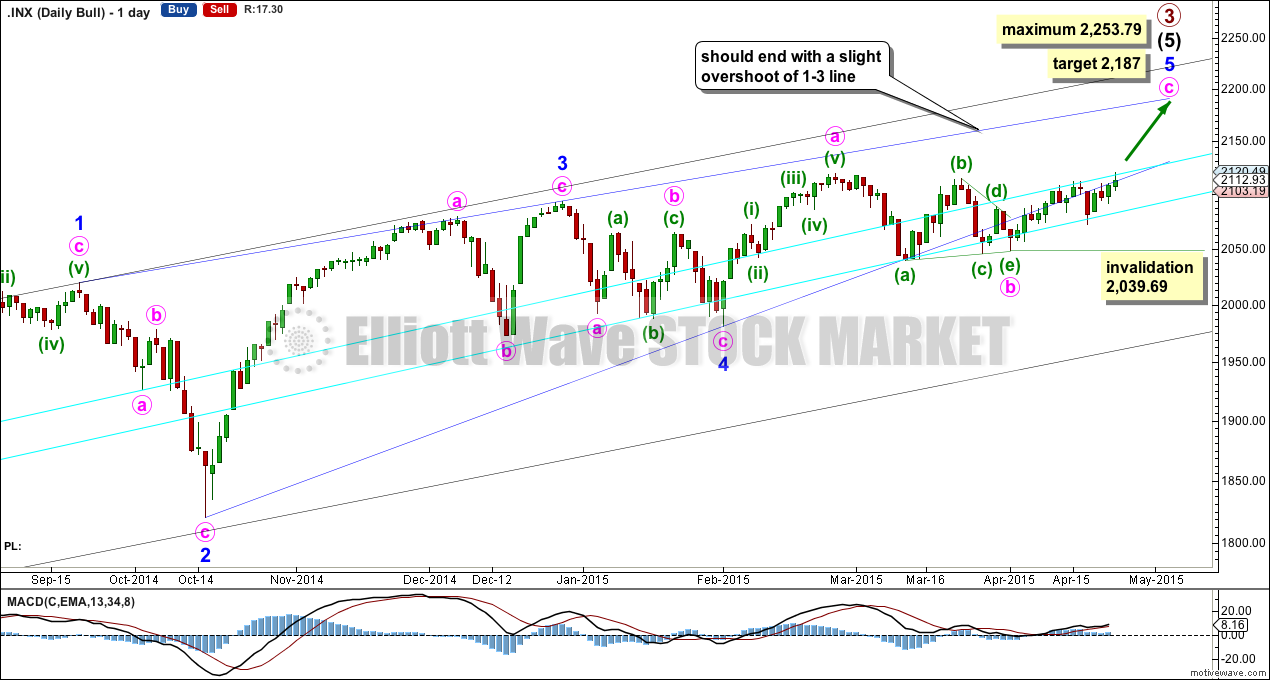
This must now be the main wave count. With a new all time high clearly the bull market remains intact. We never did get confirmation of a bear market, and this is why it is important to wait for confirmation of a big trend change before having confidence in it.
Within intermediate wave (5) the structure may be an ending diagonal. The alternate below looks at the other possibility of an impulse.
Within intermediate wave (5) I cannot see a solution where minor wave 3 ends earlier, because that would see it with weaker momentum than minor waves 1 and 5. While a third wave does not necessarily have to be the strongest wave within an impulse, it should not be the weakest.
An ending diagonal requires all sub waves to subdivide as zigzags and the fourth wave to overlap back into first wave price territory.
The lower 2-4 trend line of the contracting diagonal is now breached by three full daily candlesticks below it and not touching it. Diagonals normally adhere very well to their trend lines and this part of the wave count now looks wrong. Because this wave count looks so wrong I will publish another bullish alternate below.
The breach of the 2-4 trend line is the only problem with this wave count.
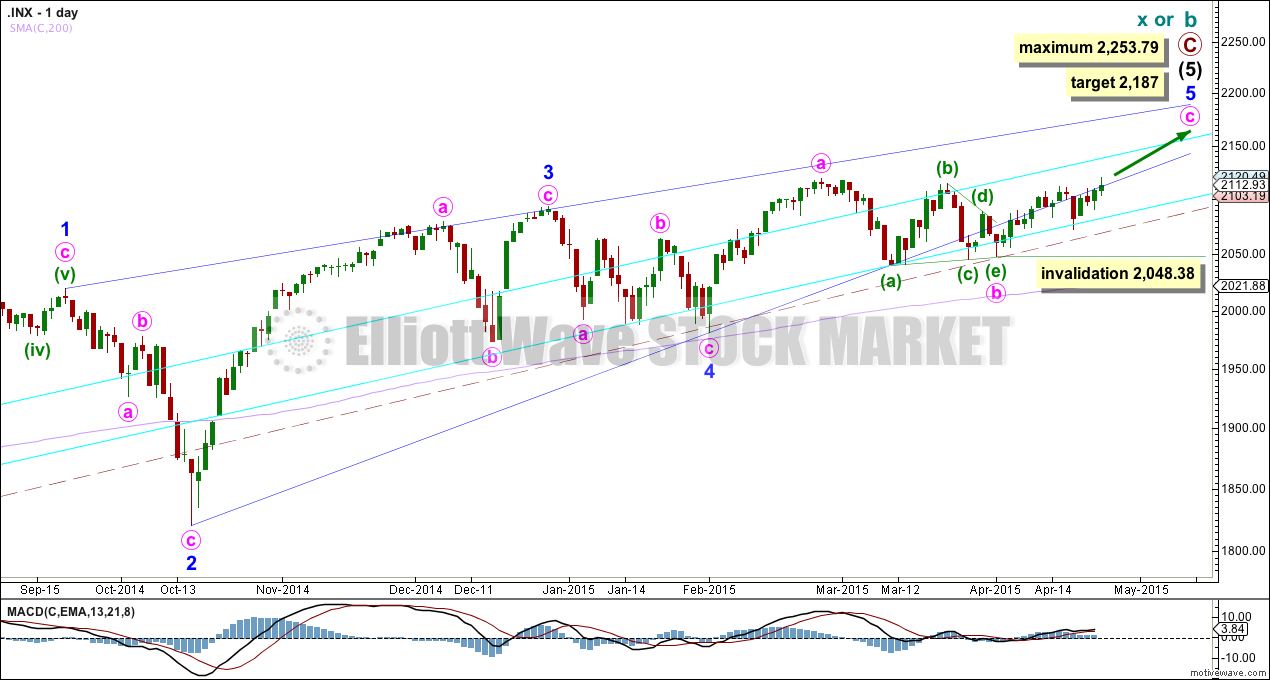
Within the final zigzag of minor wave 5 minute wave c must now have begun. It would reach equality in length with minute wave a at 2,187.
The diagonal is contracting, the third wave is shorter than the first and the fourth wave is shorter than the second. A third wave may never be the shortest wave. This limits the final fifth wave to no longer than equality with the third wave at 2,253.79. A new high above this point would see this main wave count invalid and the bullish alternate below confirmed.
Within minute wave c no second wave correction may move below the start of its first wave at 2,039.69.
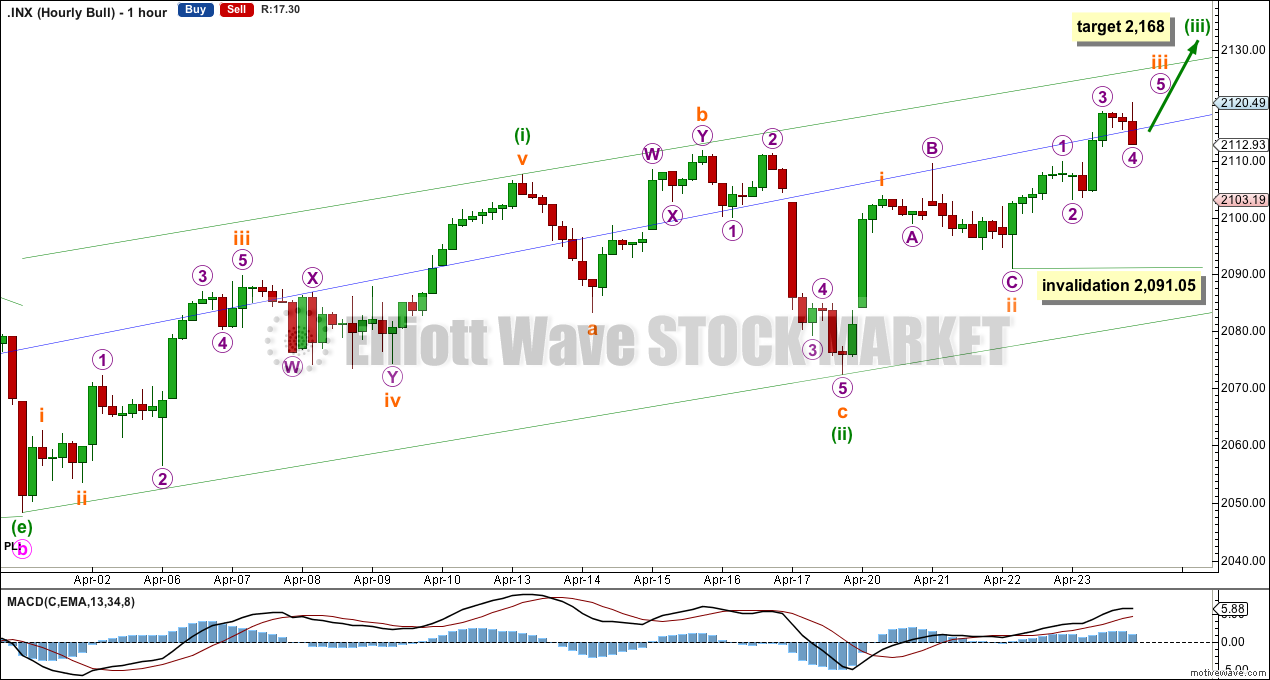
The hourly chart shows all of minute wave c so far.
Minute wave c must subdivide as a five wave structure. So far minuette wave (i) is likely complete and minuette wave (ii) is complete as an expanded flat correction. This sees the downwards wave labelled subminuette wave c a clear five wave impulse.
At 2,168 minuette wave (iii) would reach 1.618 the length of minuette wave (i).
Within the middle of minuette wave (iii) no second wave correction may move beyond its start below 2,091.05.
Draw a base channel about minuette waves (i) and (ii). Minuette wave (iii) should show an increase in upwards momentum, enough to break above resistance at the upper edge of the green channel. Along the way up downwards corrections should find support at the lower edge of the base channel.
Alternate Bullish Wave Count
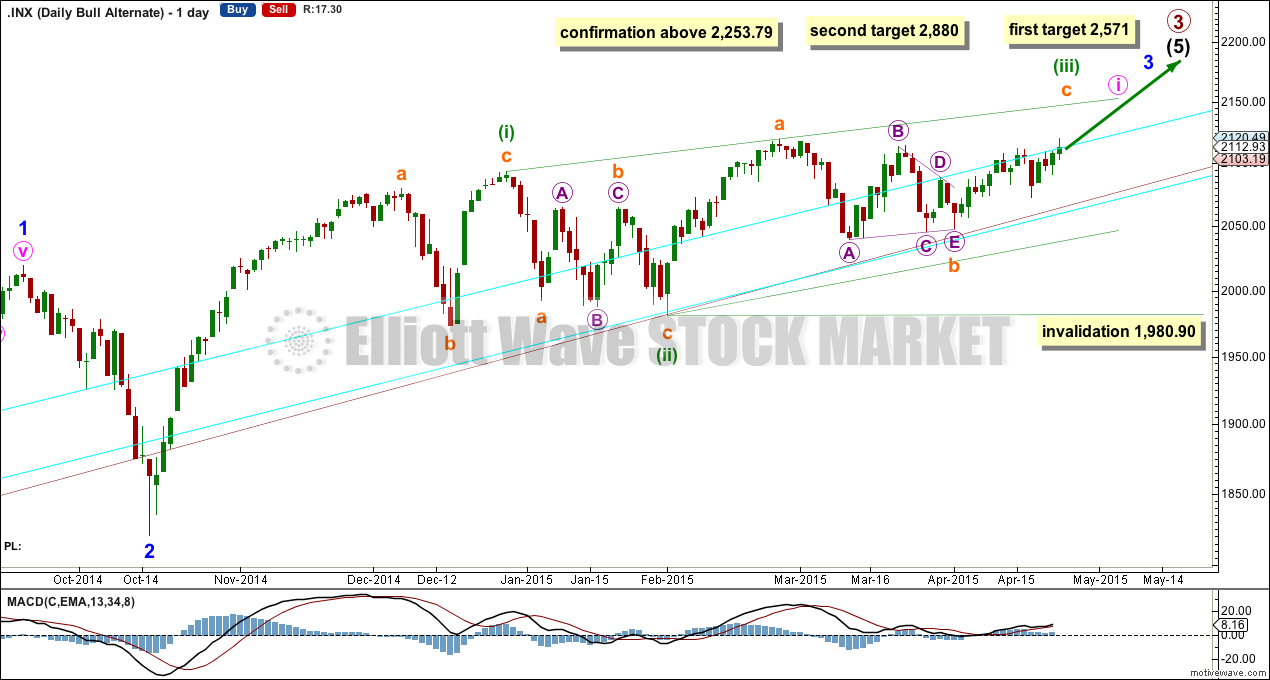
Eventually a new high above 2,253.79 would invalidate the main wave count and confirm this alternate. At that stage at least one more year, and probably longer, of a bull market may be expected.
Again, I have spent time today looking for a bullish alternate which sees minor waves 3 and 4 within intermediate wave (5) complete. The problem is the deep correction seen here and labelled minor wave 2. This cannot be part of minor wave 3 because then minor wave 3 would not subdivide as an impulse.
It is possible to see minor wave 3 complete at the high labelled here minor wave 1, but then it would have weaker momentum than minor waves 1 and 5. I am not prepared to publish a wave count with a third wave in an impulse weaker than its corresponding first and fifth waves.
Through a process of elimination this leaves me with this very bullish wave count. It sees minor wave 3 as so far having stronger momentum than minor wave 1. It sees minor wave 1 as a complete impulse.
With all the overlapping at the beginning of this possible third wave a leading diagonal for minute wave i is a reasonable explanation.
The diagonal of minute wave i would be incomplete. When minuette wave (iii) is over then the following downward correction for minuette wave (iv) must move back into minuette wave (i) price territory below 2,093.55. Minuette wave (iv) may not move below the end of minuette wave (ii) below 1,980.90.
At 2,571 intermediate wave (5) would reach 2.618 the length of intermediate wave (3). Both intermediate waves (3) and (5) would be extended.
If price keeps rising through the first target, or if when it gets there the structure is incomplete, then the second target would be used. At 2,880 primary wave 3 would reach 2.618 the length of primary wave 1.
Bear Wave Count
The subdivisions within primary waves A-B-C are seen in absolutely exactly the same way as primary waves 1-2-3 for the bull wave count. The alternate bull wave count idea also works perfectly for this bear wave count.
To see the difference at the monthly chart level between the bull and bear ideas look at the last historical analysis here.
At cycle degree wave b is over the maximum common length of 138% the length of cycle wave a, at 167% the length of cycle wave a. At 2,393 cycle wave b would be twice the length of cycle wave a and at that point this bear wave count should be discarded.
While we have no confirmation of this wave count we should assume the trend remains the same, upwards. This wave count requires confirmation before I have confidence in it. Full and final confirmation that the market is crashing would only come with a new low below 1,370.58. However, structure and momentum should tell us long before that point which wave count is correct, bull or bear.
This analysis is published about 07:31 p.m. EST.

Speaking of incongruities, look at the way Gold is trading on a down day for the dollar…clearly a function of traders in the futures market manipulating price action…
I think you are definitely right on the money about market manipulation. The central banks are clearly stepping in to buy the market at key levels threatening break-down and have been doing so for years. Some think it does not affect the Elliott Wave form in the end and I am not so sure. At the very least it results in these remarkable extensions which continually seem to defy logic…it will ultimately end badly in my opinion although it makes trading extremely tricky. Keep tight stops and take profits immediately is the best advice I can give…
I keep seeing this claim, I’ve seen it made repeatedly by various people over the years.
Eventually the structure becomes clear. I’ve not seen any movement which cannot fit within the clear rules of Elliott wave for a market with the huge volume of the S&P.
Elliott wave is mostly following rules, but part flair and experience. Although the rules are firm and many, you can still see a market movement more than one way and meet the rules. This is the big problem with Elliott wave.
I don’t think this continued upwards trend is defying logic, I think it’s the sustained optimism we see for a bull market. I think we may see it as defying logic if we have a bear wave count which is constantly invalidated and updated.
Bull markets can just keep going…. and going…. that optimism can be sustained to truly incredible levels for a reasonable period of time. Look at RSI prior to the Dotcom crash of 2000. See how RSI was high, over 70 often, for FIVE years!
I completely agree with your conclusion Verne. Tight stops are essential.
Can you please explain why S&P 2119.59 is considered breached when price action poked above that price only once for less than 2 to 3 minutes?
Anyone trying to manipulate the analysis/market can very easily force a breach for that amount of time.
Thank You, Joe
Elliott wave rules are black and white. A second wave correction may not move at all beyond the start of a first wave, not by any amount at any time frame.
It does not matter that the amount is small and it only happened for a few minutes. The rules are absolutely black and white.
The prior bear wave count must be firmly discarded.
The target for the new main wave count is 2187 which would complete wave 5, (5) & 3 circle.
What is the lowest price below 2187 that a possible truncation of wave 5 / C circle may occur or is that completely out of the question?
It’s not truncated and won’t be because minute wave a high was at 2,119.59. Minute wave c (pink circle) is now above that price point, a truncation is avoided.
Minute wave c only needs to be a five wave structure. Looking at it on the hourly chart it does not look like it is complete yet, it does not have a clear five.
There is something strange about the extremely low volume and momentum for what should be a third wave move to the upside…of course the grind higher has for some time been accompanied by unusually low volume so the market continues to behave quite strangely…on the sidelines for now…looking for new closing highs for SPY and DOW…as well as transports moving above 50 DMA at the very least…
Nothing about this market makes sense
anymore… Not the technicals and certainly NOT the fundamentals! It’s a rigged game… even the charting analysis is being manipulated. See my question above.
You think that’s not happening??? If you believe that, I have a bridge in Brooklyn I’d like to sell you.
It’s a global market. Anyone manipulating it can certainly do so short term. But huge big long term moves? Keeping a bull market intact defying gravity?
What goes up will eventually come down. Human nature is still the same today as it has been for millennia. Even the participants engaging in manipulation are subject to human nature and the psychology of crowds.
Every bull market in history eventually ends. And every time at their highs the players all truly believe it can never end, this time it’s different. Every time.
Before this market is ready to turn we need to see that kind of optimism.
When it’s ready to turn, no amount of manipulation will be able to stop it.
At least, that’s my view. And you’re most welcome to disagree with me. The market will tell us eventually.