
Downwards movement was expected for Monday. A red candlestick fits the main Elliott wave count nicely.
Summary: The S&P remains within a consolidation phase. I still expect the breakout, when it comes, should be downwards. I expect downwards movement to 1,995 has begun this week, but I will not have confidence that the trend has turned downwards until the upwards sloping violet channel on the hourly chart is breached. A new low below 2,074.29 would increase confidence that the trend has changed to down.
Click charts to enlarge.
Bullish Wave Count
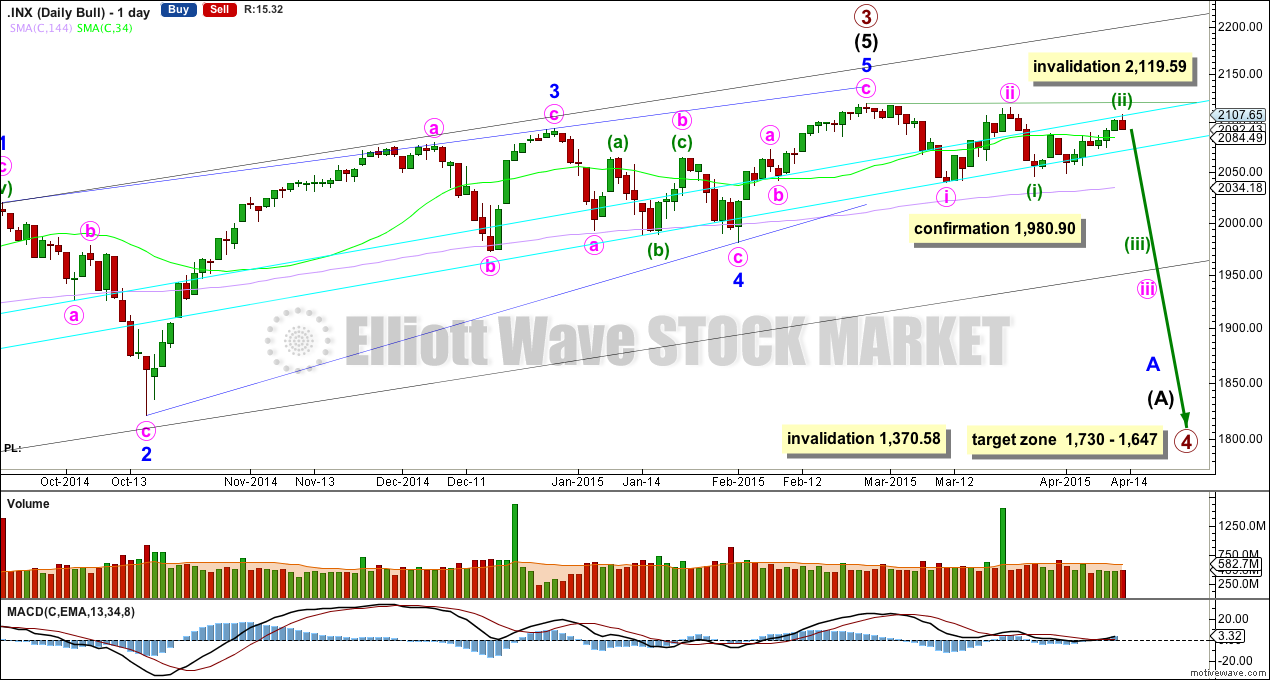
If primary wave 3 is over then primary wave 4 should begin. Upwards movement from the low at 666.79 subdivides now as a complete 5-3-5. For the bull wave count this is seen as primary waves 1-2-3. The wave count sees intermediate wave (5) as an ending contracting diagonal. Ending diagonals require all sub waves to be zigzags.
Primary wave 2 was a relatively shallow 0.41 zigzag lasting 12 weeks. Primary wave 4 may be more shallow and is most likely to be a flat, combination or triangle. It may be longer lasting than primary wave 2 as these types of sideways corrective structures tend to be more time consuming than zigzags. Primary wave 4 is likely to end in the price territory of the fourth wave of one lesser degree between 1,730 – 1,647. It may last about 13 or maybe even 21 weeks, and has started its seventh week.
To see a weekly chart and how to draw the aqua blue trend lines and the black channel, go here. Primary wave 4 should break below the black channel.
Primary wave 4 may not move into primary wave 1 price territory below 1,370.58. Invalidation of this bull wave count would provide full confidence in the bear wave count.
Because primary wave 4 may be an expanded flat, running triangle or double combination it may include a new high beyond its start at 2,119.59. If this happens the bear wave count would be invalidated.
There is triple (quadruple?) divergence with price and MACD at the weekly chart level supporting the idea of a trend change, either already or coming up soon.
A close 3% or more of market value below the double aqua blue trend line would provide trend line confirmation of a sizeable trend change. I will only have confidence in this wave count when there is confirmation of this trend change.
A new low below 1,980.90 would provide further confirmation of a trend change.
To have confidence in this big trend change the shorter 34 day SMA needs to cross below the longer 144 day SMA, and price needs to be below both.
So far within the sideways movement of minuette wave (ii) the strongest volume was on a down day. This indicates that when the breakout comes from this sideways consolidation phase it is more likely to be down than up.
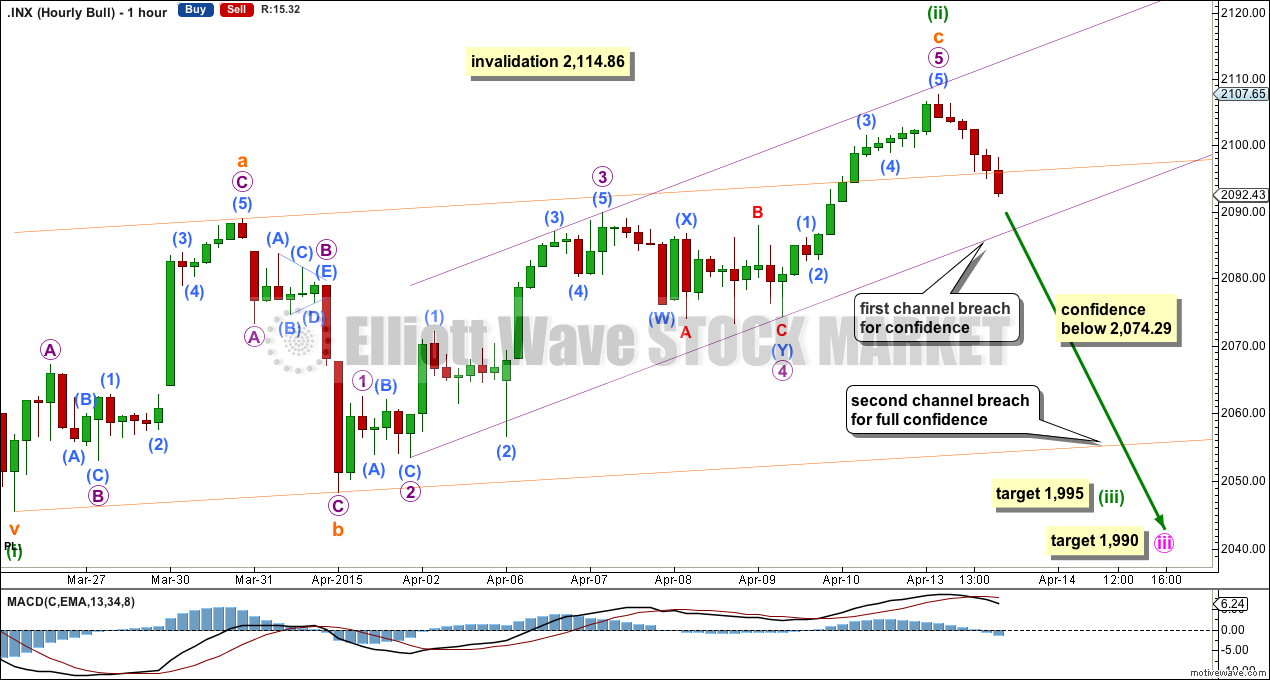
Minuette wave (ii) subdivides as a regular flat correction. The final fifth wave within it began Monday’s session with a little more upwards movement.
There is still not enough downwards movement at the end of Monday’s session to confirm that subminuette wave c is over. I would still wait for a clear breach of the upwards sloping narrow violet channel about subminuette wave c before I have confidence in a trend change.
A new low below 2,074.29 would provide further confidence that a third wave down is underway.
Finally a breach of the wider more gently sloping orange channel about minuette wave (ii) would provide trend channel confirmation that minuette wave (ii) is over and minuette wave (iii) is underway.
At 1,995 minuette wave (iii) would reach 1.618 the length of minuette wave (i). When minuette wave (iii) is complete I would expect another sideways consolidation phase for minuette wave (iv).
Minuette wave (i) lasted three days, and minuette wave (ii) now has lasted eleven days. Minuette wave (iii) may last a Fibonacci eight or thirteen days, depending on how time consuming the corrections within it are.
At 1,990 minute wave iii would reach 1.618 the length of minute wave i. When minuette waves (iii) and (iv) are complete within this impulse of minute wave iii then I will add to the target calculation at a second wave degree, so this target may widen to a small zone or it may change.
Alternate Bullish Wave Count
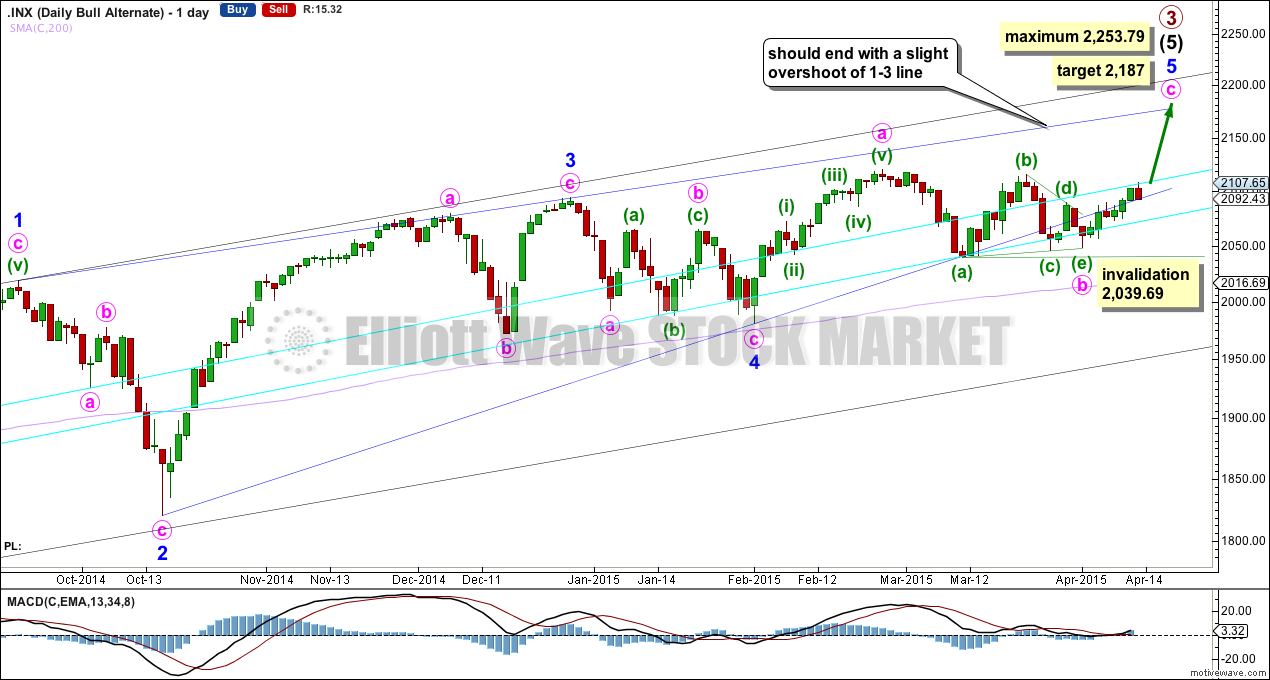
This alternate wave count is identical to the main wave count up to the low labelled minor wave 4. Thereafter, it sees minor wave 5 incomplete.
The lower 2-4 trend line of the contracting diagonal is now breached by three full daily candlesticks below it and not touching it. Diagonals normally adhere very well to their trend lines and this part of the wave count now looks wrong.
This wave count is still technically possible but it has a very low probability. The breach of the 2-4 trend line is the only reason why this wave count is an alternate.
Within the triangle of minute wave b, if minuette wave (c) continues further it may not move beyond the end of minuette wave (a) below 2,039.69. If we see a new low below this point this week I will discard this alternate wave count.
It is at this stage that this alternate wave count diverges from the main wave count. A new high above 2,114.86 would increase the probability of this alternate, and if it is correct we may see that this week.
Bear Wave Count
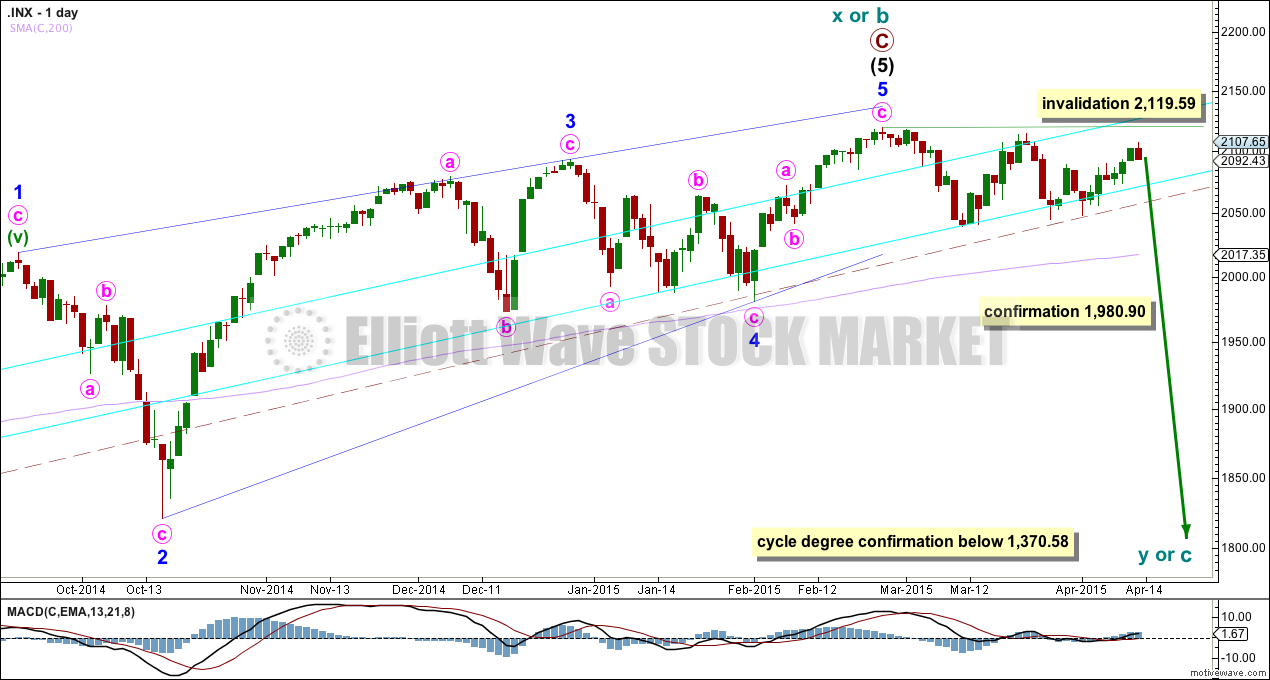
The subdivisions within primary waves A-B-C are seen in absolutely exactly the same way as primary waves 1-2-3 for the bull wave count. The alternate bull wave count idea also works perfectly for this bear wave count.
To see the difference at the monthly chart level between the bull and bear ideas look at the last historical analysis here.
At cycle degree wave b is over the maximum common length of 138% the length of cycle wave a, at 167% the length of cycle wave a. At 2,393 cycle wave b would be twice the length of cycle wave a and at that point this bear wave count should be discarded.
While we have no confirmation of this wave count we should assume the trend remains the same, upwards. This wave count requires confirmation before I have confidence in it. Full and final confirmation that the market is crashing would only come with a new low below 1,370.58. However, structure and momentum should tell us long before that point which wave count is correct, bull or bear.
This analysis is published about 09:23 p.m. EST.
Both VXX and UVXY making a series of new 52 week lows, including today, and market not at new highs. Both also bouncing off lower BB. If there was ever a point for a major turn it is now- complacency is at historic extremes…I would not be surprised to see three down blow past targets…