
Downwards movement was expected for the main Elliott wave count for Thursday. This is not what happened, but upwards movement remains below the invalidation point.
Summary: The main wave count requires downwards movement when markets open to complete a five down on the hourly chart. If price breaks above 2,073.31 then it is possible that minuette wave (ii) is moving sideways as a double combination, as shown in the alternate hourly chart. I would judge the two hourly charts to have a close to even probability after Thursday’s session.
Click charts to enlarge.
Bullish Wave Count
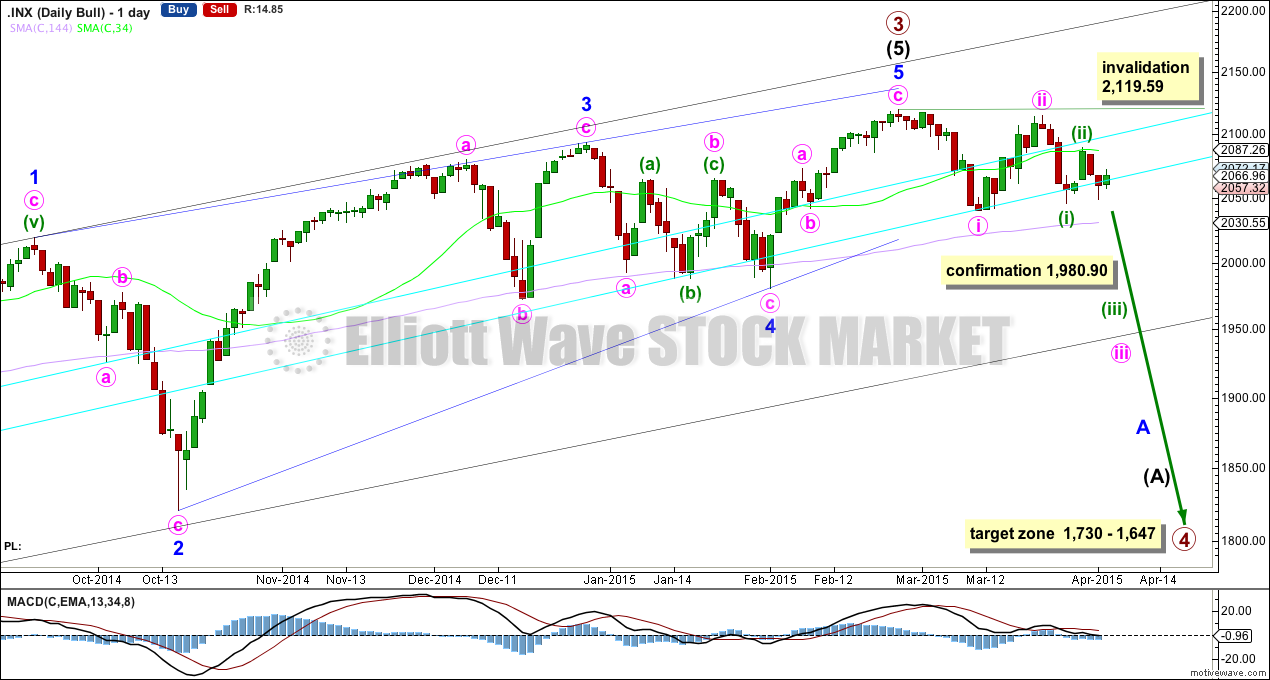
If primary wave 3 is over then primary wave 4 should begin. Upwards movement from the low at 666.79 subdivides now as a complete 5-3-5. For the bull wave count this is seen as primary waves 1-2-3. The wave count sees intermediate wave (5) as an ending contracting diagonal. Ending diagonals require all sub waves to be zigzags.
Primary wave 2 was a relatively shallow 0.41 zigzag lasting 12 weeks. Primary wave 4 may be more shallow and is most likely to be a flat, combination or triangle. It may be longer lasting than primary wave 2 as these types of sideways corrective structures tend to be more time consuming than zigzags. Primary wave 4 is likely to end in the price territory of the fourth wave of one lesser degree between 1,730 – 1,647. It may last about 13 or maybe even 21 weeks. So far it is in its fifth week.
To see a weekly chart and how to draw the aqua blue trend lines and the black channel, go here. Primary wave 4 should break below the black channel.
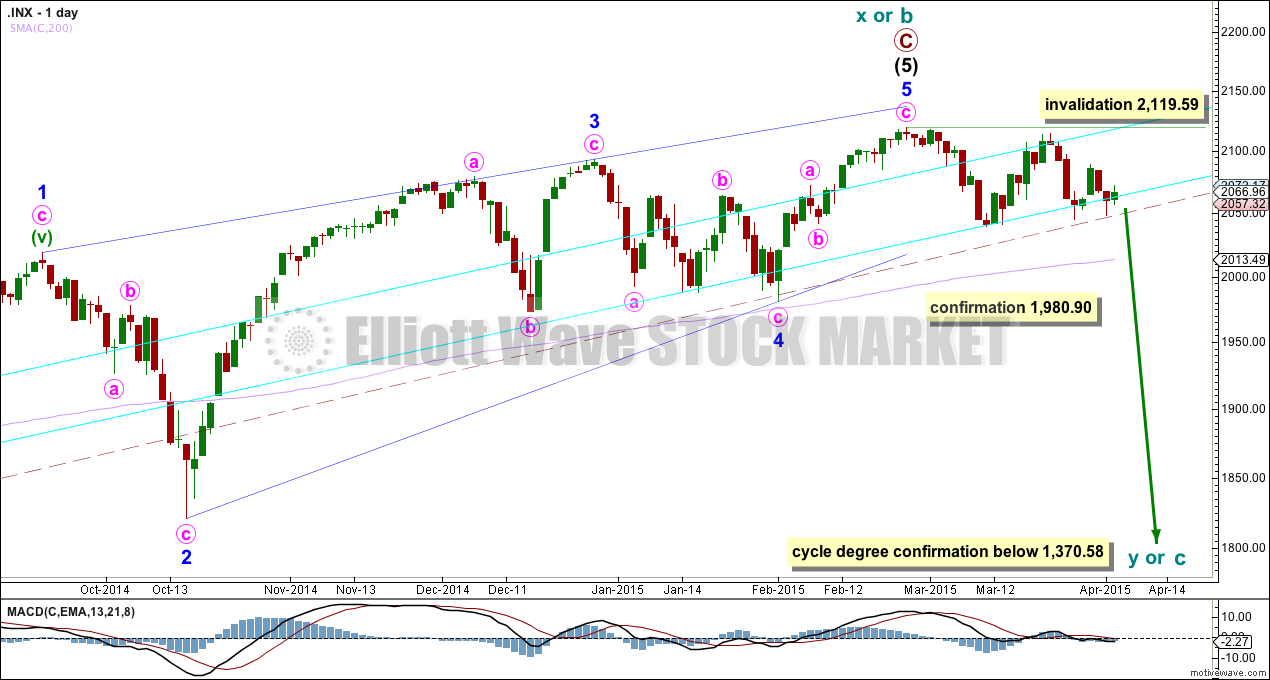
Primary wave 4 may not move into primary wave 1 price territory below 1,370.58. Invalidation of this bull wave count would provide full confidence in the bear wave count.
Because primary wave 4 may be an expanded flat, running triangle or double combination it may include a new high beyond its start at 2,119.59. If this happens the bear wave count would be invalidated.
There is triple (quadruple?) divergence with price and MACD at the weekly chart level supporting the idea of a trend change, either already or coming up soon.
A close at 2,001 or below would provide a close 3% of market value below the double aqua blue trend line, providing trend line confirmation of a sizeable trend change. I will only have confidence in this wave count when there is confirmation of this trend change.
A new low below 1,980.90 would provide further confirmation of a trend change.
Price is now below the 34 day SMA (which is about where price just found resistance) but remains above the 144 day SMA (I am playing with different time frames for moving averages and using Fibonacci numbers). A close below the longer 144 day SMA would add confidence in this trend change. A cross of the two moving averages with the 34 below the 144 day would also add confidence to this trend change. While we have neither this trend change remains unconfirmed.
Main Hourly Wave Count
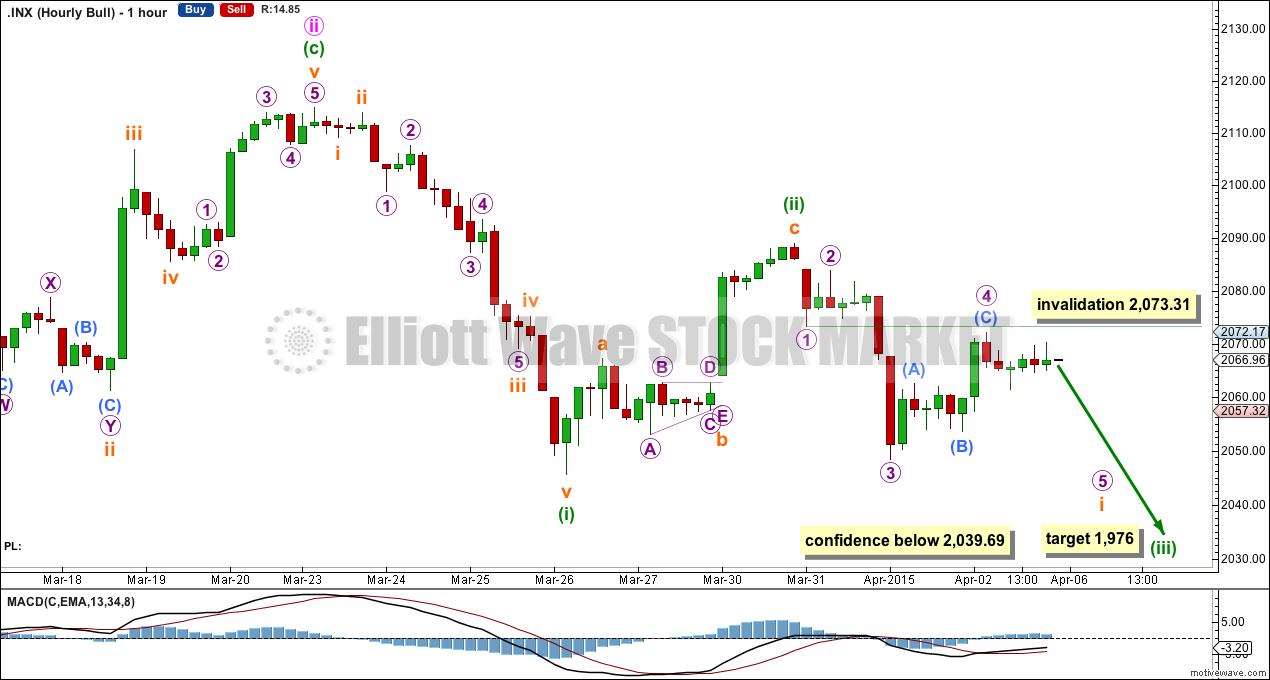
Minuette wave (ii) may be over as a deep 0.63 zigzag lasting two days. At 1,976 minuette wave (iii) would reach 1.618 the length of minuette wave (i).
Minuette wave (iii) may only subdivide as an impulse and it should show an increase in downwards momentum beyond that seen for minuette wave (i).
Within the first wave down, subminuette wave i, micro wave 4 may not move into micro wave 1 price territory above 2,073.31. If this price point is breached I would use the alternate hourly wave count below. Micro wave 4 now is out of proportion to micro wave 1, and shows no alternation with micro wave 2. Both are zigzags. Micro wave 2 is 0.66 of micro wave 1 and micro wave 4 is 0.67 of micro wave 3. This reduces the probability of this main wave count to about even with the alternate below.
Micro wave 3 looks like a three wave structure on the hourly chart, and on the five minute chart it does not subdivide easily as an impulse. I want to see a triangle in micro wave 2 position because that’s what it looks like on the five minute chart, but a second wave may not have a triangle as the sole corrective structure.
Alternate Hourly Wave Count
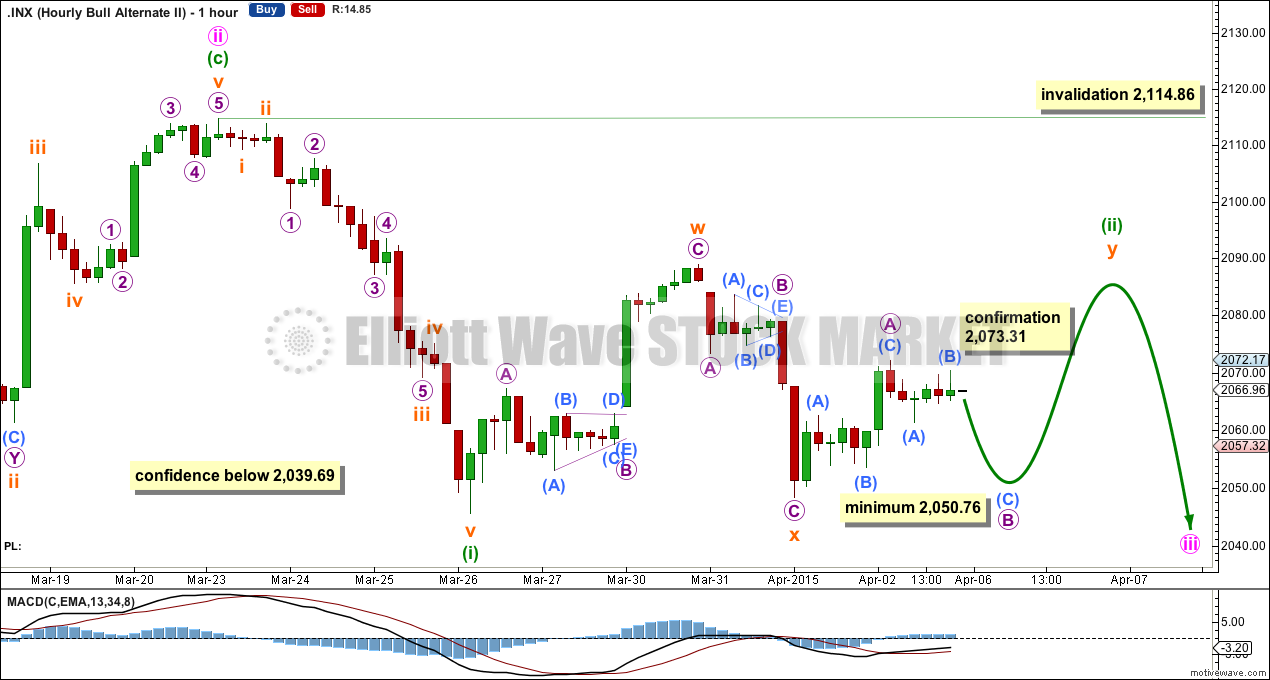
It is almost equally as likely now that minuette wave (ii) is not over and may continue sideways for another one or two days to complete a double combination.
The downwards movement labelled subminuette wave x fits perfectly as a three wave zigzag, with micro wave B a perfect regular contracting triangle. This resolves the problem on the main hourly wave count because a triangle may be a B wave but not a second wave.
The purpose of combinations is to take up time and move price sideways. The second structure of subminuette wave y would most likely end about the same level as subminuette wave w at 2,088.97 to achieve this purpose. Subminuette wave y may be a flat or a triangle.
If subminuette wave y is a flat correction (which is more likely) then within it micro wave B must retrace a minimum 90% length of micro wave A at 2,050.76. Thereafter, micro wave C should unfold as a five wave structure upwards to very likely make a new high above micro wave A at 2,072,17 to avoid a truncation.
If subminuette wave y is a triangle there is no minimum requirement for micro wave B. A triangle would expect choppy overlapping sideways movement for another couple of days at least.
Minuette wave (ii) may not move beyond the start of minuette wave (i) above 2,114.86.
If this wave count is correct then a target for minuette wave (ii) cannot be calculated until minuette wave (ii) is over.
Alternate Bullish Wave Count
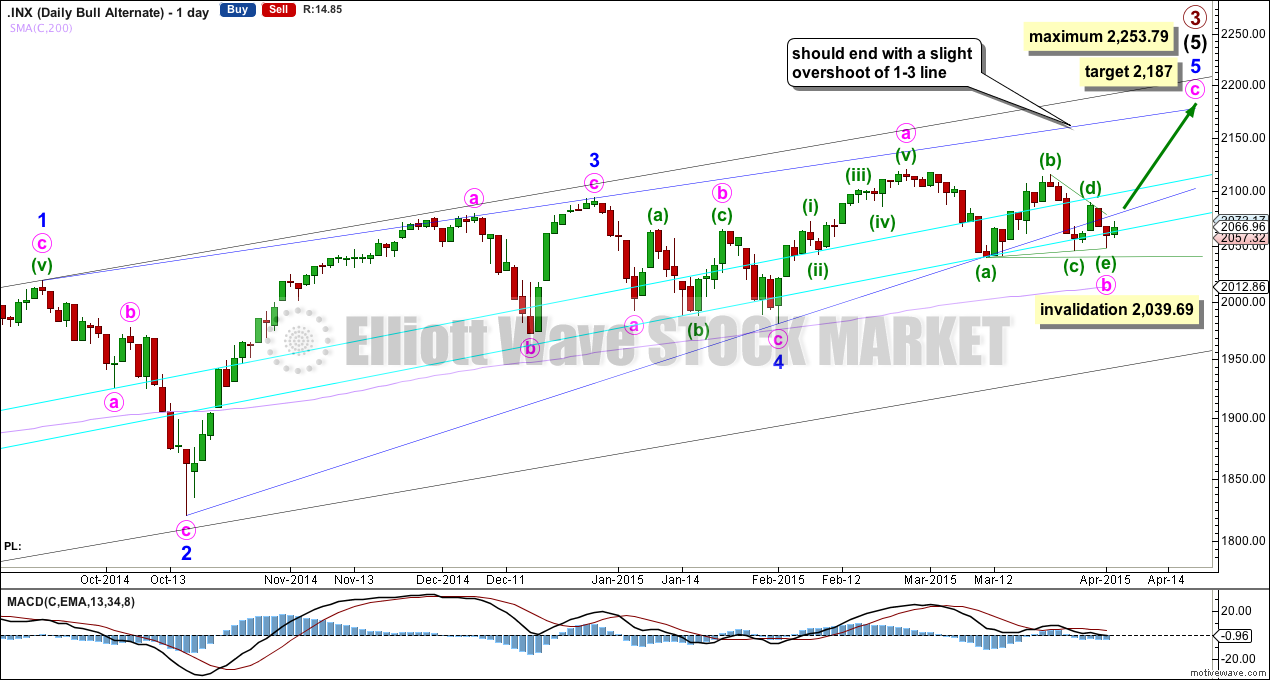
This alternate wave count is identical to the main wave count up to the low labelled minor wave 4. Thereafter, it sees minor wave 5 incomplete.
The lower 2-4 trend line of the contracting diagonal is now breached by three full daily candlesticks below it and not touching it. Diagonals normally adhere very well to their trend lines and this wave count now looks wrong.
This wave count is still technically possible but it has a very low probability. The breach of the 2-4 trend line is the only reason why this wave count is an alternate.
Within the triangle of minute wave b, if minuette wave (c) continues further it may not move beyond the end of minuette wave (a) below 2,039.69.
The probability of this alternate wave count is now so low it do not want to publish an hourly chart for it, that would give it undue weight.
Bear Wave Count
The subdivisions within primary waves A-B-C are seen in absolutely exactly the same way as primary waves 1-2-3 for the bull wave count. The alternate bull wave count idea also works perfectly for this bear wave count.
To see the difference at the monthly chart level between the bull and bear ideas look at the last historical analysis here.
At cycle degree wave b is over the maximum common length of 138% the length of cycle wave a, at 167% the length of cycle wave a. At 2,393 cycle wave b would be twice the length of cycle wave a and at that point this bear wave count should be discarded.
While we have no confirmation of this wave count we should assume the trend remains the same, upwards. This wave count requires confirmation before I have confidence in it. Full and final confirmation that the market is crashing would only come with a new low below 1,370.58. However, structure and momentum should tell us long before that point which wave count is correct, bull or bear.
This analysis is published about 09:09 p.m. EST.
If it is a double combination, and this seemed to be confirmed by upward movement today, I would have expected it to move a bit higher before retreating as it did a the end of trading today-maybe a bit more upward movement tomorrow? Huge divergence between the major indices and the transports continue. The transports could not even manage a move up to “kiss” the underside of the 200 day ma. I think we are heading lower very soon either way…
Agreed re: transports. They are very weak right now. But i haven’t followed the relationship so much on a short term basis to have a good feel re: the significance. It can’t hurt my short position though.
I don’t think minuette wave 2 is a flat, because if anything it looks like it would be a rare running flat with an expanding diagonal for the last movement. I’m doing it all by eye so i don’t even know if the diagonal is valid. I doubt this is what minuette wave 2 is.
If it is a double combination, could it be over yet? The ending price level would be right for it, and the fact that it happened all today is good for my concern that wave 2 was going to be very large in relation to 1. I just don’t know what that last movement was. The y wave doesn’t look like a flat or a triangle to me. Perhaps wave 2 is not over yet
This morning’s trading does not look to me like an intermediate bottom and it is certainly no third wave…looks like the alternate hourly count is right…
May the alternate now simply a regular flat correction for minuette 2? Or is it a double combination of some sort? I can’t figure out this last movement which would be subminuette wave y