
Upwards movement was expected, and a small green candlestick is completing for Thursday’s session. Price is finding support at the lower edge of the channel on the hourly chart.
Summary: I expect another thirteen days in total (give or take one or two either side of this number) to a target of 2,140 or 2,173. At this stage I favour the second higher target. Upwards movement may end when the upper blue trend line on the daily chart is slightly overshot. I will not publish the alternate bullish wave count, because at this stage it adds nothing to the analysis and has too many problems.
Click charts to enlarge.
Bullish Wave Count
Upwards movement from the low at 666.79 subdivides as an incomplete 5-3-5. For the bull wave count this is seen as primary waves 1-2-3.
The aqua blue trend lines are traditional technical analysis trend lines. These lines are long held (the lower one has its first anchor in November, 2011), repeatedly tested, and shallow enough to be highly technically significant. When the lower of these double trend lines is breached by a close of 3% or more of market value that should indicate a trend change. It does not indicate what degree the trend change should be though. It looks like the last five corrections may have ended about the lower aqua blue trend line, which gives the wave count a typical look. To see a weekly chart where I have drawn these trend lines go here.
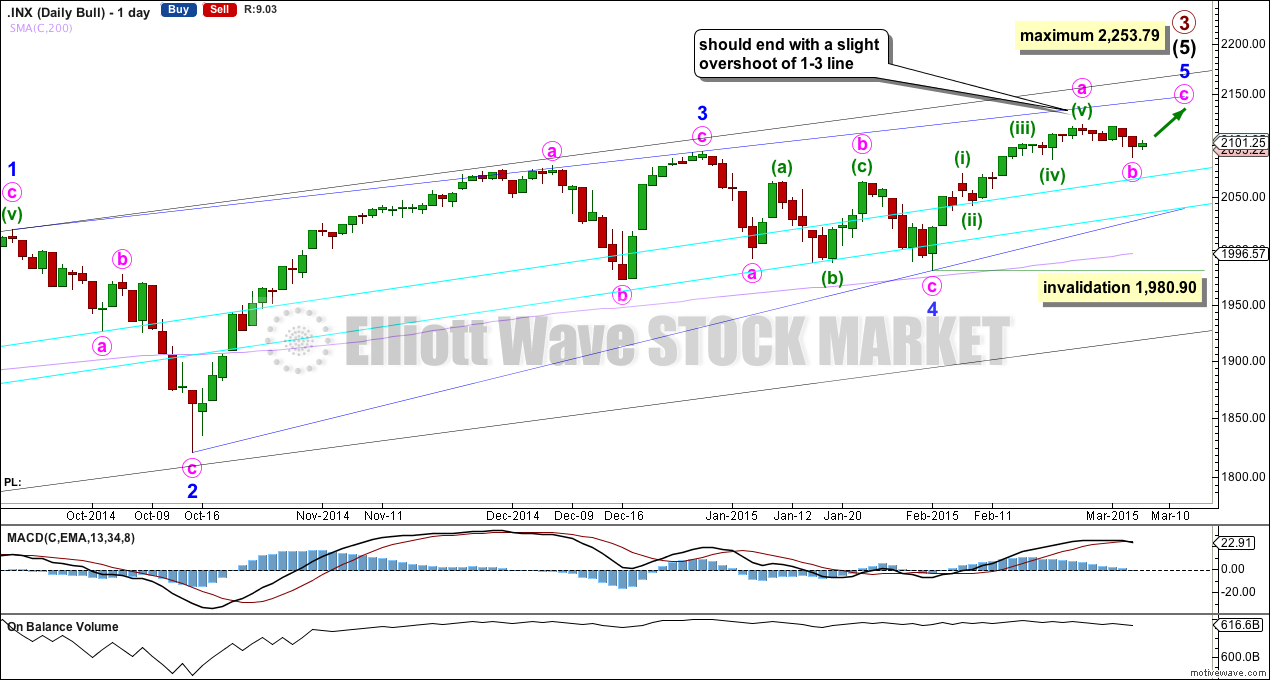
The wave count looks at intermediate wave (5) as an ending contracting diagonal. Ending diagonals require all sub waves to be zigzags. So far this is a perfect fit. Minor wave 3 has stronger momentum than minor wave 5 on the daily chart.
The diagonal is contracting. The only problem with this possibility is that minor waves 2 and 4 are more shallow than second and fourth waves within diagonals normally are. In this case they may have been forced to be more shallow by support offered from the double aqua blue trend lines.
Because the third wave within the contracting diagonal is shorter than the first wave and a third wave may never be the shortest wave, this limits the final fifth wave to no longer than equality with the third wave at 2,253.79.
Within intermediate wave (5) minor wave 1 lasted 238 days (5 days longer than a Fibonacci 233), minor wave 2 lasted 18 days (2 short of a Fibonacci 21), minor wave 3 lasted 51 days (4 short of a Fibonacci 55) and minor wave 4 lasted 23 days (2 longer than a Fibonacci 21). While none of these durations are perfect Fibonacci numbers, they are all reasonably close. So far minor wave 5 has lasted 21 days and the structure looks incomplete. It may now end close to a total Fibonacci 34 sessions, so may continue for a further 13 sessions give or take one to two days either side of this expectation.
Within minor wave 5 minute wave b may not move beyond the start of minute wave a below 1,980.90.
Contracting diagonals normally have fifth waves which end with a slight overshoot of the 1-3 trend line. Because this is such a common tendency I will still expect more upwards movement to see this trend line overshot. It is possible that the fifth wave is over already, but this would look less common.
Minute wave b may be finding support at the upper aqua blue trend line. There no longer divergence with On Balance Volume (OBV). The end of minute wave b saw a new low for OBV.
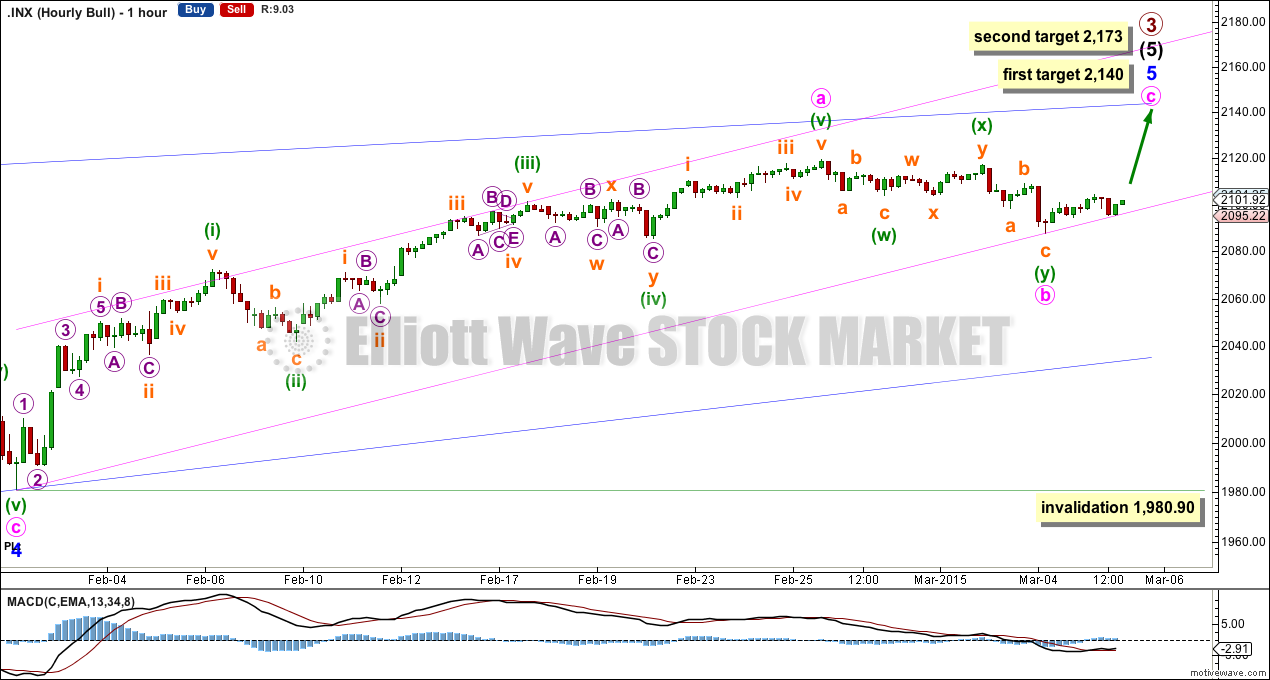
Only the final C wave up is now required to complete the structure of minor wave 5. At 2,140 minute wave c would reach 0.382 the length of minute wave a. This target may not be high enough to see minor wave 5 overshoot the 1-3 trend line, so I favour the higher target. At 2,173 minute wave c would reach 0.618 the length of minute wave a.
It is more likely today that minute wave b is over, but it remains possible that it could continue sideways. If the degree of labelling within it is moved all down one degree the double zigzag may be a three wave structure for minuette wave (a) within an incomplete flat correction of minute wave b. Because this possibility remains I will leave the invalidation point at 1,980.90.
Draw a parallel channel about minor wave 5: draw the first trend line from the start of minute wave a to the end of minute wave b then push a parallel copy up to contain all or almost all of minute wave a. The lower edge of the channel is nicely showing today where price is finding support indicating the lower trend line is correctly drawn. I would expect minute wave c to end about the middle of this channel.
Minute wave b may not move beyond the start of minute wave a below 1,980.90.
Bear Wave Count
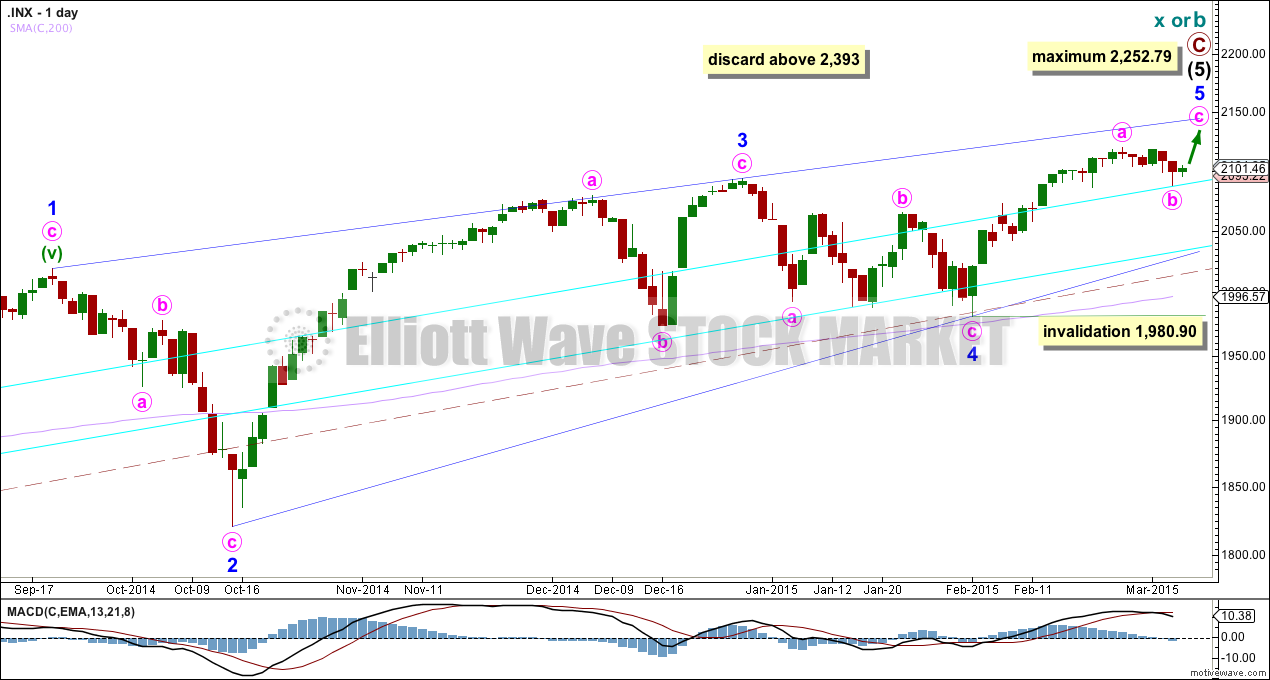
The subdivisions within primary waves A-B-C are seen in absolutely exactly the same way as primary waves 1-2-3 for the bull wave count. The alternate bull wave count idea also works perfectly for this bear wave count.
To see the difference at the monthly chart level between the bull and bear ideas look at the last historical analysis here.
At cycle degree wave b is over the maximum common length of 138% the length of cycle wave a, at 167% the length of cycle wave a. At 2,393 cycle wave b would be twice the length of cycle wave a and at that point this bear wave count should be discarded.
While we have no confirmation of this wave count we should assume the trend remains the same, upwards. This wave count requires confirmation before I have confidence in it.
This analysis is published about 03:36 p.m. EST.
Hi Lara.
With the recent drop to a low of 2067.27, it appears that one of these may be correct:
(a) Minute B in both the Bull and Bear wave counts has not ended; or
(b) Intermediate 5, and hence Primary 3, has ended at 2119.59. The current drop will then be the Primary 4 pullback.
Alternative (a) would be correct if a rebound happens next week, and takes out 2119.59.
Alternative (b) would be correct if the pullback takes out 1980.90.
Awaiting your Friday report for more insights. Thank you.
Thanks Tham. That’s pretty much what I’ll have; a main wave count which sees minor wave 5 incomplete, and an alternate which looks at the possibility it’s over already.
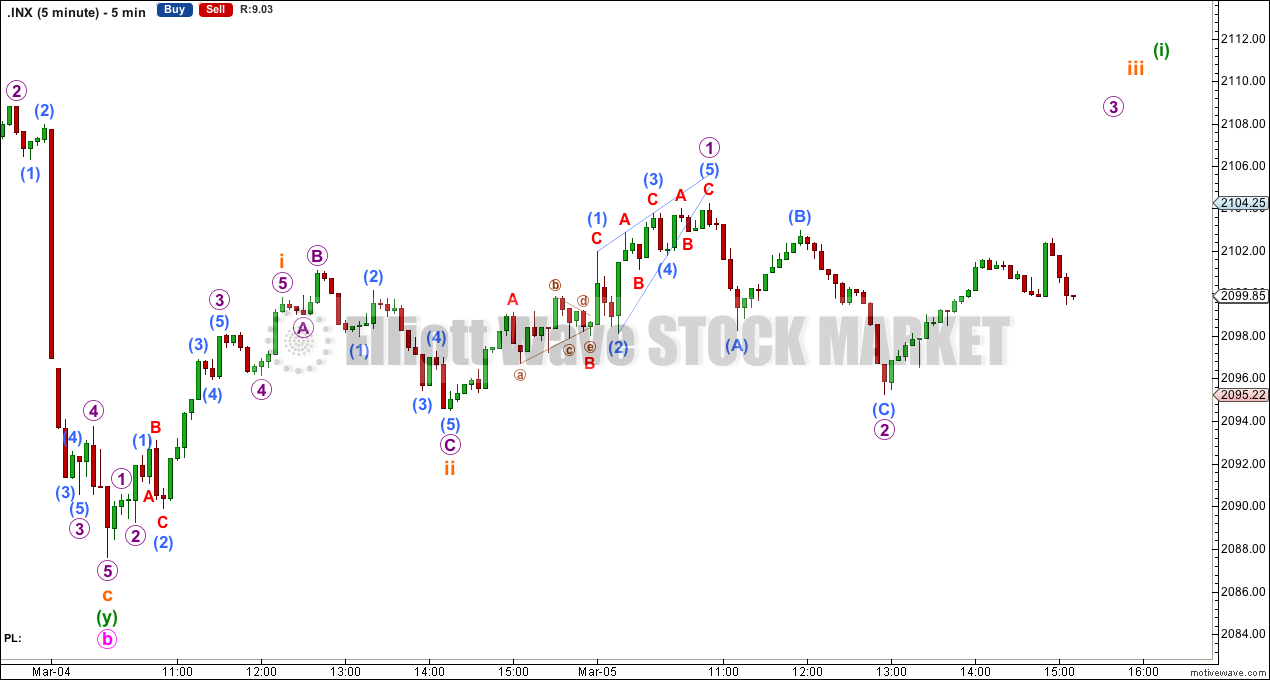
I’m working on the structure of minute wave b. I have it as a triple zigzag which is very rare, but that’s how it subdivides.
I agree with you. The same structure down from 2119.59 (possibly 2119.59 – 2087.70 – 2104.40 – ?) may be seen as either a triple zigzag for Minute B or as an impulse down for Primary 4. Probably they can be differentiated by breaching the invalidation points, 2119.59 for the incomplete b, and 1980.90 for Primary 4.
Unfortunately, the best chart I have is from Investing.com which doesn’t give 1-minute figures within the timeframe from 2119.59. However, I can vaguely make out, by piecing together several charts of different timeframes, that the triple zigzag is correct as the subwaves within W-X-Y subdivide (5-3-5-3-5). W-X-Y cannot be a double zigzag because the subwaves do not fit.