
Downwards movement was expected for Monday.
Summary: The upwards trend should resume tomorrow. The short term target is either 2,098 (main wave count) or 2,133 (alternate wave count).
Click on charts to enlarge.
Main Bull Wave Count
I will favor neither the bull or bear wave count. Both are viable and both expect this current upwards impulse may again be close to complete.
To see a weekly chart with subdivisions and how to draw trend lines and channels click here.
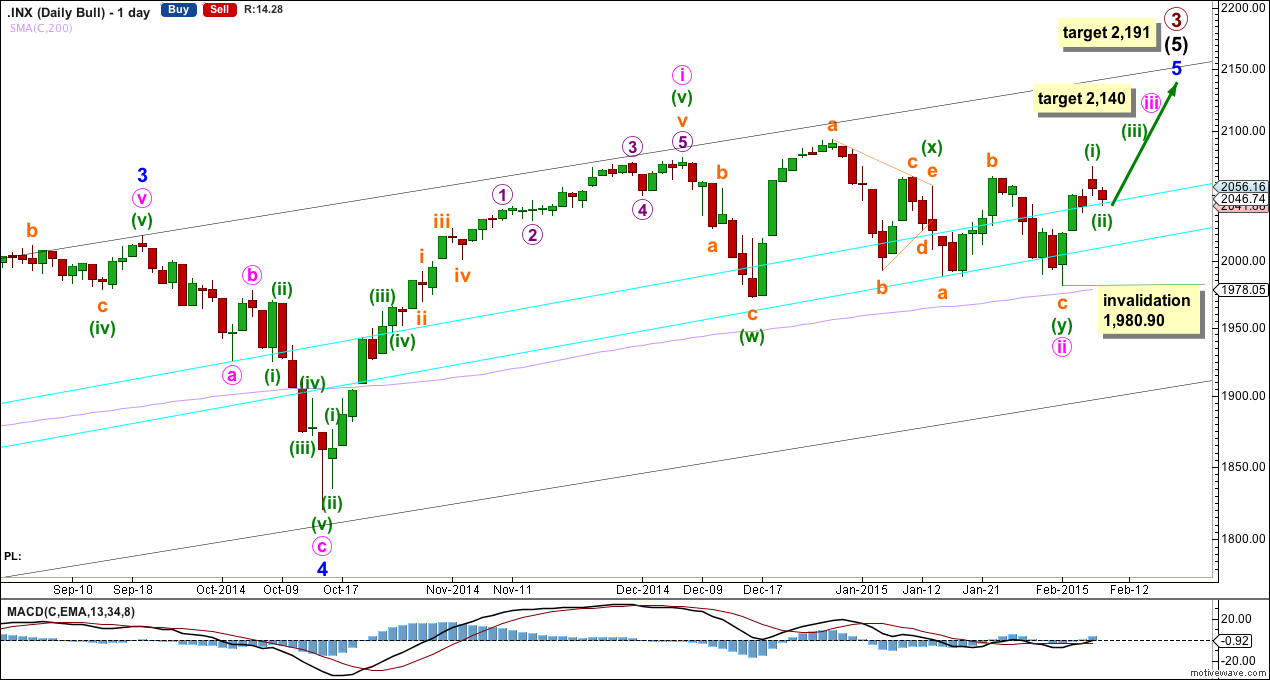
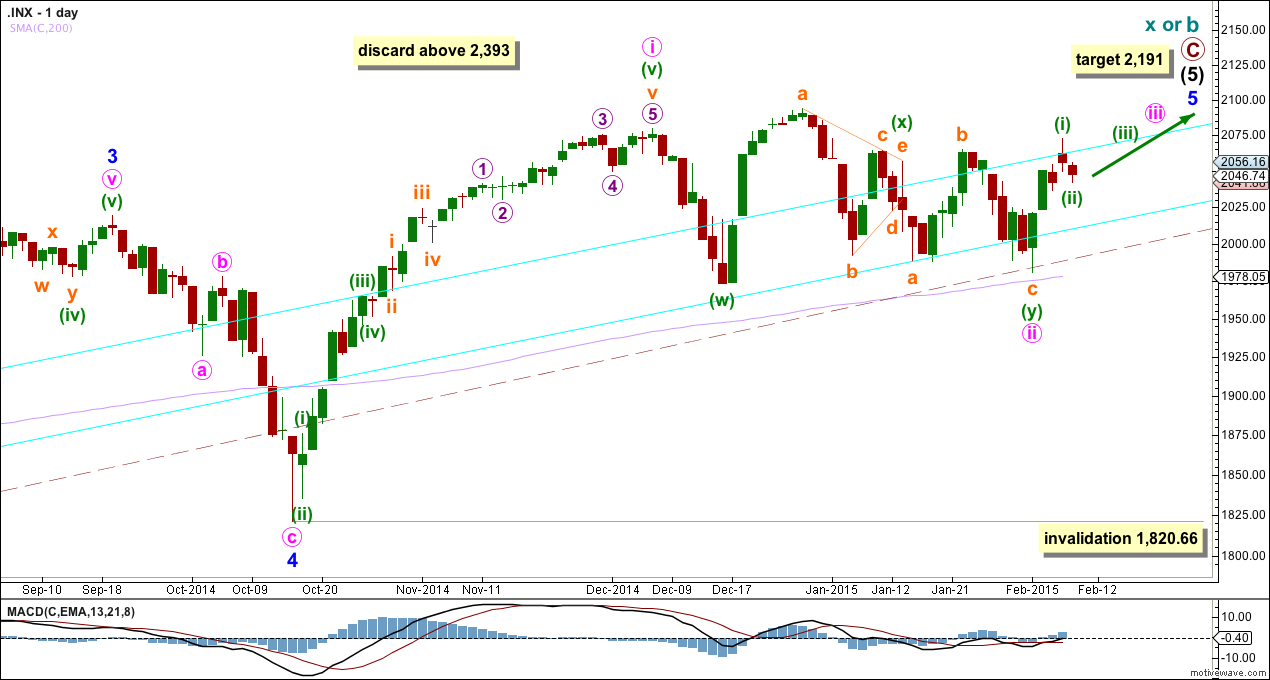
Upwards movement from the low at 666.79 subdivides as an incomplete 5-3-5. For the bull wave count this is seen as primary waves 1-2-3.
The aqua blue trend lines are traditional technical analysis trend lines. These lines are long held (the lower one has its first anchor in November, 2011), repeatedly tested, and shallow enough to be highly technically significant. When the lower of these double trend lines is breached by a close of 3% or more of market value that should indicate a trend change. It does not indicate what degree the trend change should be though. It looks like the last four corrections may have ended about the lower aqua blue trend line, which gives the wave count a typical look.
I have pulled the upper trend line down a little to touch the low of minute wave a within minor wave 4. This may be a better position for recent movement.
There is still triple technical divergence between MACD and price at the weekly chart level.
At 2,191 primary wave 3 would reach 1.618 the length of primary wave 1. This would expect that within minor wave 5 minute wave iii will be shorter than minute wave i, and minute wave v will be shorter still, which would be a repeat of the pattern seen within minor wave 1. Or the target is wrong.
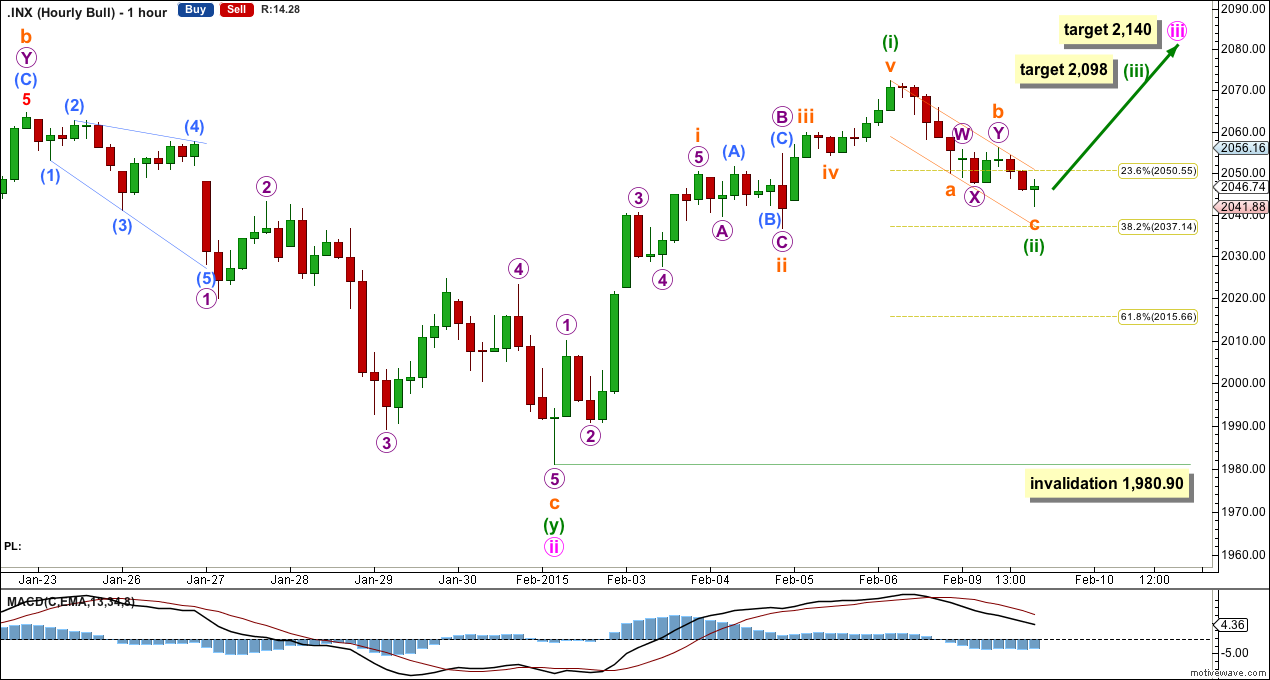
At 2,140 minute wave iii would reach 0.618 the length of minute wave i.
Looking at momentum within intermediate wave (5) it is concerning that minor wave 3 exhibits weakest momentum at the daily chart level, although at the weekly chart level it does have strongest momentum. It is for this reason I am seriously considering the alternate bullish wave count.
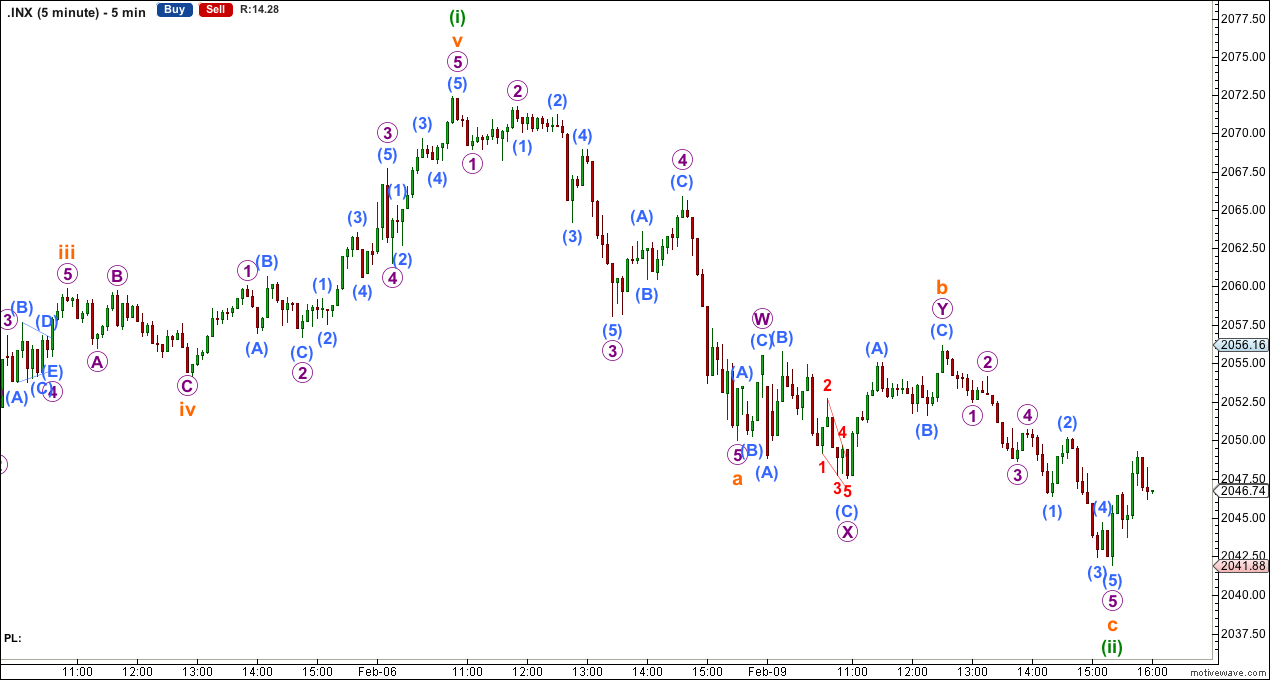
It is impossible to tell if minuette wave (ii) is over or not, but with three red candlesticks now for this correction showing on the daily chart it is very likely to be over despite it being shallow.
If minuette wave (ii) is over and minuette wave (iii) begins tomorrow then at 2,098 minuette wave (iii) would reach 1.618 the length of minuette wave (i). This is the ratio I am using for this target because it fits with higher targets.
Draw a small channel about minuette wave (ii). A breach of this channel would be earliest indication that this correction may be over.
However, the degree of labelling within minuette wave (ii) may be moved down one degree: this may be only subminuette wave a of a flat correction or subminuette wave w of a double zigzag or double combination. It could yet move sideways and lower before coming to an end.
Minuette wave (ii) may not move beyond the start of minuette wave (i) below 1,980.90.
Alternate Bull Wave Count
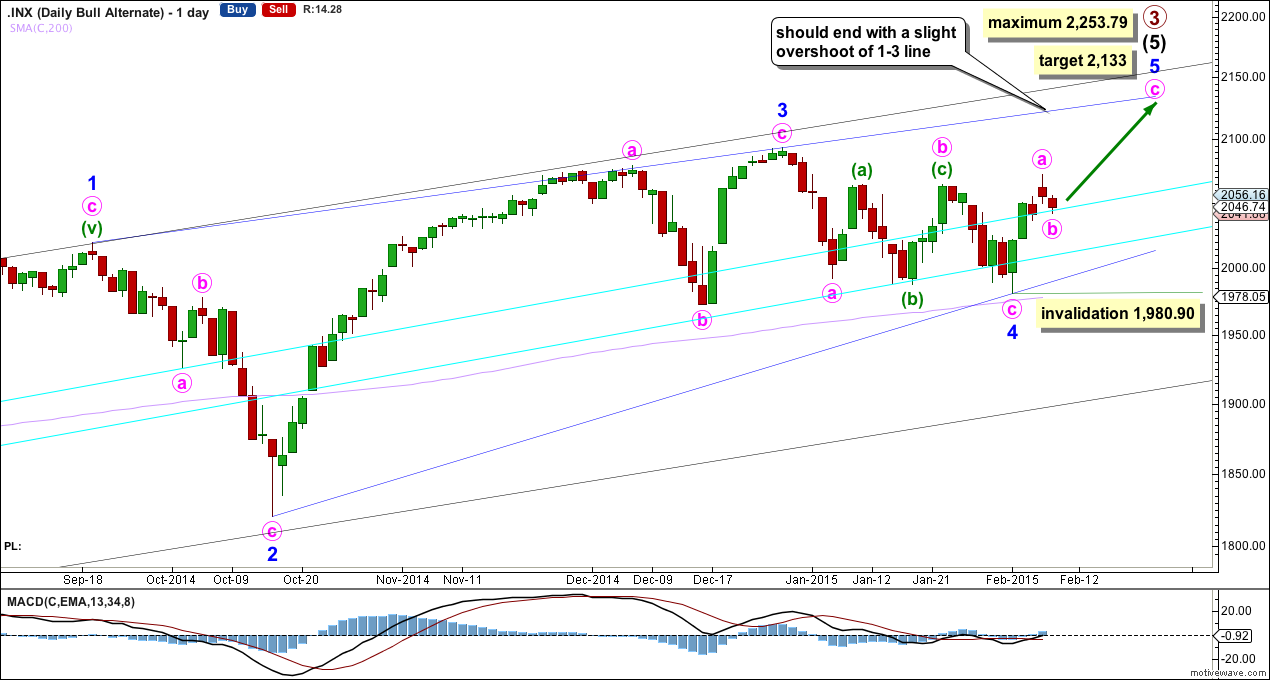
Looking at momentum for the whole of intermediate wave (5) I want to label minor wave 3 over at the high at 2,094 because this has the strongest upwards momentum. The only way this fits is if intermediate wave (5) is seen as an ending diagonal, because within an ending diagonal all the sub waves must be zigzags and the fourth wave should overlap first wave price territory.
Structure on the hourly chart indicates that minor wave 4 is most likely over and minor wave 5 has most likely begun. Minor wave 5 should be a clear three on the daily chart. The best way to see where this final fifth wave should end is probably the 1-3 blue trend line. Contracting diagonals most often see the fifth wave end with a slight overshoot of this trend line.
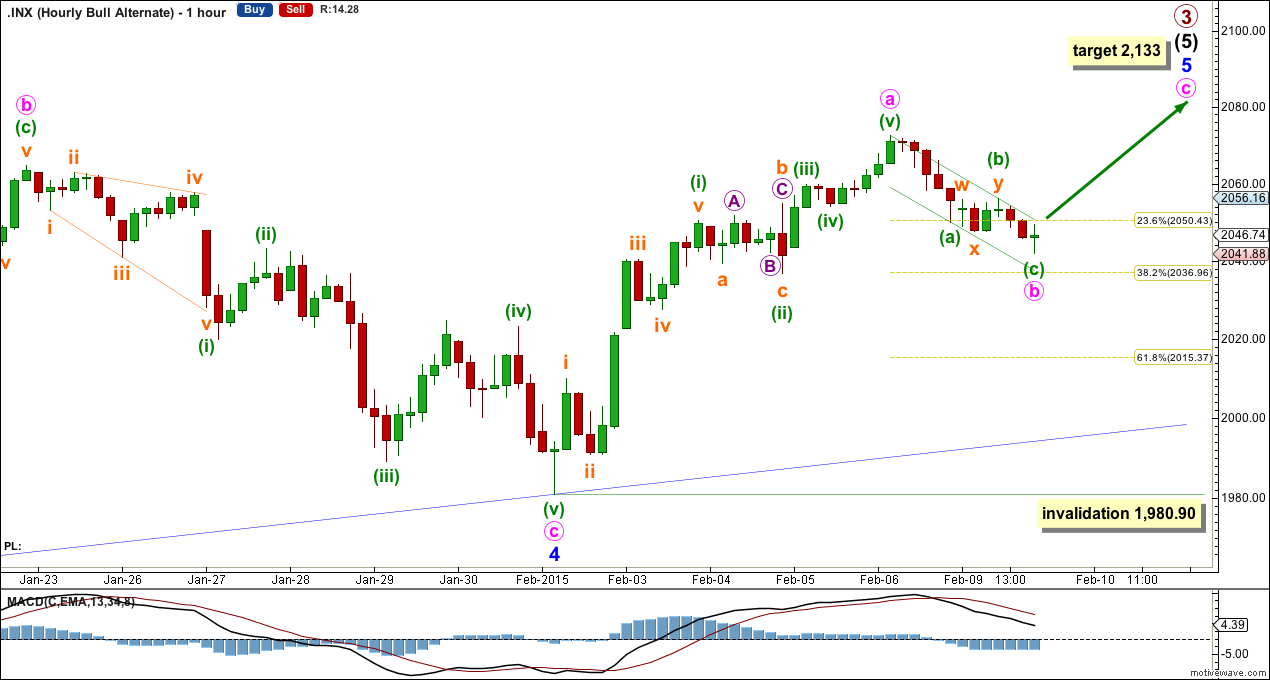
Minute wave b now shows on the daily chart as three red candlesticks. For this alternate wave count it is very likely that the correction is over here.
At 2,133 minute wave c would reach equality in length with minute wave a.
It is still possible that minute wave b may yet continue further sideways or lower. Minute wave b may not move beyond the start of minute wave a below 1,980.90.
Bear Wave Count
This bear wave count differs from the bull wave count at the monthly chart level and at super cycle wave degree. To see the historic picture go here.
The subdivisions within primary waves A-B-C are seen in absolutely exactly the same way as primary waves 1-2-3 for the bull wave count. The alternate bull wave count idea also works perfectly for this bear wave count.
At cycle degree wave b is over the maximum common length of 138% the length of cycle wave a, at 165% the length of cycle wave a. At 2,393 cycle wave b would be twice the length of cycle wave a and at that point this bear wave count should be discarded.
While we have no confirmation of this wave count we should assume the trend remains the same, upwards. This wave count requires confirmation before I have confidence in it.
This analysis is published about 08:21 p.m. EST.