
Yesterday’s counts diverged. Upwards movement was expected from the alternate, but it is not enough for confirmation yet.
Summary: In the very short term I expect some downwards movement tomorrow for a small correction. This may be brief and shallow, or it may take long enough to show up on the daily chart. A new high above 2,064.62 would confirm a breakout of this consolidation phase which has lasted since December, and the breakout when it comes should be upwards. At this stage I expect the trend at minute and minor degrees is upwards.
Click on charts to enlarge.
Main Bull Wave Count
I will favor neither the bull or bear wave count. Both are viable and both expect this current upwards impulse may again be close to complete.
To see a weekly chart with subdivisions and how to draw trend lines and channels click here.
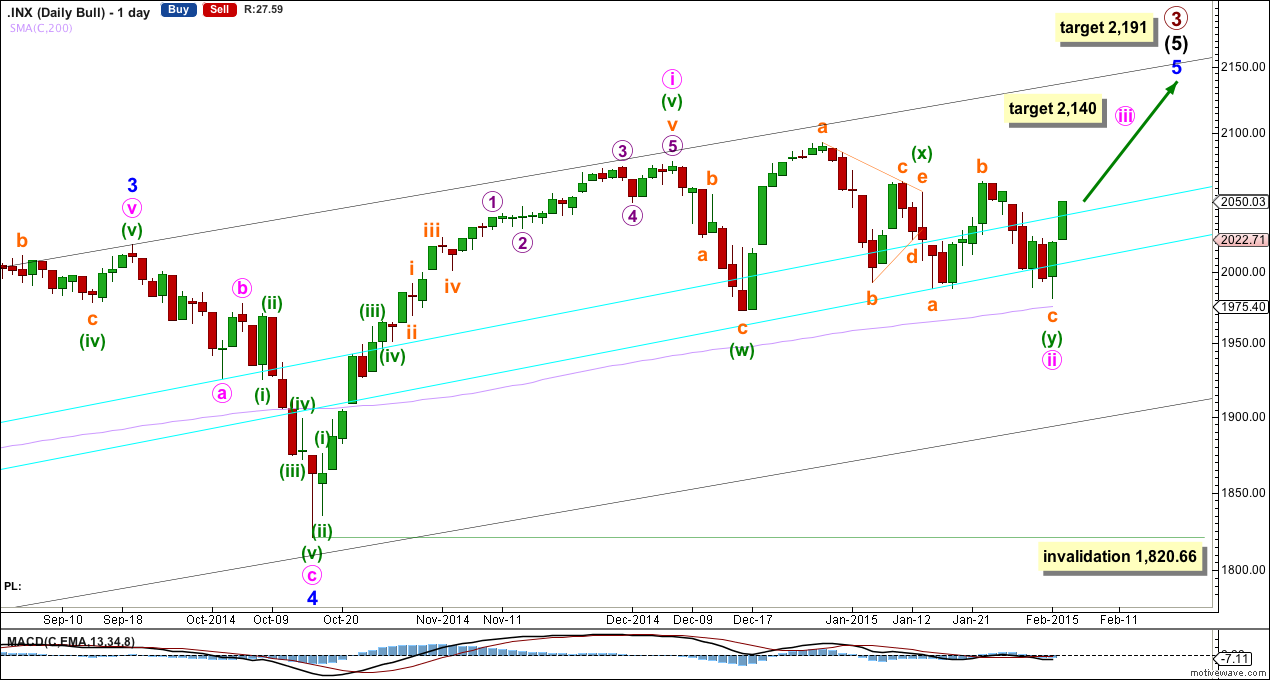
Upwards movement from the low at 666.79 subdivides as an incomplete 5-3-5. For the bull wave count this is seen as primary waves 1-2-3.
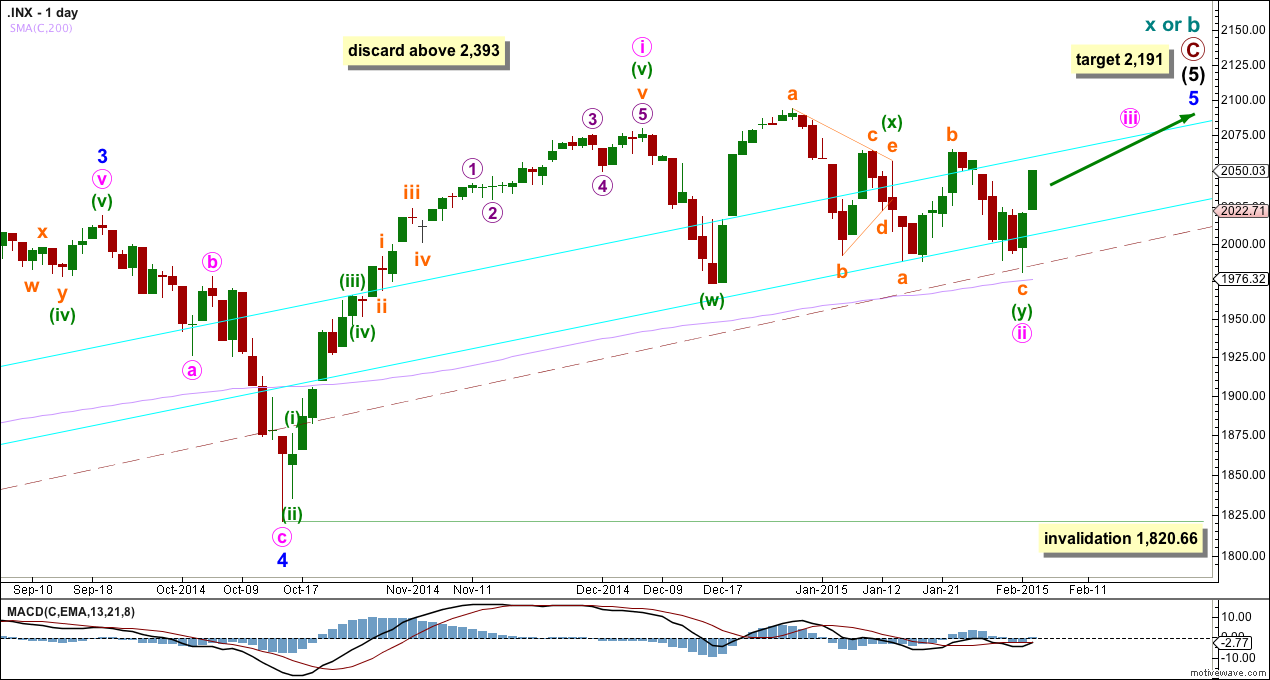
The aqua blue trend lines are traditional technical analysis trend lines. These lines are long held (the lower one has its first anchor in November, 2011), repeatedly tested, and shallow enough to be highly technically significant. When the lower of these double trend lines is breached by a close of 3% or more of market value that should indicate a trend change. It does not indicate what degree the trend change should be though. It looks like the last three corrections may have ended about the lower aqua blue trend line, which gives the wave count a typical look.
I have pulled the upper trend line down a little to touch the low of minute wave a within minor wave 4. This may be a better position for recent movement.
There is still triple technical divergence between MACD and price at the weekly chart level.
At 2,191 primary wave 3 would reach 1.618 the length of primary wave 1. This would expect that within minor wave 5 minute wave iii will be shorter than minute wave i, and minute wave v will be shorter still. Or the target is wrong.
At 2,140 minute wave iii would reach 0.618 the length of minute wave i.
Looking at momentum within intermediate wave (5) it is concerning that minor wave 3 exhibits weakest momentum. It is for this reason I am seriously considering the alternate bullish wave count.
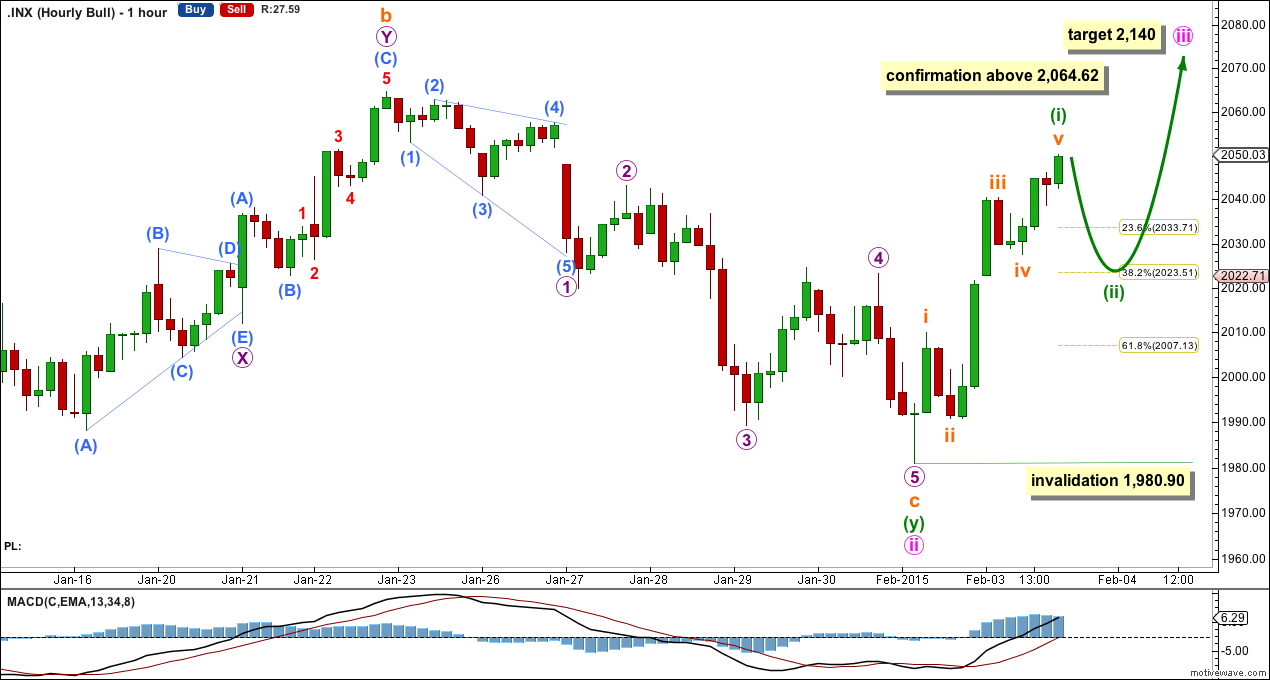
Minute wave ii may now be a complete typical double combination: zigzag – X – flat.
The downwards movement for subminuette wave c is exceptionally difficult to analyse. The time frame which looks clearest is the daily where it looks like a clear five wave impulse. It can fit as a completed five on the hourly.
Minute wave ii would be very likely to be over here as it has a nice sideways look to it. This is how combinations should look. A new high above 2,064.62 would confirm minute wave ii is over and minute wave iii is underway.
In the very short term I would expect to see minuette wave (ii) move lower. Often third waves at minute degree show their subdivisions clearly on the daily chart, so minuette wave (ii) within minute wave iii is reasonably likely to show up on the daily chart as one or more red candlesticks or doji.
Because this is a second wave correction within a third wave one degree higher it may be more shallow and brief than second wave corrections usually are. For this reason I favour the 0.382 Fibonacci ratio as a most likely target for it to end about 2,024.
When minuette wave (ii) is a completed three wave structure on the hourly chart then I would expect a further increase in upwards momentum.
Minuette wave (ii) may not move beyond the start of minuette wave (i) below 1,980.90.
I have an alternate idea today for the alternate hourly chart: both ideas of how to see this last downwards wave fit for both wave counts.
Alternate Bull Wave Count
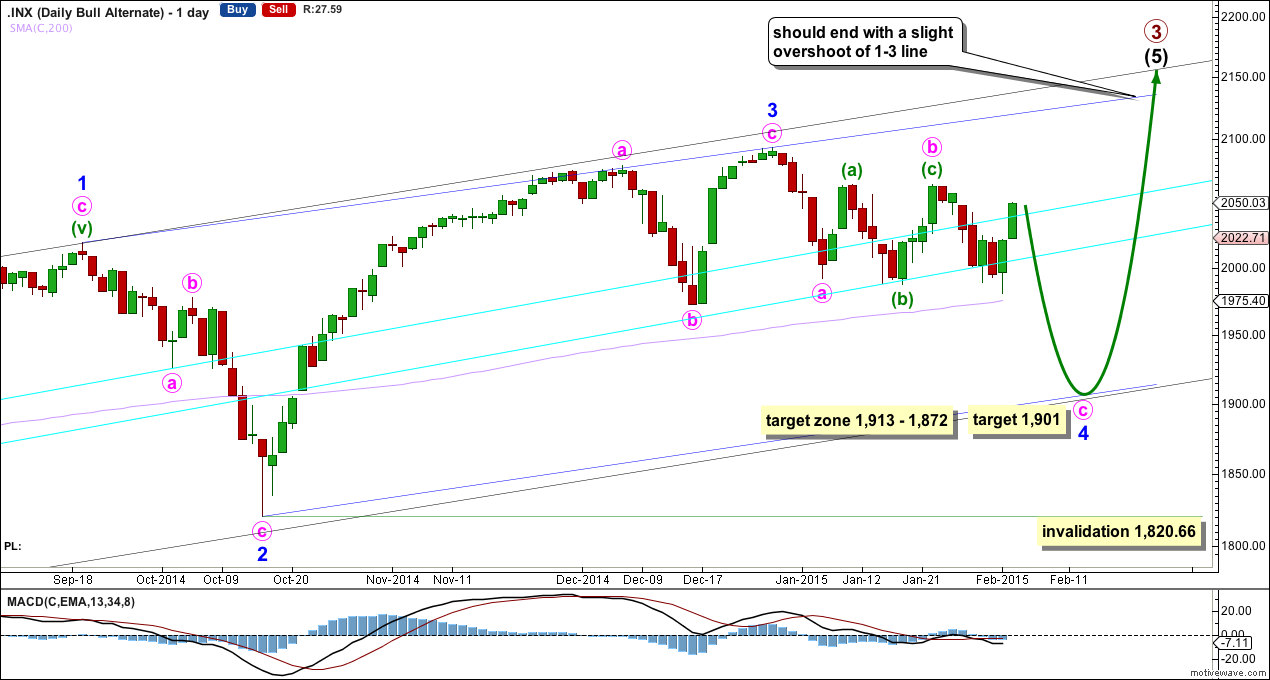
Looking at momentum for the whole of intermediate wave (5) I want to label minor wave 3 over at the high at 2,094 because this has the strongest upwards momentum. The only way this fits is if intermediate wave (5) is seen as an ending diagonal, because within an ending diagonal all the sub waves must be zigzags and the fourth wave should overlap first wave price territory.
The diagonal is contracting: minor wave 3 is shorter than minor wave 1 so minor wave 4 should be shorter than minor wave 2. This maximum depth is at 1,895.
Second and fourth waves within diagonals are normally deep, between 0.66 to 0.81 the length of the first and third waves. This gives a target zone for minor wave 4 of between 1,913 to 1,872, but in this instance the lower end of this zone is too deep for a contracting diagonal.
Minor wave 4 may be over at the recent low of 2,022 (the structure of minute wave c within it would be seen in the same way as the main hourly wave chart sees that downwards movement). This is I think actually more likely, and would see the diagonal clearly contracting. The second and fourth waves may have been forced to be more shallow than normal by support offered by the double aqua blue trend line.
However, there is an alternate way to label this last downwards wave which I have charted for you below.
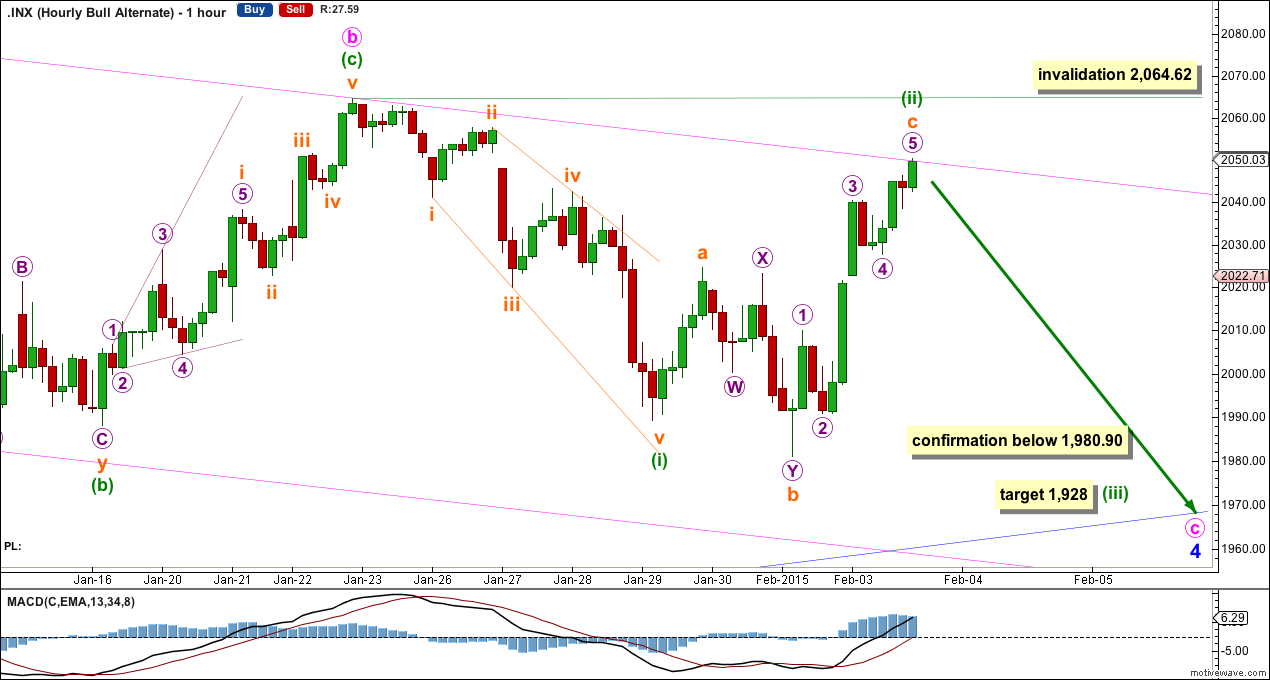
This follows on from the idea Nady and I developed yesterday. A leading expanding diagonal fits for minuette wave (i), particularly on the five minute chart. If a five ends here then minuette wave (ii) is now a deep completed expanded flat correction. Minuette wave (ii) may have found resistance at the upper edge of the channel about minor wave 4.
A new low below 1,980.90 would invalidate the main hourly wave count and the first way of labelling this last downwards movement. At that stage my target for downwards movement would be at 1,928 where minuette wave (iii) would reach 1.618 the length of minuette wave (i).
Minuette wave (ii) may not move beyond the start of minuette wave (i) above 2,064.62.
I expect this alternate idea may be invalidated within one to three days time. I am not confident of the labelling of minuette wave (i) as a diagonal, because the trend lines only slightly diverge and the ii-iv trend line is overshot (diagonals normally adhere strongly to their trend lines). Also, within minuette wave (ii) subminuette wave c looks too long in relation to subminuette wave a.
If this alternate idea at the hourly chart level is invalidated then I would label minor wave 4 as complete and minor wave 5 upwards as underway. I would look for minor wave 5 to end with a slight overshoot of the 1-3 trend line.
Bear Wave Count
This bear wave count differs from the bull wave count at the monthly chart level and at super cycle wave degree. To see the historic picture go here.
The subdivisions within primary waves A-B-C are seen in absolutely exactly the same way as primary waves 1-2-3 for the bull wave count. The alternate bull wave count idea also works perfectly for this bear wave count.
At cycle degree wave b is over the maximum common length of 138% the length of cycle wave a, at 165% the length of cycle wave a. At 2,393 cycle wave b would be twice the length of cycle wave a and at that point this bear wave count should be discarded.
While we have no confirmation of this wave count we should assume the trend remains the same, upwards. This wave count requires confirmation before I have confidence in it.
This analysis is published about 09:47 p.m. EST.