
Upwards movement was expected for Friday’s session. The Elliott wave counts remain mostly the same.
Summary: Downwards movement is expected in the short term for both wave counts. If downwards movement breaches 1,988.12 the alternate bull wave count will be invalidated.
Click on charts to enlarge.
Main Bull Wave Count
I will favor neither the bull or bear wave count. Both are viable and both expect this current upwards impulse may again be close to complete.
To see a weekly chart with subdivisions and how to draw trend lines and channels click here.
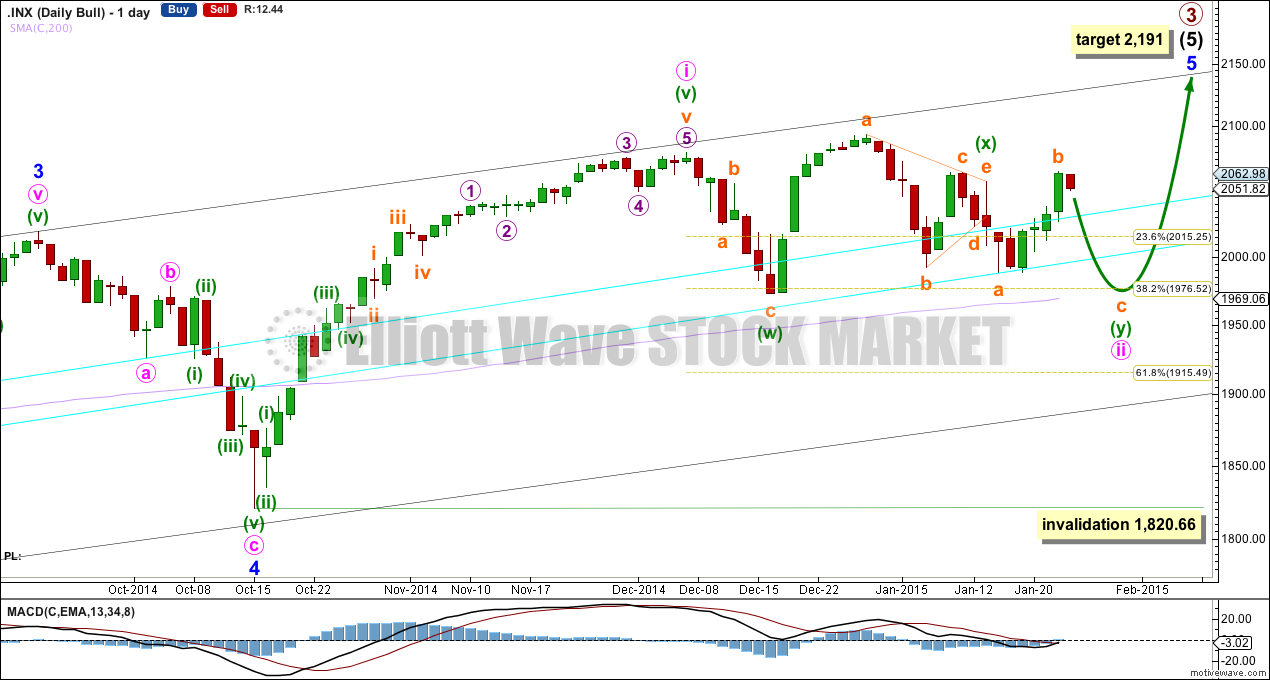
Upwards movement from the low at 666.79 subdivides as an incomplete 5-3-5. For the bull wave count this is seen as primary waves 1-2-3.
The aqua blue trend lines are traditional technical analysis trend lines. These lines are long held, repeatedly tested, and shallow enough to be highly technically significant. When the lower of these double trend lines is breached by a close of 3% or more of market value that should indicate a trend change. It does not indicate what degree the trend change should be though. It looks like the last two corrections may have ended just short of the lower aqua blue trend line, which gives the wave count a typical look.
I have pulled the upper trend line down a little to touch the low of minute wave a within minor wave 4. This may be a better position for recent movement.
There is still triple technical divergence between MACD and price at the weekly chart level.
Minute wave i lasted seven weeks, 36 days, which is two days longer than a Fibonacci 34. Minute wave ii has now lasted 32 days. It if ends in another two to four sessions it would be equal in duration or a Fibonacci 34 days.
At 2,191 primary wave 3 would reach 1.618 the length of primary wave 1. This would expect that within minor wave 5 minute wave iii will be shorter than minute wave i, and minute wave v will be shorter still. Or the target is wrong.
Looking at momentum within intermediate wave (5) it is concerning that minor wave 3 exhibits weakest momentum. It is for this reason I am seriously considering the alternate bullish wave count.
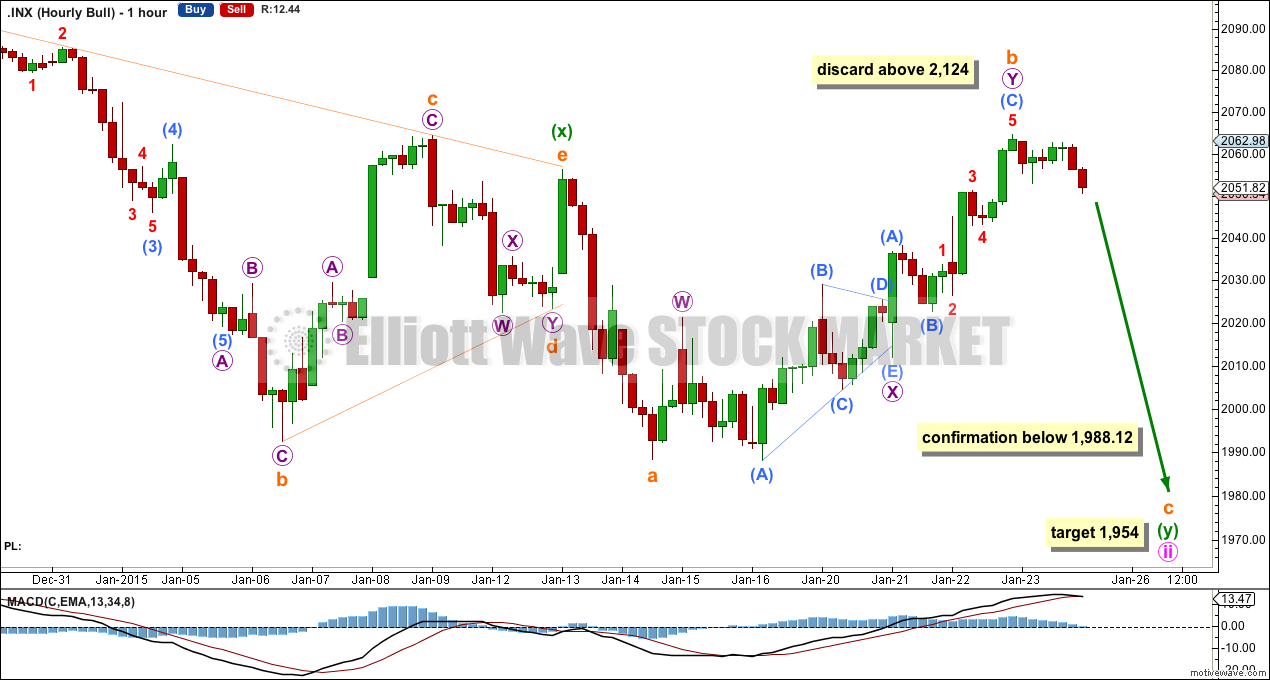
I have taken some time to reconsider the upwards movement within subminuette wave b as the last labelling no longer worked. It may be a complete double zigzag, where micro wave X is a running contracting triangle. The subdivisions all fit.
Minute wave ii is a double combination, and the second structure within this double labelled here minuette wave (y) may be an incomplete expanded flat correction. At 1,954 subminuette wave c would reach 1.618 the length of subminuette wave a.
Subminuette wave c is extremely likely to make at least a slight new low below the end of subminuette wave a at 1,988.14 in order to avoid a truncation and a very rare running flat. If it does not move below this point I will discard this main wave count in favour of the alternate below.
If we see a new low below 1,988.12 the alternate below would be invalidated and this main wave count would be confirmed.
If subminuette wave c downwards lasts two to four days in total then minute wave ii would have a typical look and good proportion on the daily chart.
Alternate Bull Wave Count
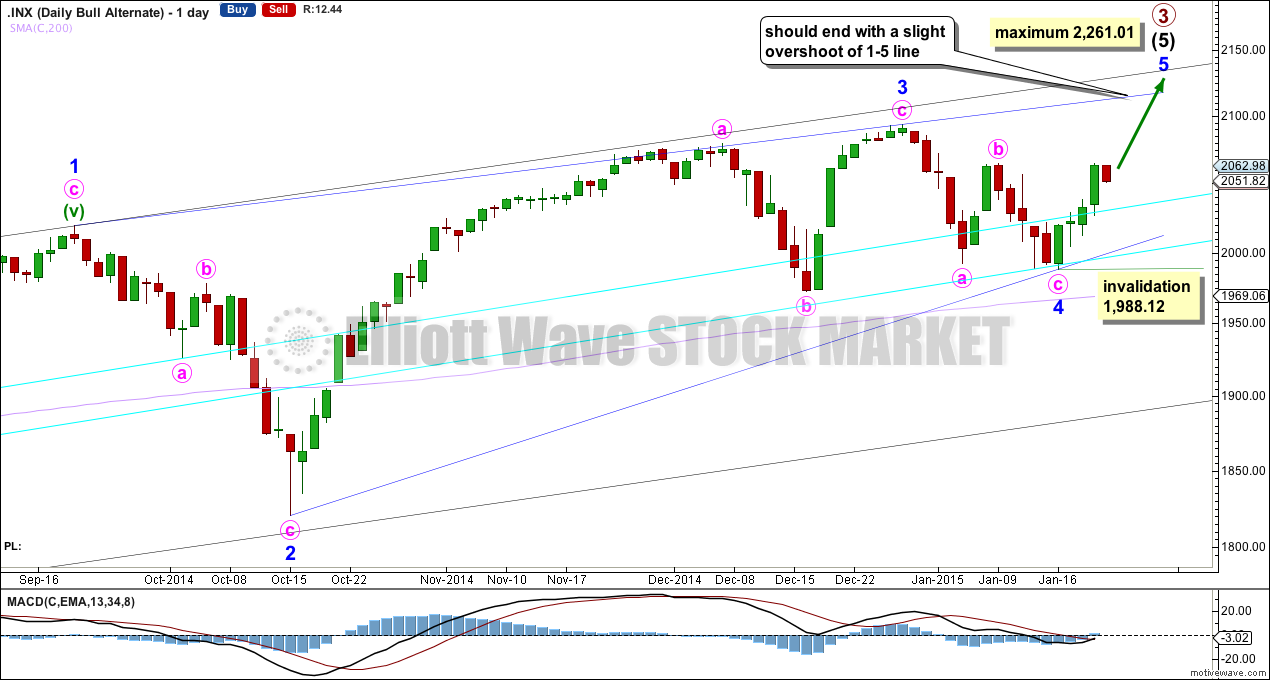
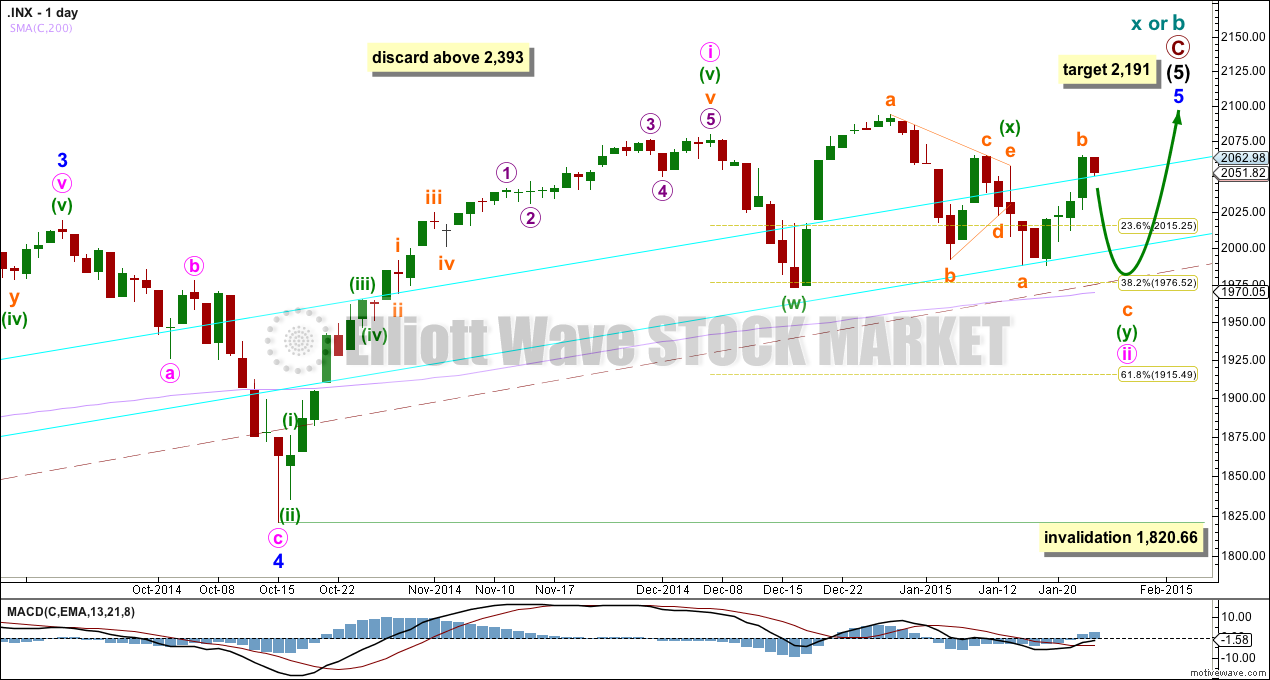
Looking at momentum for the whole of intermediate wave (5) I want to label minor wave 3 over at the high at 2,094 because this has the strongest upwards momentum. The only way this fits is if intermediate wave (5) is seen as an ending diagonal, because within an ending diagonal all the sub waves must be zigzags.
The diagonal is contracting: minor wave 3 is shorter than minor wave 1 and minor wave 4 is shorter than minor wave 2.
Within the final zigzag of minor wave 5 minute wave b may not move beyond the start of minute wave a below 1,988.12.
Minor wave 5 may not be longer than equality with minor wave 3, because the diagonal is contracting and a third wave may never be the shortest. This limit is at 2,261.01. However, I would expect minor wave 5 to come to an end well below this point, and should end with a slight overshoot of the 1-3 trend line as this is the most common place for fifth waves of contracting diagonals to end. This trend line is probably the best way to tell when this fifth wave should end.
Minor wave 1 lasted 228 days (5 short of a Fibonacci 233), minor wave 2 lasted 18 days, minor wave 3 lasted 51 days, and minor wave 4 lasted a Fibonacci 13 days. Minor wave 5 should be more brief than minor wave 3, and it may be about even in duration with minor wave 4. It may end in another 9 days time to total a Fibonacci 13.
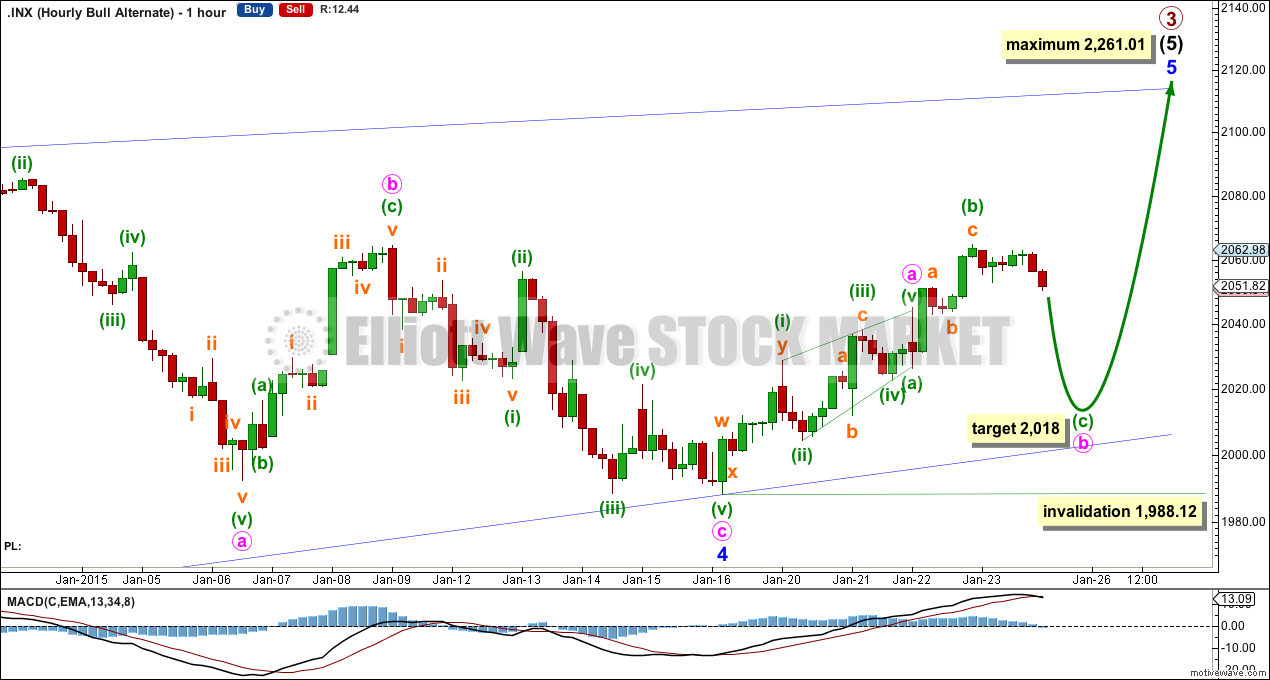
For this hourly wave count I am leaving the leading diagonal for minute wave a as previously labelled. Minute wave b however is relabelled, and may not be complete.
Minute wave b may be unfolding as an expanded flat correction. At 2,018 minuette wave (c) within it would reach 2.618 the length of minuette wave (a).
Within minor wave 5 so far the structure for minute wave a has a very good fit on the five minute chart. The structure for minute wave b also has a good fit, but the length of it is 2.14 times the length of minuette wave (a). This is longer than the normally allowed length of a B wave within a flat correction. However, at this stage after trying different structures for this idea I cannot yet see another way to label this upwards movement if it begins at the low labelled minor wave 4.
This would now allow minute wave b to move deeper and be more obvious on the daily chart. Minor wave 5 should look like an obvious three wave zigzag on the daily chart, so the B wave within it should show up clearly.
Minute wave b may not move beyond the start of minute wave a below 1,988.12.
Bear Wave Count
This bear wave count differs from the bull wave count at the monthly chart level and at super cycle wave degree. To see the historic picture go here.
The subdivisions within primary waves A-B-C are seen in absolutely exactly the same way as primary waves 1-2-3 for the bull wave count. The alternate bull wave count idea also works perfectly for this bear wave count.
At cycle degree wave b is over the maximum common length of 138% the length of cycle wave a, at 165% the length of cycle wave a. At 2,393 cycle wave b would be twice the length of cycle wave a and at that point this bear wave count should be discarded.
While we have no confirmation of this wave count we should assume the trend remains the same, upwards. This wave count requires confirmation before I have confidence in it.
This analysis is published about 06:47 p.m. EST.