
Price moved lower as expected to end at 2,047.01, right in the target zone at 2,049 – 2,047.
Summary: The upwards trend should resume. This would be confirmed with a clear breach of the channel on the hourly chart. The short term target is at 2,121.
Click on charts to enlarge.
Bull Wave Count
I will favor neither the bull or bear wave count. Both are viable and both expect this current upwards impulse may again be close to complete.
To see a weekly chart with subdivisions and how to draw trend lines and channels click here.
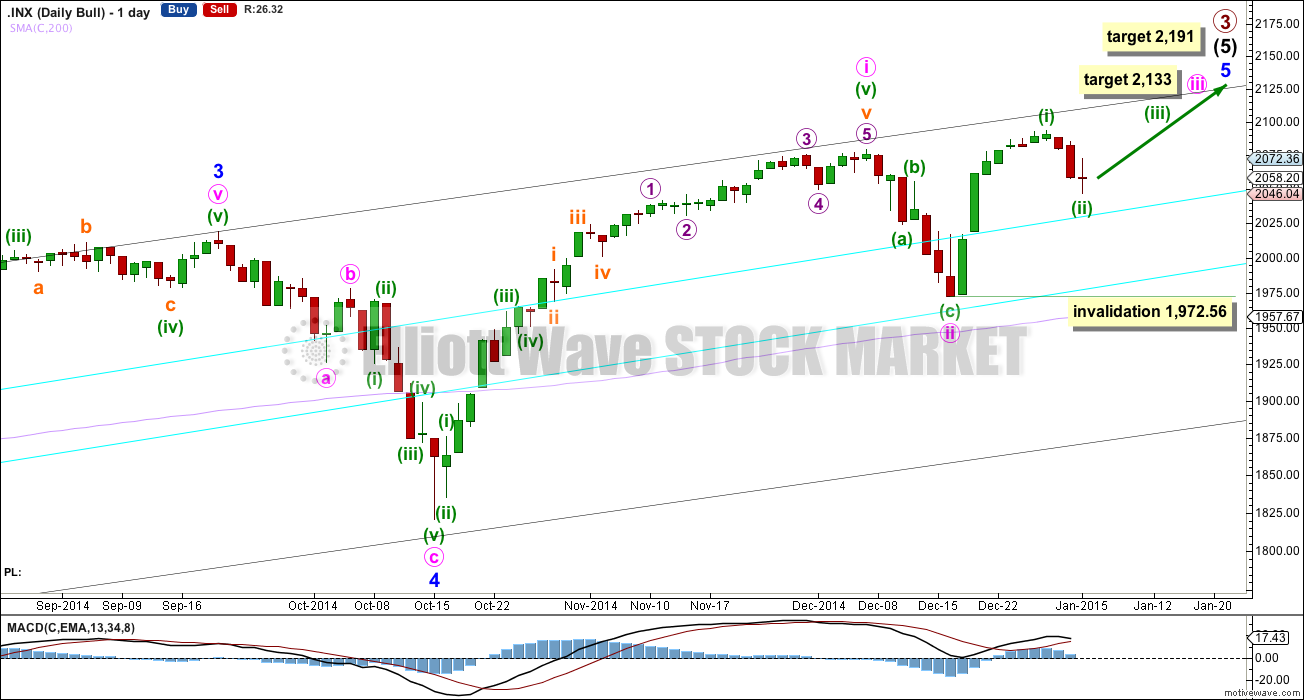
Upwards movement from the low at 666.79 subdivides as an incomplete 5-3-5. For the bull wave count this is seen as primary waves 1-2-3.
Within intermediate wave (5) minor wave 2 is an expanded flat and minor wave 4 is a zigzag. Minor wave 3 is 14.29 points longer than 1.618 the length of minor wave 1.
At intermediate degree there is also a very close relationship between intermediate waves (3) and (1): intermediate wave (3) is just 0.76 points less than 2.618 the length of intermediate wave (1).
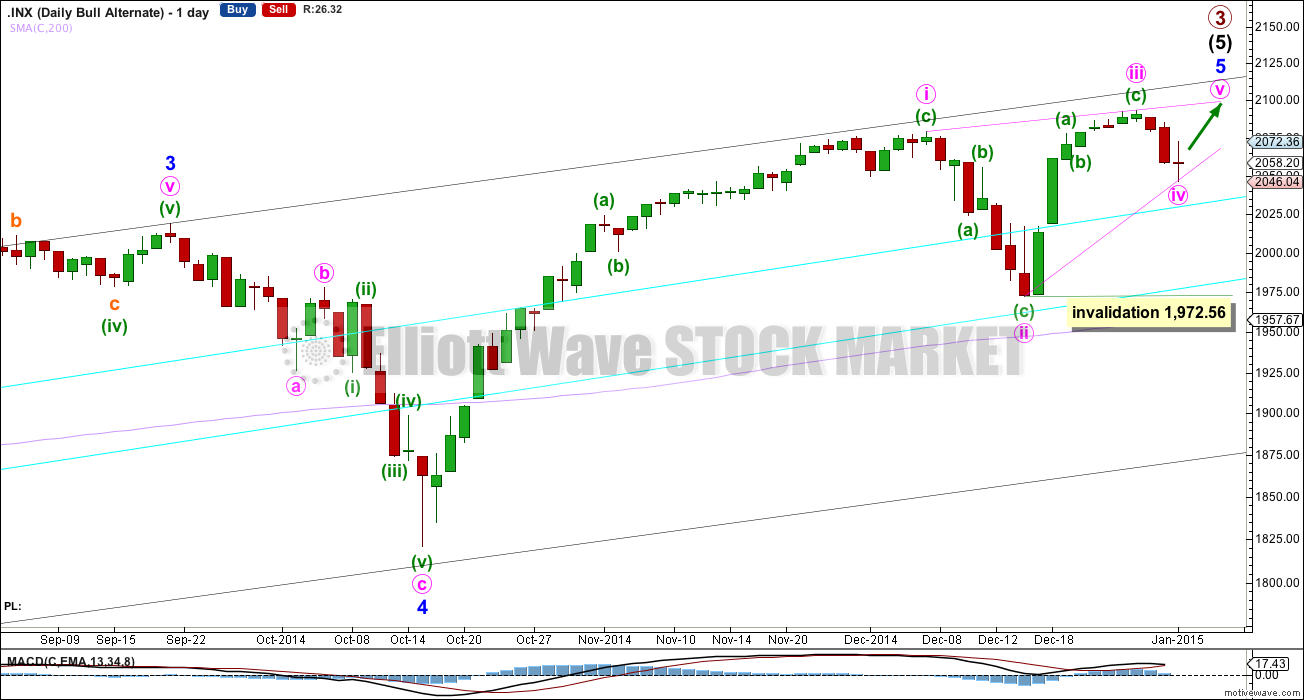
The aqua blue trend lines are traditional technical analysis trend lines. These lines are long held, repeatedly tested, and shallow enough to be highly technically significant. When the lower of these double trend lines is breached by a close of 3% or more of market value that should indicate a trend change. It does not indicate what degree the trend change should be though. It looks like minute wave ii may have ended just short of the lower aqua blue trend line, which gives the wave count a typical look.
There is still triple technical divergence between MACD and price at the weekly chart level.
Minute wave i lasted seven weeks, 36 days, which is two days longer than a Fibonacci 34. Minute wave iii may last 21 or 34 days in total if it is to be 0.618 or even in duration to minute wave i. This would see it continue for a further 10 or 23 trading days.
Minute wave iii may show its subdivisions clearly on the daily chart. Recent downwards movement looks like a second wave correction which may not move beyond the start of minuette wave (i) below 1,972.56. At 2,133 minute wave iii would reach 0.618 the length of minute wave i.
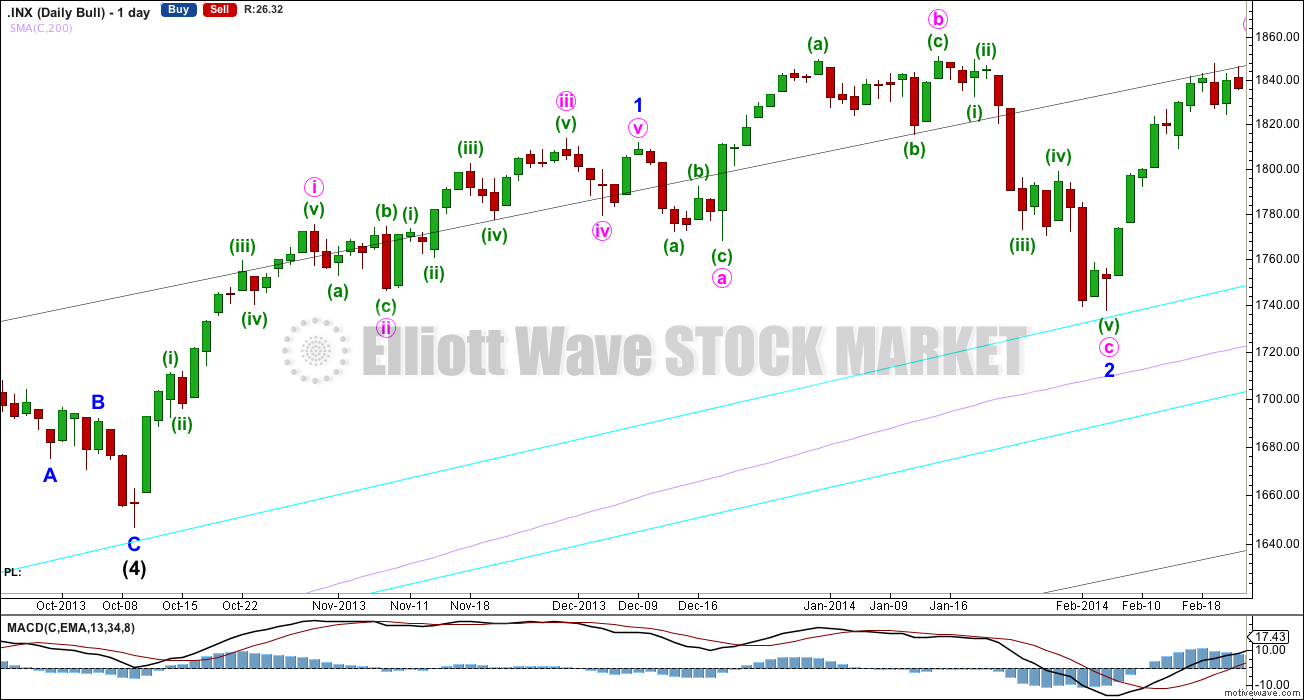
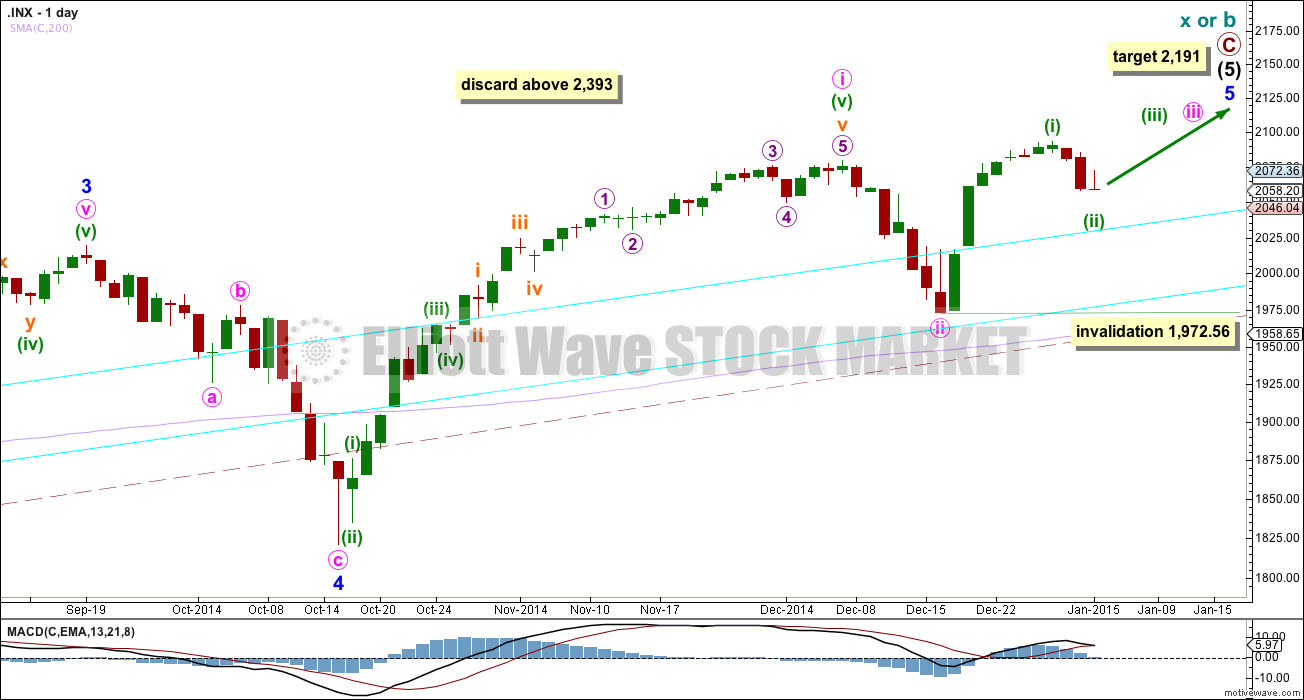
I am expecting that within minor wave 5 minute wave iii will be shorter than minute wave i, and minute wave v will be shorter still, to fit with the target for primary wave 3 to end. I am expecting to see a repeat of the relationships within minor wave 1, and so I provide a chart of this movement below. Within minor wave 1 there is no Fibonacci ratio between minute waves i and iii, and minute wave v is 2.05 points longer than 0.236 the length of minute wave i. There is perfect alternation between minute waves ii and iv: minute wave ii is a shallow 23% expanded flat, and minute wave iv is a relatively deep 51% zigzag.
At 2,191 primary wave 3 would reach 1.618 the length of primary wave 1. This would expect that minor wave 5 is either an ending contracting diagonal (minute wave i would be seen as a zigzag, which is possible) or within minor wave 5 minute wave iii will be shorter than minute wave i, and minute wave v will be shorter still. Both these scenarios are possible. Or the target is wrong.
Minor Wave 1 Chart
Main Count Hourly Chart
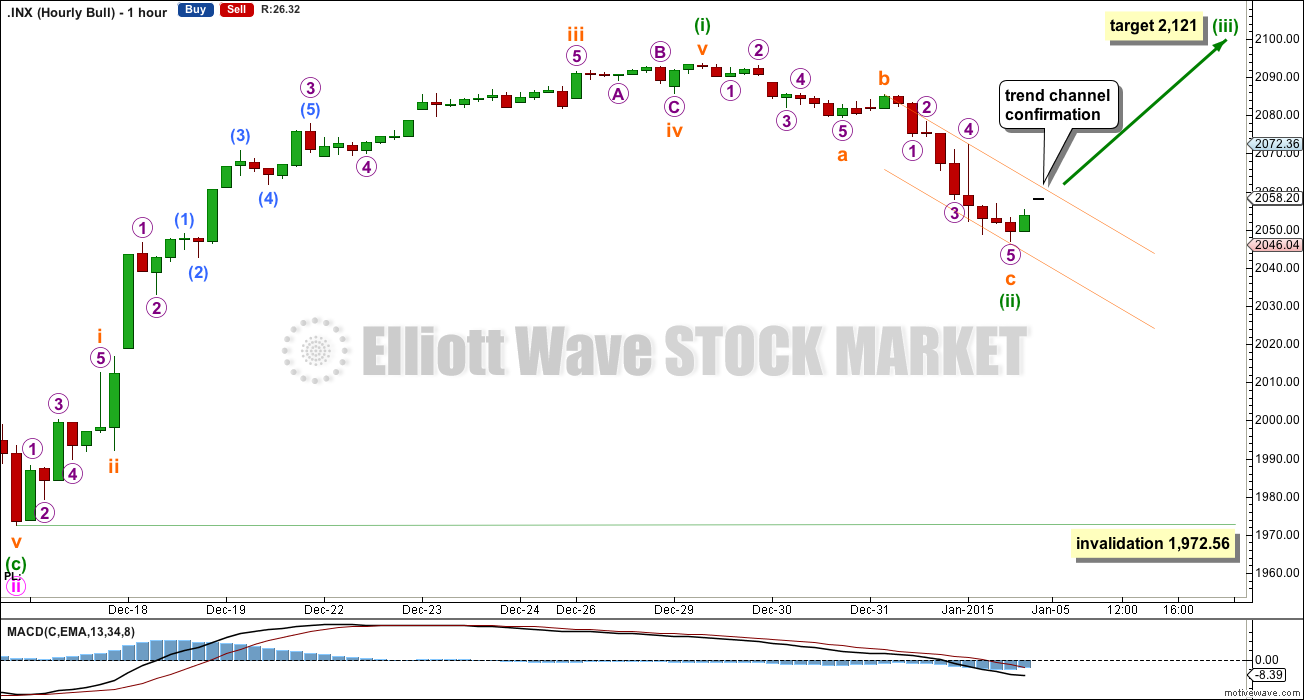
The downwards zigzag of minuette wave (ii) is now a complete 5-3-5 zigzag, reaching down to the 0.382 Fibonacci ratio of minuette wave (i). Within it subminuette wave c is just 1.87 points longer than 2.618 the length of subminuette wave a.
The channel drawn about this downwards movement is a best fit. Only when it is clearly breached by upwards movement would I have confidence in the target, and will I move the invalidation point to the end of this second wave. While this channel is not breached it is possible that minuette wave (ii) could continue further, but may not move beyond the start of minuette wave (i) below 1,972.56.
At 2,121 minuette wave (iii) would reach 0.618 the length of minuette wave (i).
Alternate Bull Wave Count
Alternatively, minor wave 5 may be an ending contracting diagonal. Within an ending diagonal all sub waves must be zigzags, and the fourth wave must overlap back into first wave price territory.
Within this diagonal minute wave ii is only .41 of minute wave i, and minute wave iv is only .38 of minute wave iii. Within diagonals the normal depth of second and fourth waves is between 0.66 to 0.81. These waves are much more shallow, and this reduces the probability of this wave count to an alternate.
If minute wave iv moves any lower it may not move beyond the end of minute wave ii at 1,972.56.
This alternate may see a swift end to primary wave 3, which may not exhibit a Fibonacci ratio to primary wave 1. The final fifth wave of the diagonal would be very likely to end with a very small overshoot of the upper i-iii diagonal trend line.
Bear Wave Count
This bear wave count differs from the bull wave count at the monthly chart level and at super cycle wave degree. To see the historic picture go here.
The subdivisions within primary waves A-B-C are seen in absolutely exactly the same way as primary waves 1-2-3 for the bull wave count.
At cycle degree wave b is over the maximum common length of 138% the length of cycle wave a, at 165% the length of cycle wave a. At 2,393 cycle wave b would be twice the length of cycle wave a and at that point this bear wave count should be discarded.
While we have no confirmation of this wave count we should assume the trend remains the same, upwards. This wave count requires confirmation before I have confidence in it.
This analysis is published about 10:13 p.m. EST.