
Upwards movement was again expected. The upper edge of the black channel on the daily Elliott wave chart looks like it is again providing resistance.
Summary: The short term target at 2,097 – 2,098 may be too optimistic. I expect another small green candlestick or doji for tomorrow’s session. The mid term target is at 2,132. This may be met in 8 or 16 days time.
Note: Tomorrow’s analysis must be prepared by me during my Christmas Day (my time zone is +13GMT). Because it’s Christmas I’ll prepare text and charts only. There will be no video tomorrow. I expect the markets will be very quiet during Christmas Eve anyway. Merry Christmas everyone!
Click on charts to enlarge.
Bull Wave Count
I will favor neither the bull or bear wave count. Both are viable and both expect this current upwards impulse may again be close to complete.
To see a weekly chart with subdivisions and how to draw trend lines and channels click here.
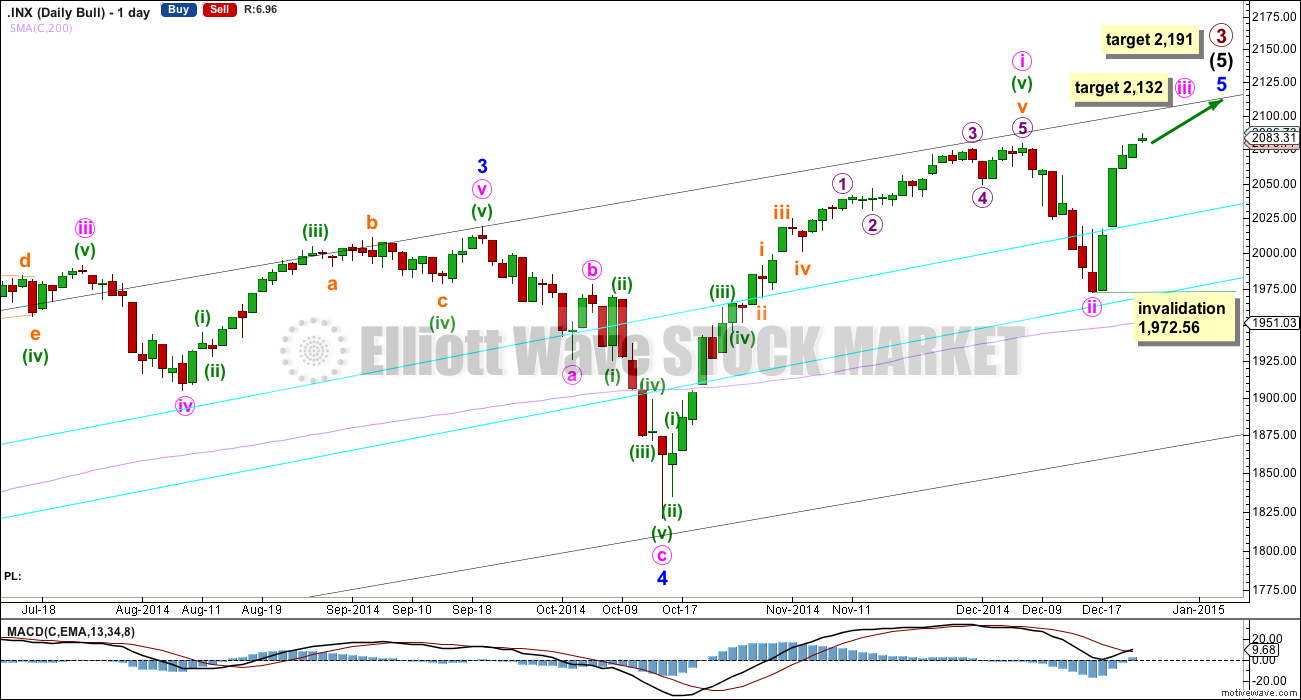
Upwards movement from the low at 666.79 subdivides as an incomplete 5-3-5. For the bull wave count this is seen as primary waves 1-2-3.
Within intermediate wave (5) minor wave 2 is an expanded flat and minor wave 4 is a zigzag. Minor wave 3 is 14.29 points longer than 1.618 the length of minor wave 1.
At intermediate degree there is also a very close relationship between intermediate waves (3) and (1): intermediate wave (3) is just 0.76 points less than 2.618 the length of intermediate wave (1).
The aqua blue trend lines are traditional technical analysis trend lines. These lines are long held, repeatedly tested, and shallow enough to be highly technically significant. When the lower of these double trend lines is breached by a close of 3% or more of market value that should indicate a trend change. It does not indicate what degree the trend change should be though. It looks like minute wave ii may have ended just short of the lower aqua blue trend line, which gives the wave count a typical look.
There is still triple technical divergence between MACD and price at the weekly chart level.
At 2,132 minute wave iii would reach 0.618 the length of minute wave i. Minute wave i lasted seven weeks, 36 days, which is two days longer than a Fibonacci 34. Minute wave iii may be either 13 or 21 days in total if it is to be 0.382 or 0.618 the duration of minute wave i. This would see it continue for a further 8 or 16 trading days.
At 2,191 primary wave 3 would reach 1.618 the length of primary wave 1. This would expect that minor wave 5 is either an ending contracting diagonal (minute wave i would be seen as a zigzag, which is possible) or within minor wave 5 minute wave iii will be shorter than minute wave i, and minute wave v will be shorter still. Both these scenarios are possible. Or the target is wrong.
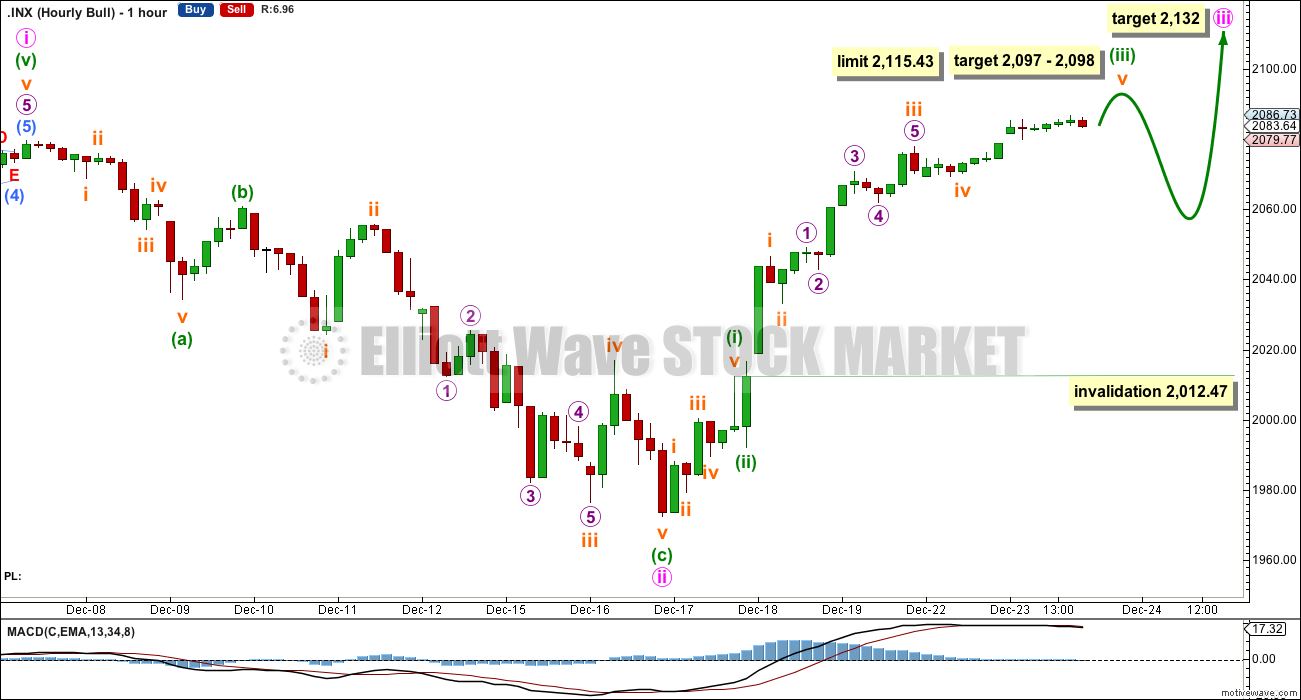
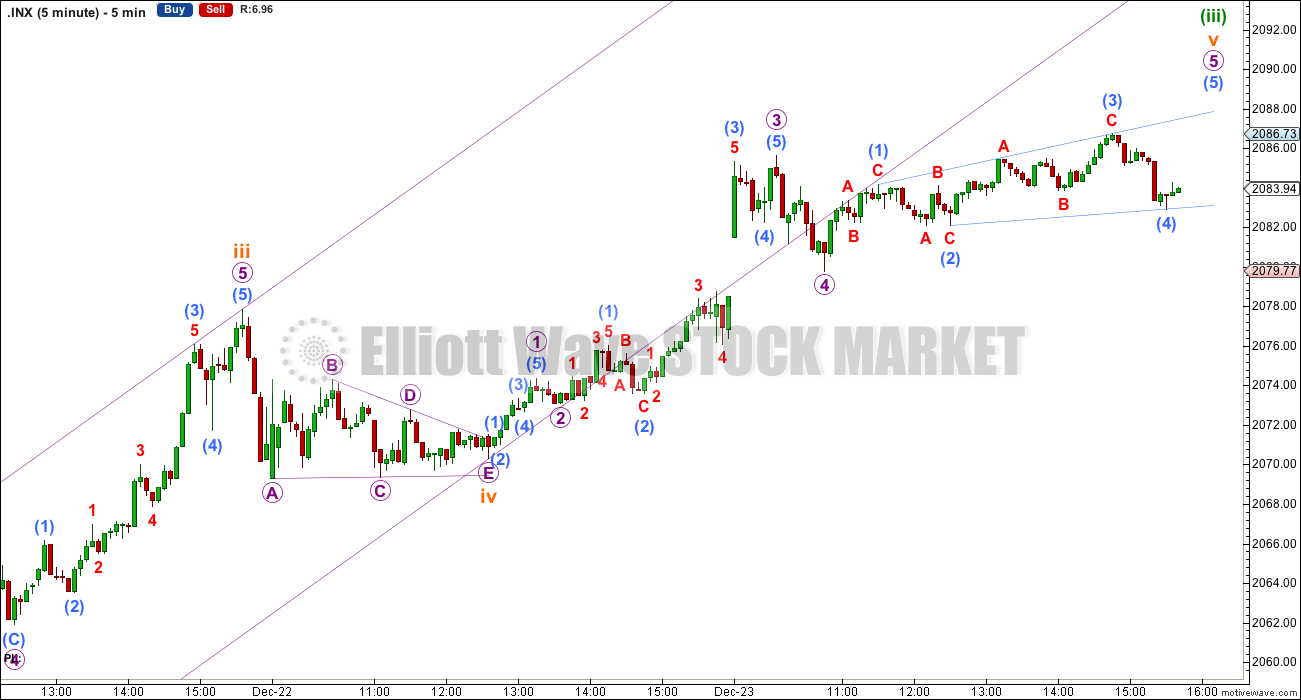
The channel is not showing where upwards movement is finding support so I have removed it. This upwards movement looks typical for a fifth wave from the S&P, which is slowing and breaking down towards the high. The target may be too high, but I still expect some more upwards movement tomorrow because on the five minute chart the structure still looks incomplete.
At 2,097 minuette wave (iii) would reach 2.618 the length of minuette wave (i).
Within minuette wave (iii) there is no Fibonacci ratio between subminuette waves i and iii. This makes it more likely that subminuette wave v will exhibit a Fibonacci ratio to either of subminuette waves i or iii. At 2,098 subminuette wave v would reach 0.618 the length of subminuette wave iii. Because subminuette wave iii is shorter than subminuette wave i this limits subminuette wave v to no longer than equality in length with subminuette wave iii at 2,115.43 so that the core Elliott wave rule stating a third wave may not be the shortest is met.
Minuette wave (ii) was a quick sharp zigzag at 51% the length of minuette wave (i). Minuette wave (iv) should exhibit alternation with minuette wave (ii) and should be shallow. It may be a sideways type of correction, such as a combination or triangle, which tend to be more time consuming structures than zigzags, and may show up on the daily chart as one or more red candlesticks or doji.
Minuette wave (iv) may not move into minuette wave (i) price territory below 2,012.47.
Bear Wave Count
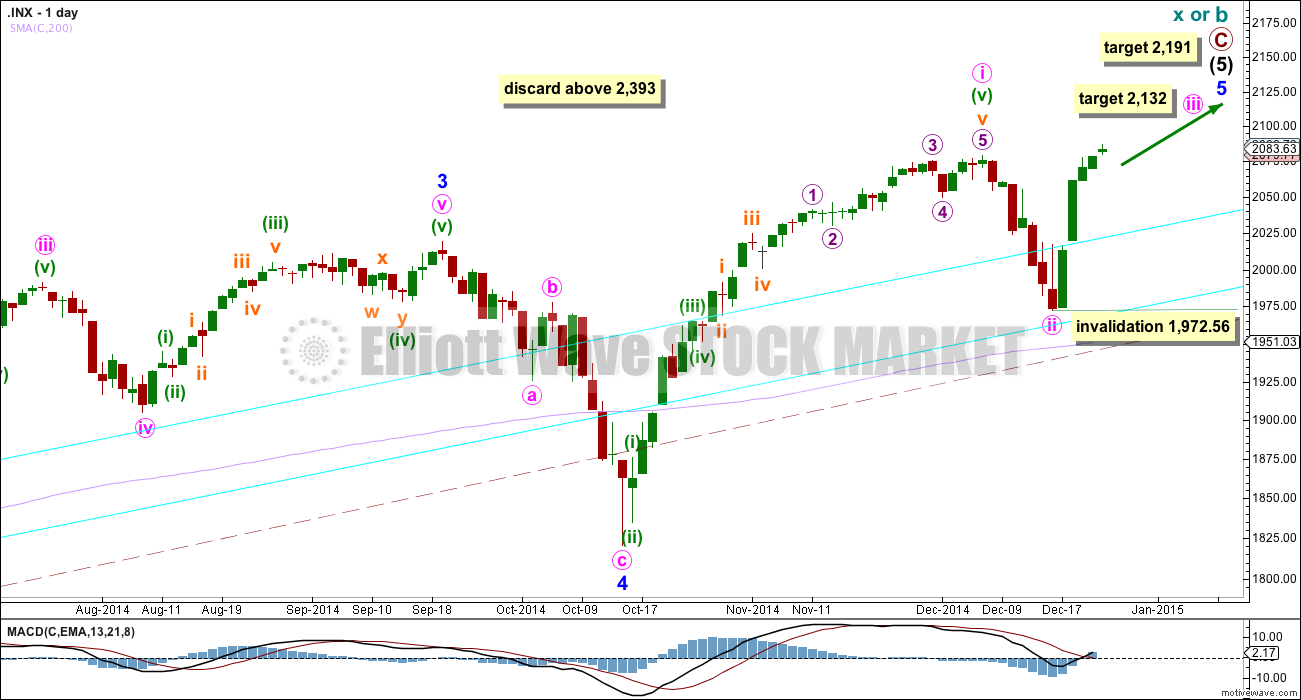
This bear wave count differs from the bull wave count at the monthly chart level and at super cycle wave degree. To see the historic picture go here.
The subdivisions within primary waves A-B-C are seen in absolutely exactly the same way as primary waves 1-2-3 for the bull wave count. Thus targets and invalidation points for the mid term are exactly the same. The structure on the hourly chart is also the same. These wave counts do not diverge, and they probably will not for months yet.
At cycle degree wave b is over the maximum common length of 138% the length of cycle wave a, at 164% the length of cycle wave a. At 2,393 cycle wave b would be twice the length of cycle wave a and at that point this bear wave count should be discarded.
While we have no confirmation of this wave count we should assume the trend remains the same, upwards. This wave count requires confirmation before I have confidence in it.
This analysis is published about 07:21 p.m. EST.