
The main Elliott wave count expected upwards movement. A new high above 2,034.17 confirmed the main Elliott wave count and invalidated the alternate. The bull market is intact.
Summary: The mid term target is at 2,132. This may be met in 11 or 19 days time.
Click on charts to enlarge.
Bull Wave Count
I will favor neither the bull or bear wave count. Both are viable and both expect this current upwards impulse may again be complete.
To see a weekly chart with subdivisions and how to draw trend lines and channels click here.
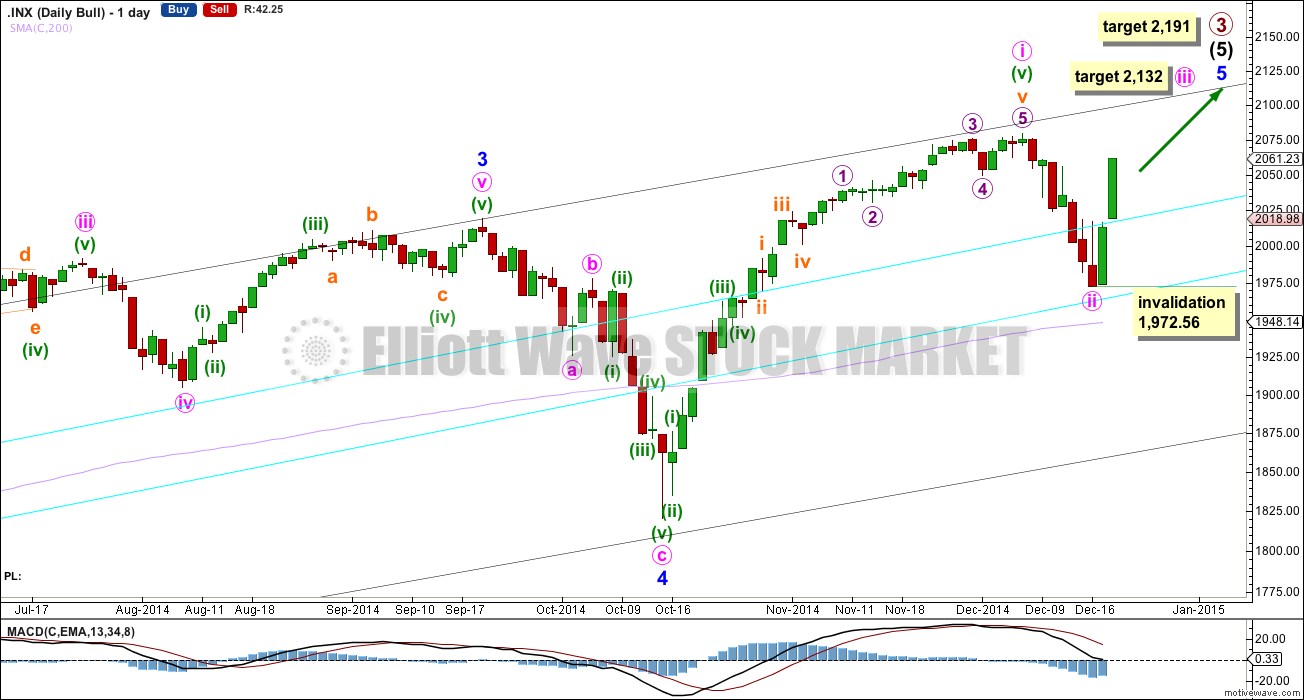
Upwards movement from the low at 666.79 subdivides as an incomplete 5-3-5. For the bull wave count this is seen as primary waves 1-2-3.
Within intermediate wave (5) minor wave 2 is an expanded flat and minor wave 4 is a zigzag. Minor wave 3 is 14.29 points longer than 1.618 the length of minor wave 1.
At intermediate degree there is also a very close relationship between intermediate waves (3) and (1): intermediate wave (3) is just 0.76 points less than 2.618 the length of intermediate wave (1).
The aqua blue trend lines are traditional technical analysis trend lines. These lines are long held, repeatedly tested, and shallow enough to be highly technically significant. When the lower of these double trend lines is breached by a close of 3% or more of market value that should indicate a trend change. It does not indicate what degree the trend change should be though. For the main bull wave count it looks like minute wave ii may have ended just short of the lower aqua blue trend line, if this wave count is correct this would give it a typical look. For the alternate bull wave count (the second hourly chart below) I would expect this lower trend line to be breached by more than 3% of market value at the close.
There is still triple technical divergence between MACD and price at the weekly chart level.
At 2,132 minute wave iii would reach 0.618 the length of minute wave i. Minute wave i lasted seven weeks, 36 days. This is two days longer than a Fibonacci 34. Minute wave iii may be either 21 or 13 days in total if it is to be 0.618 or 0.383 the duration of minute wave i. This would see it continue for a further 19 or 11 trading days.
At 2,191 primary wave 3 would reach 1.618 the length of primary wave 1. This would expect that minor wave 5 is either an ending contracting diagonal (minute wave i would be seen as a zigzag, which is possible) or within minor wave 5 minute wave iii will be shorter than minute wave i, and minute wave v will be shorter still. Both these scenarios are possible. Or the target is wrong.
Downwards movement labelled minute wave ii is now confirmed as a complete three wave structure. This is a small correction within the ongoing bull market.
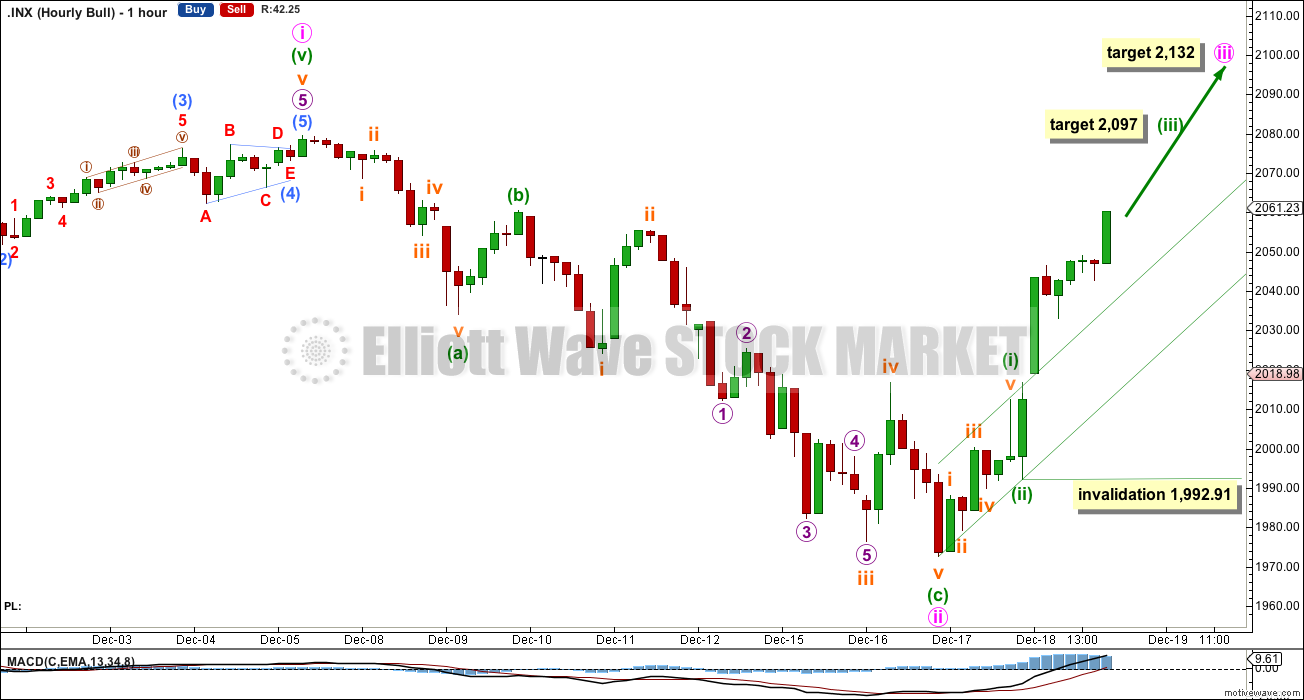
At this stage the wave count expects to see a third wave up complete as either an impulse if minor wave 5 is an impulse, or a zigzag if minor wave 5 is an ending diagonal. At this stage the ideas do not diverge, but I will have an alternate wave count for the diagonal idea when it begins to diverge from this main impulse idea.
Within the new upwards trend of minute wave iii a first and second wave are complete. This may be minuette waves (i) and (ii). At 2,097 minuette wave (iii) would reach 2.618 the length of minuette wave (i).
Within minuette wave (iii) no second wave correction may move beyond the start of its first wave below 1,992.91.
Draw a base channel about minuette waves (i) and (ii): draw the first trend line from the start of minuette wave (i) to the end of minuette wave (ii), then place a parallel copy on the end of minuette wave (i). The third wave has breached the upper edge of the base channel, as it should. This confirms a third wave is underway. Along the way up I would now expect downwards corrections to find support at the upper edge of this channel.
Bear Wave Count
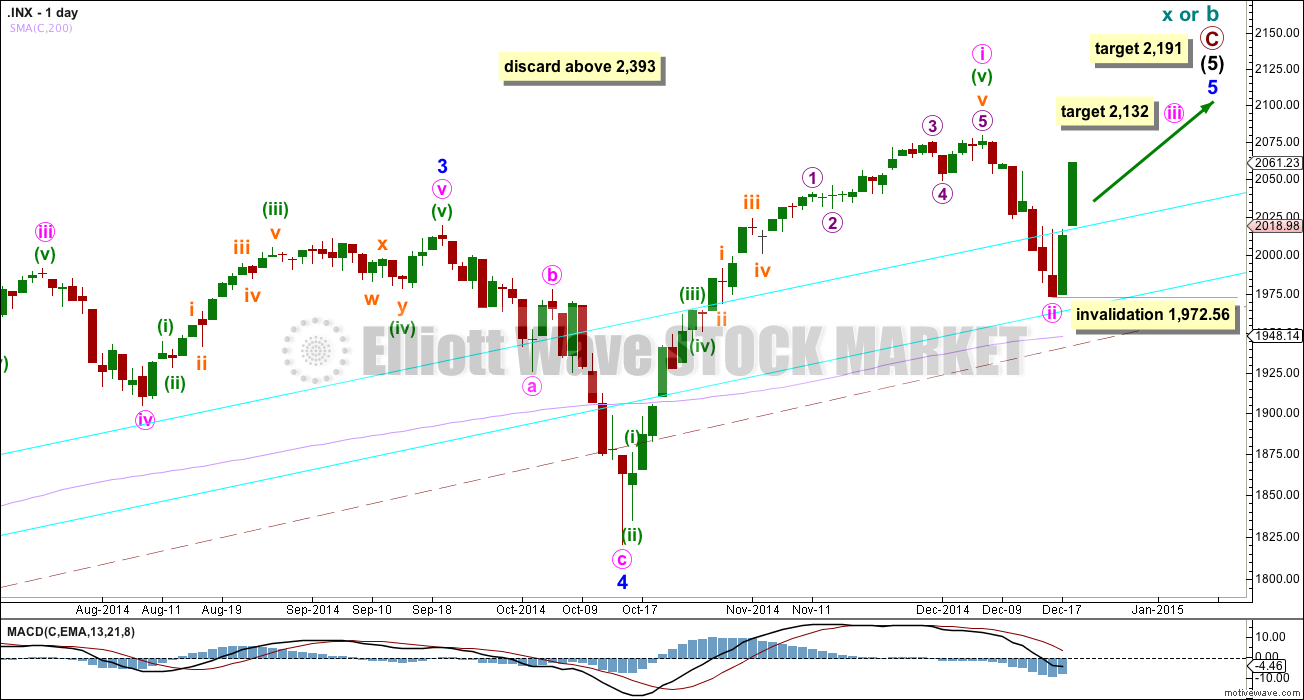
This bear wave count differs from the bull wave count at the monthly chart level and at super cycle wave degree. To see the historic picture go here.
The subdivisions within primary waves A-B-C are seen in absolutely exactly the same way as primary waves 1-2-3 for the bull wave count. Thus targets and invalidation points for the mid term are exactly the same. The structure on the hourly chart is also the same. These wave counts do not diverge, and they probably will not for months yet.
At cycle degree wave b is over the maximum common length of 138% the length of cycle wave a, at 164% the length of cycle wave a. At 2,393 cycle wave b would be twice the length of cycle wave a and at that point this bear wave count should be discarded.
While we have no confirmation of this wave count we should assume the trend remains the same, upwards. This wave count requires confirmation before I have confidence in it.
This analysis is published about 06:19 p.m. EST.