
Yesterday’s Elliott wave analysis expected a little more downwards movement to 1,958 before a trend change. This is not what happened. Price has moved higher.
Summary: The wave counts now diverge. A new high above 2,034.17 would confirm the bull market is intact. Alternatively, if we see a new low below 1,972.56 we would have first indication that the trend change is more sizeable, and the S&P may be in the early stages of a primary degree correction or a new downwards trend at cycle degree (a huge market crash).
Click on charts to enlarge.
Bull Wave Count
I will favor neither the bull or bear wave count. Both are viable and both expect this current upwards impulse may again be complete.
To see a weekly chart with subdivisions and how to draw trend lines and channels click here.
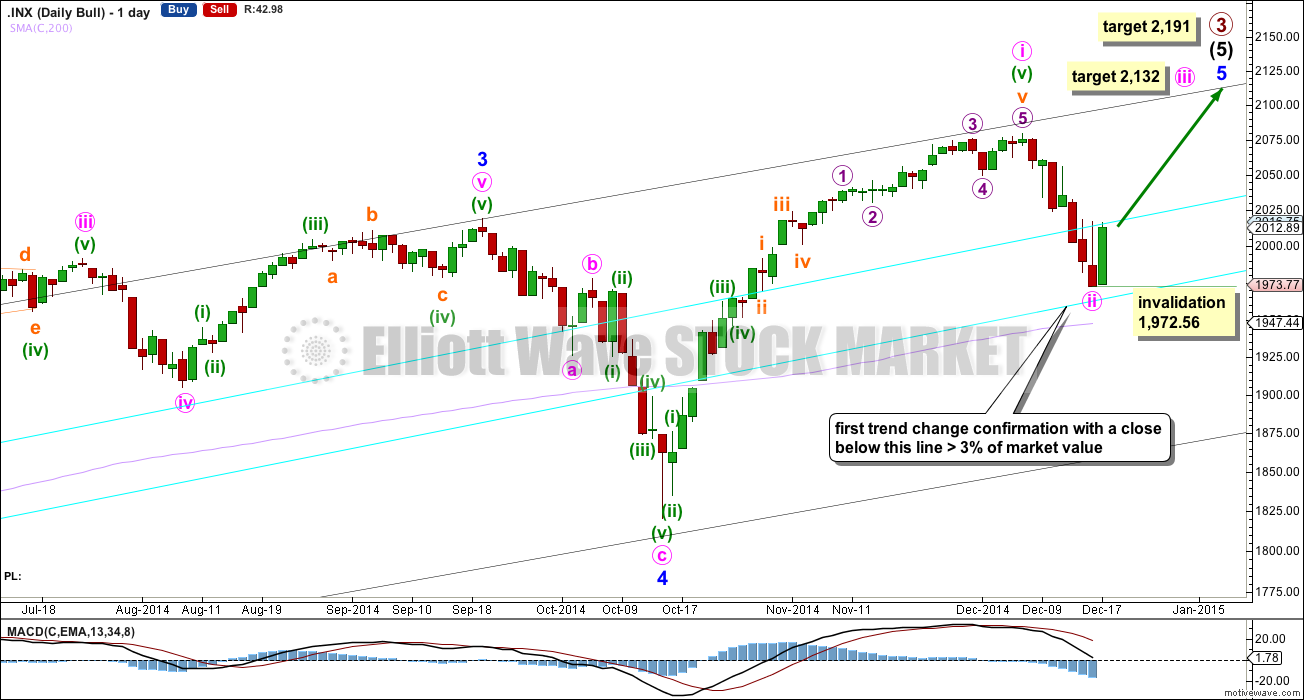
Upwards movement from the low at 666.79 subdivides as a complete 5-3-5. For the bull wave count this is seen as primary waves 1-2-3.
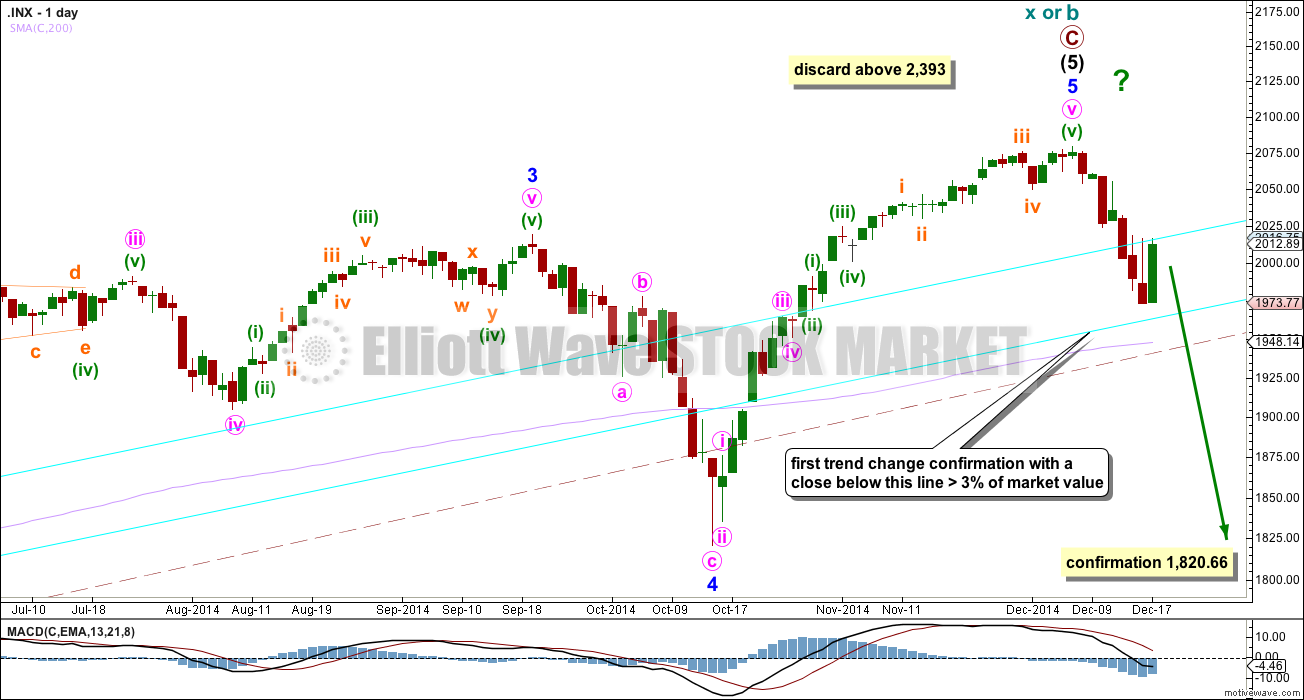
Within intermediate wave (5) minor wave 2 is an expanded flat and minor wave 4 is a zigzag. Minor wave 3 is 14.29 points longer than 1.618 the length of minor wave 1.
At intermediate degree there is also a very close relationship between intermediate waves (3) and (1): intermediate wave (3) is just 0.76 points less than 2.618 the length of intermediate wave (1).
The aqua blue trend lines are traditional technical analysis trend lines. These lines are long held, repeatedly tested, and shallow enough to be highly technically significant. When the lower of these double trend lines is breached by a close of 3% or more of market value that should indicate a trend change. It does not indicate what degree the trend change should be though. For the main bull wave count it looks like minute wave ii may have ended just short of the lower aqua blue trend line, if this wave count is correct this would give it a typical look. For the alternate bull wave count (the second hourly chart below) I would expect this lower trend line to be breached by more than 3% of market value at the close.
There is still triple technical divergence between MACD and price at the weekly chart level.
Because we should assume the trend remains the same until proven otherwise, while price remains above both aqua blue trend lines I will assume this downwards movement is a smaller correction within the upwards trend. Minute wave ii would very likely be over and this main wave count now expects a third wave up. At 2,132 minute wave iii would reach 0.618 the length of minute wave i.
At 2,191 primary wave 3 would reach 1.618 the length of primary wave 1. This would expect that minor wave 5 is either an ending contracting diagonal (minute wave i would be seen as a zigzag, which is possible) or within minor wave 5 minute wave iii will be shorter than minute wave i, and minute wave v will be shorter still. Both these scenarios are possible. Or the target is wrong.
Main Hourly Wave Count
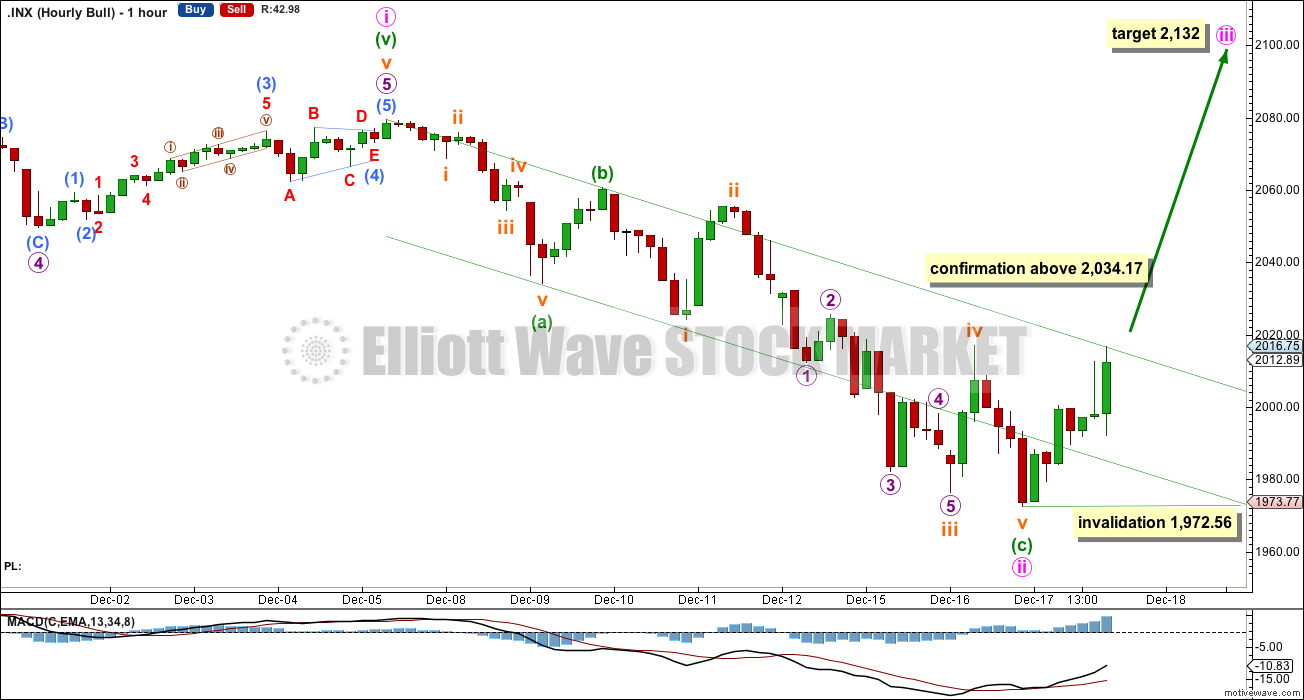
There is now a complete 5-3-5 downwards. This would be minute wave ii complete as a zigzag if this most bullish wave count is correct. If we see movement above 2,034.17 tomorrow this bull wave count would be confirmed.
Within the third wave no second wave correction may move beyond the start of its first wave below 1,972.56.
Alternate Hourly Wave Count
To have confidence in a trend change at primary degree (or for the bear count at cycle degree) I now want to see the following things (probably in this order):
1. A new low below 1,972.56.
2. A clear five down on the daily chart.
3. A breach of the lower aqua blue trend line by a close of more than 3% of market value.
4. A new low below 1,820.66.
Following that it should be the structure which shows which wave count is correct: bull or bear.
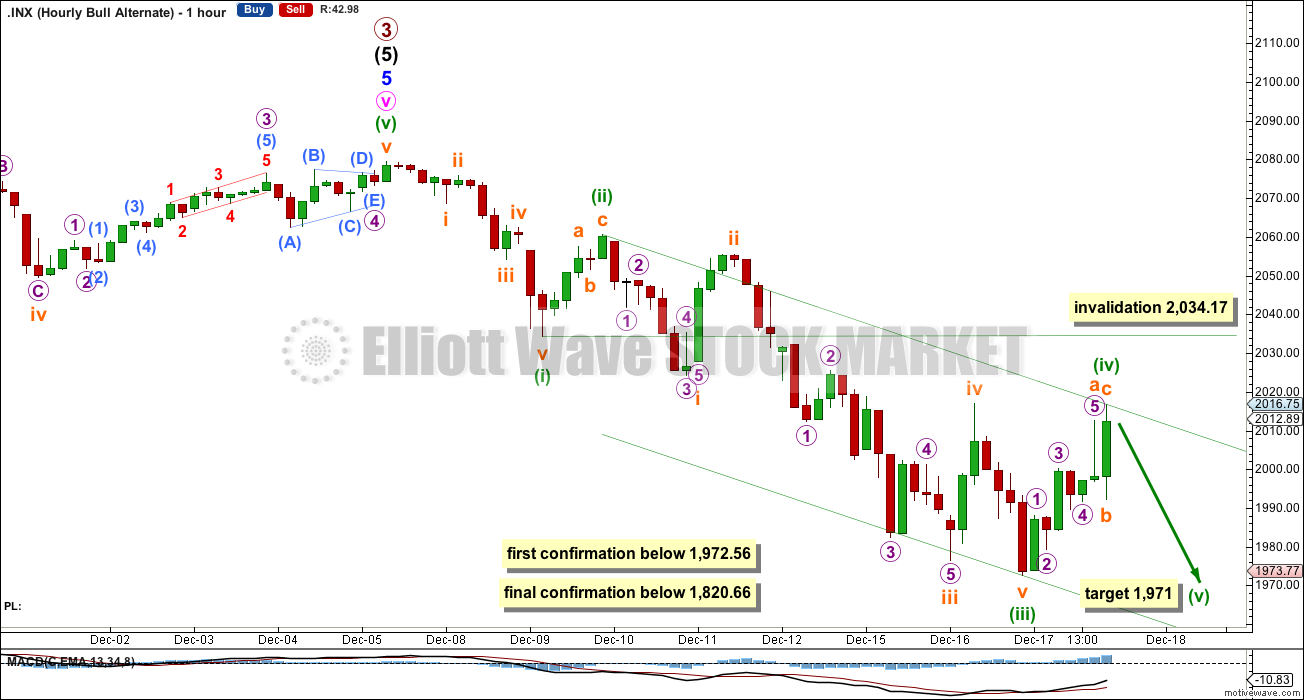
With a complete 5-3-5 downwards this may be waves (i), (ii) and (iii) of an unfolding impulse. A-B-C and 1-2-3 subdivide in exactly the same way. The wave counts now diverge.
This more bearish wave count now expects to see a fifth wave down. Minuette wave (iv) may not move back into minuette wave (i) price territory above 2,034.17.
There is no Fibonacci ratio between minuette waves (iii) and (i). This makes it more likely we should see a Fibonacci ratio for minuette wave (v) to either of (iii) or (i). At 1,971 minuette wave (v) would reach equality in length with minuette wave (i). This is the most common relationship for a fifth wave so this target has the highest probability. It would see minuette wave (v) just avoid a truncation.
If we see a new low below 1,972 tomorrow the main bull wave count would be invalidated. At that stage there would remain an outside possibility that minute wave ii is still unfolding, but the probability would be so very low because it would have to continue well below the lower aqua blue trend line. At that stage this wave count would probably be my main wave count and I would have an alternate which looked at the possibility that minute wave ii is continuing.
Draw a channel about this downwards movement using Elliott’s second technique. Look for the lower green trend line to provide support. The fifth wave may end midway within the channel, this is common for the S&P.
Bear Wave Count
This bear wave count differs from the bull wave count at the monthly chart level and at super cycle wave degree. To see the historic picture go here.
The subdivisions within primary waves A-B-C are seen in absolutely exactly the same way as primary waves 1-2-3 for the bull wave count.
At cycle degree wave b is over the maximum common length of 138% the length of cycle wave a, at 164% the length of cycle wave a. At 2,393 cycle wave b would be twice the length of cycle wave a and at that point this bear wave count should be discarded.
At this point in time it is again possible that the market has recently turned and is beginning a big crash. A new low below 1,370.58 would provide price confirmation of a market crash, but we should have confidence in this wave count well before that point by looking carefully at structure.
While we have no confirmation of this wave count we should assume the trend remains the same, upwards. This wave count requires confirmation before I have confidence in it.
This analysis is published about 07:17 p.m. EST.