
Upwards movement was expected.
Summary: A small ending contracting diagonal may be unfolding for the final fifth wave up. The target for it to end, probably on Monday, is at 1,281.
Click on charts to enlarge.
Bull Wave Count
I will favour neither the bull or bear wave count. Both are viable and both expect this current upwards impulse may again be close to completion.
To see a weekly chart with subdivisions and how to draw trend lines and channels click here.
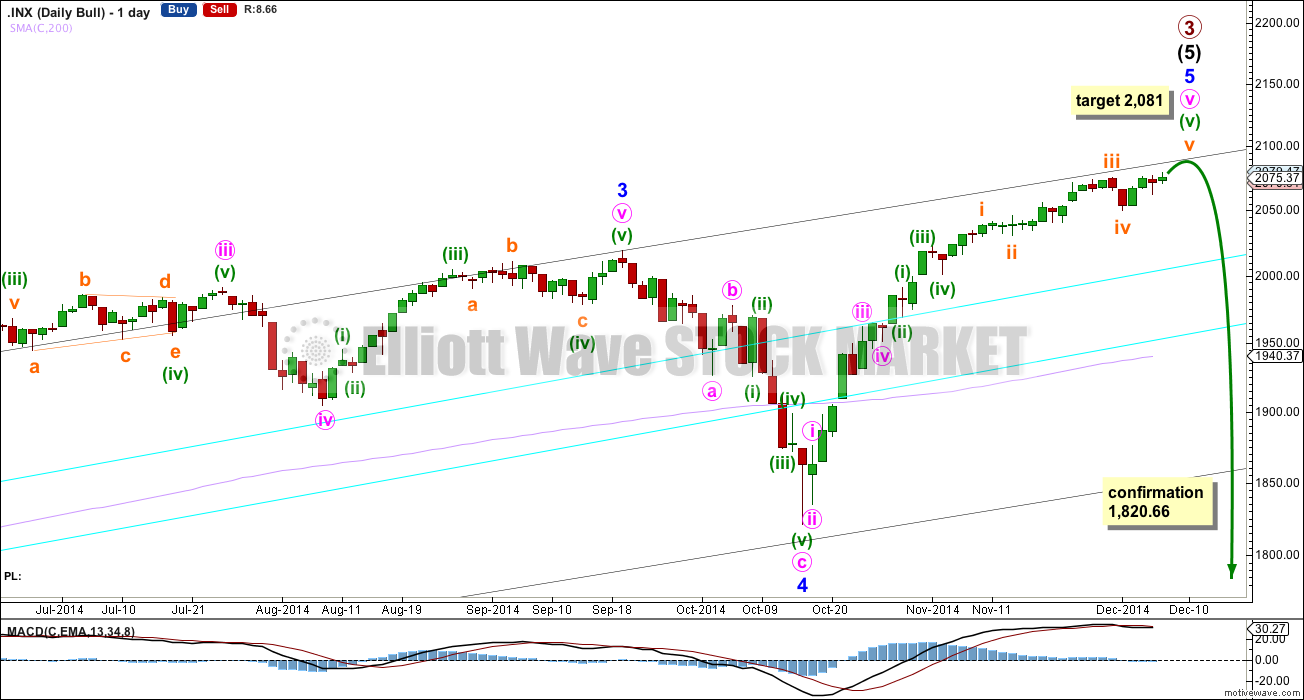
Upwards movement from the low at 666.79 subdivides as an almost complete 5-3-5. For the bull wave count this is seen as primary waves 1-2-3.
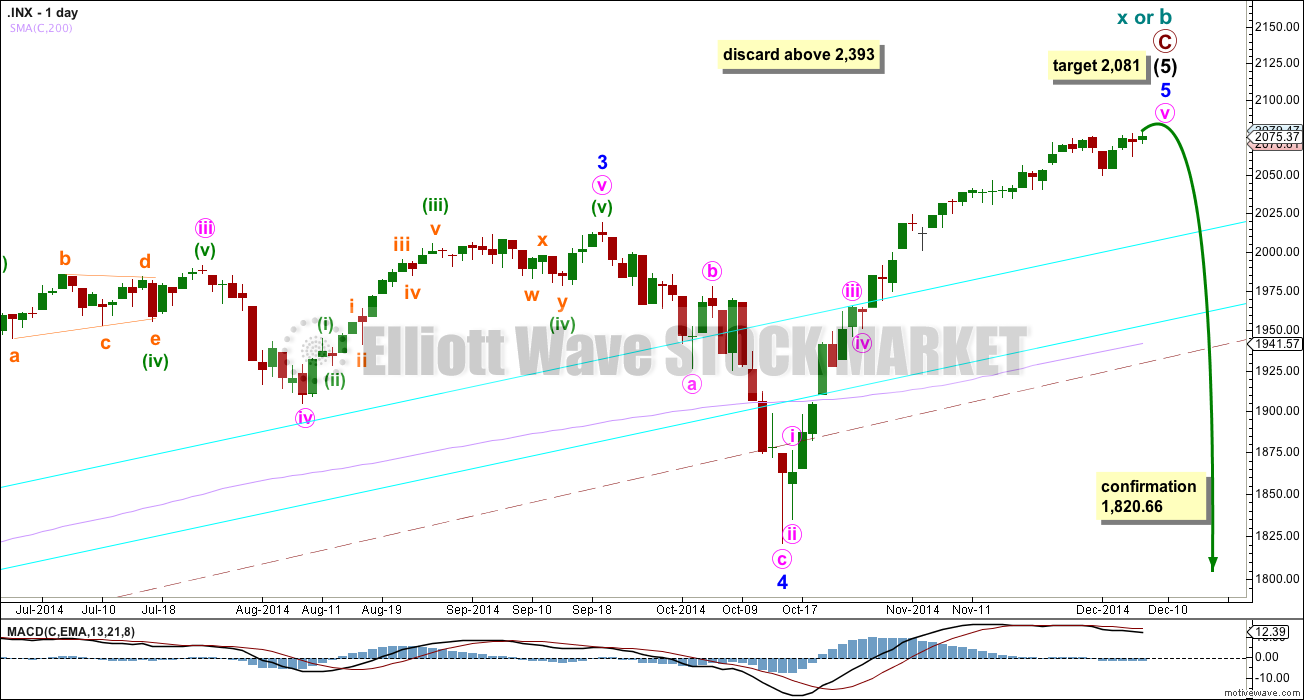
Within intermediate wave (5) minor wave 2 is an expanded flat and minor wave 4 is a zigzag. Minor wave 3 is 14.29 points longer than 1.618 the length of minor wave 1.
At intermediate degree there is also a very close relationship between intermediate waves (3) and (1): intermediate wave (3) is just 0.76 points less than 2.618 the length of intermediate wave (1).
The aqua blue trend lines are traditional technical analysis trend lines. These lines are long held, repeatedly tested, and shallow enough to be highly technically significant. When the lower of these double trend lines is breached by a close of 3% or more of market value that should indicate a trend change. It does not indicate what degree the trend change should be though.
There is still triple technical divergence between MACD and price at the weekly chart level.
I would expect the final top to form a slow curving structure, like a double head and shoulders or a rounding top. At the high volume should be low. Once the high is in place the new downwards trend may begin with slow movement, and deep second wave corrections. These would form two right hand shoulders, or the right hand side of a rounding top. When the neckline is formed, and eventually broken I would not expect to see an increase in volume, but I would expect to see an increase in momentum.
Movement below 1,820.66 could not be a second wave correction within minor wave 5, and so at that stage the final fifth wave would have to be over. A trend change at primary (bull count) or cycle degree (bear count) would be confirmed.
Main Hourly Wave Count
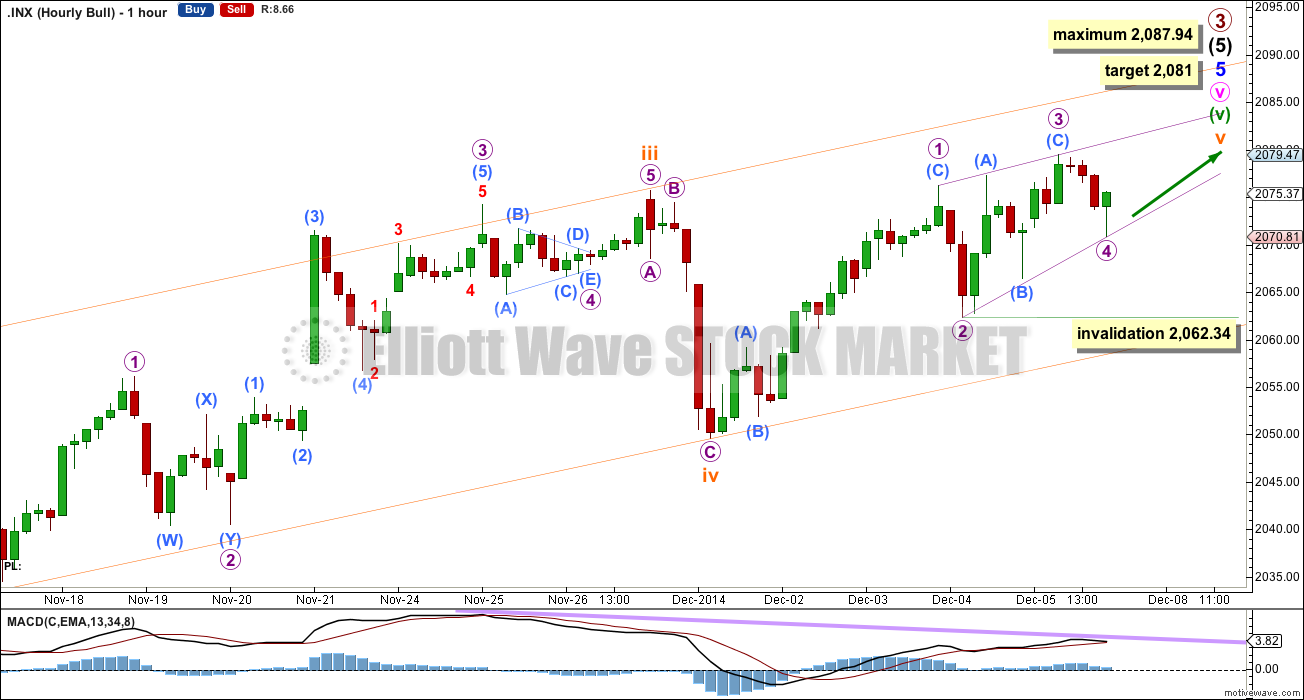
It looks now like subminuette wave v may be completing as an ending contracting diagonal.
Within an ending diagonal all the sub waves must subdivide as zigzags. This is the only structure where you will see a third wave labelled as anything other than an impulse.
The diagonal is contracting because micro wave 3 is shorter than micro wave 1, and micro wave 4 is shorter than micro wave 2. The fourth wave overlaps first wave price territory, as it should for a fourth wave within a diagonal. The rule for the end of a fourth wave of a diagonal is it may not move beyond the end of the second wave below 2,062.34.
The final fifth wave up is all that is now required to complete this structure. It is most likely to make a new high above the end of micro wave 3 at 2,079.47 to avoid a truncation. It must subdivide as a zigzag, and may not be longer than equality in length with micro wave 3 because micro wave 3 may not be the shortest wave. This maximum length for micro wave 5 would be reached at 2,087.94.
At 2,081 micro wave 5 would reach 0.618 the length of micro wave 3. About this point subminuette wave v would be close to 0.618 the length of subminuette wave iii, and minuette wave (v) would be close to 1.618 the length of minuette wave (iii). Rather than calculate a target zone for you I will calculate a target only at the lowest wave degree.
Micro wave 5 may end when price touches the upper violet 1-3 trend line of the diagonal, or it may slightly overshoot this line.
Alternate Hourly Wave Count
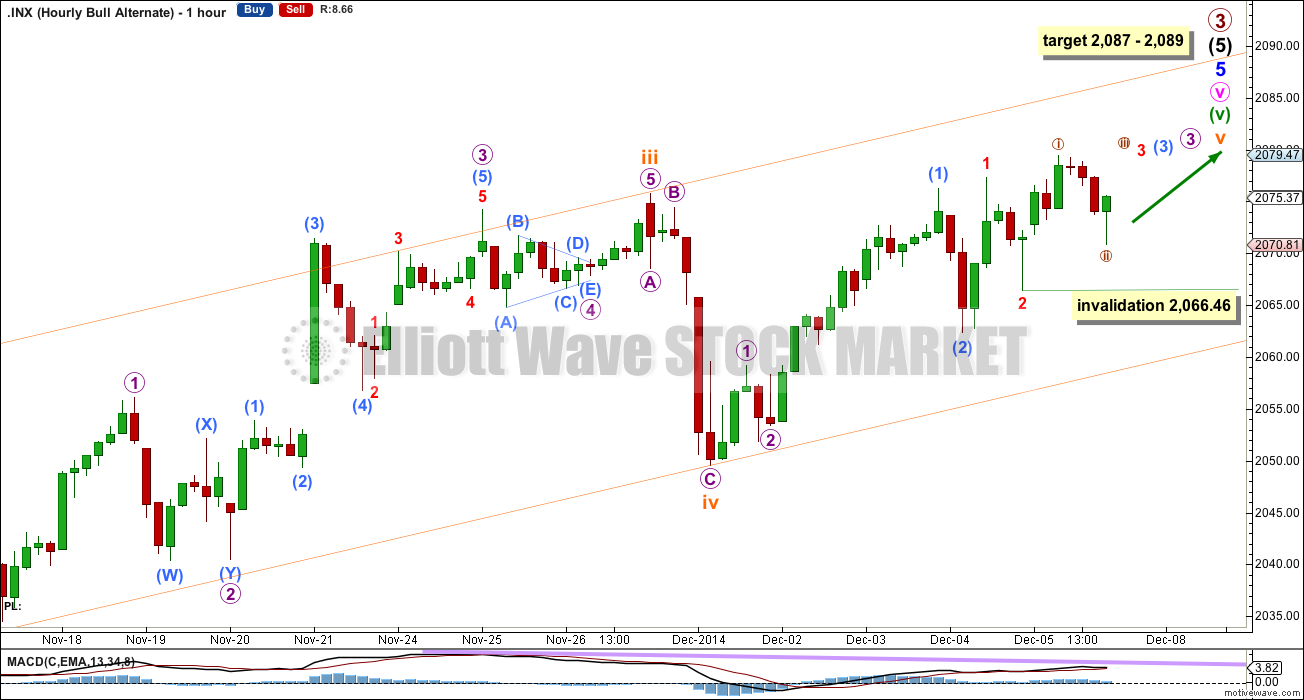
This alternate was the only hourly wave count for last analysis. It has reduced in probability today to an alternate. This hourly wave count expects a few more days at least of more upwards movement. The middle of a third wave must unfold upwards, and then a series of fourth wave corrections may not move back into their corresponding first wave price territories.
Within the middle of the third wave nano wave ii may not move beyond the start of nano wave i below 2,066.46.
Bear Wave Count
This bear wave count differs from the bull wave count at the monthly chart level and at super cycle wave degree. To see the historic picture go here.
The subdivisions within primary waves A-B-C are seen in absolutely exactly the same way as primary waves 1-2-3 for the bull wave count.
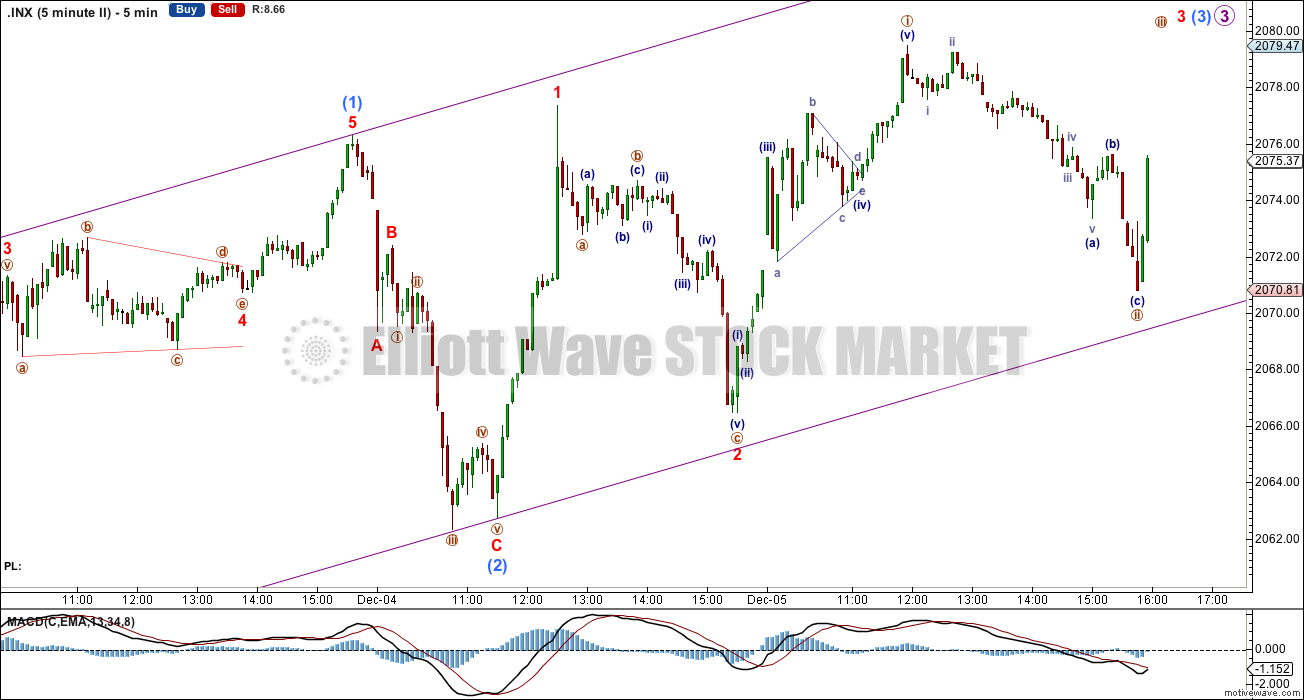
For both wave counts when minor wave 5 may be a complete structure on the hourly and five minute charts, I have an alternate wave count which moves the degree of labelling within it all down one degree. A completion of a five wave impulse up within minor wave 5 may be either minor wave 5 in its entirety, or it may only be minute wave i within minor wave 5.
At cycle degree wave b is over the maximum common length of 138% the length of cycle wave a, at 161% the length of cycle wave a. At 2,393 cycle wave b would be twice the length of cycle wave a and at that point this bear wave count should be discarded.
This analysis is published about 10:02 p.m. EST.