
Sideways movement in a very small range for Friday leaves both the main and alternate Elliott wave counts exactly the same.
Summary: A new high above 2,046.18 would confirm upwards movement should continue, and the first target is 2,049. If price keeps rising above this target the second target is 2,055. A new low below 2,025.07 would be the earliest indication of a trend change, but it does not tell us what degree the trend change may be.
Click on charts to enlarge.
Bull Wave Count
I will favour neither the bull or bear wave count. Both are viable and both expect this current upwards impulse may again be over or close to completion.
To see a weekly chart with subdivisions and how to draw trend lines and channels click here.
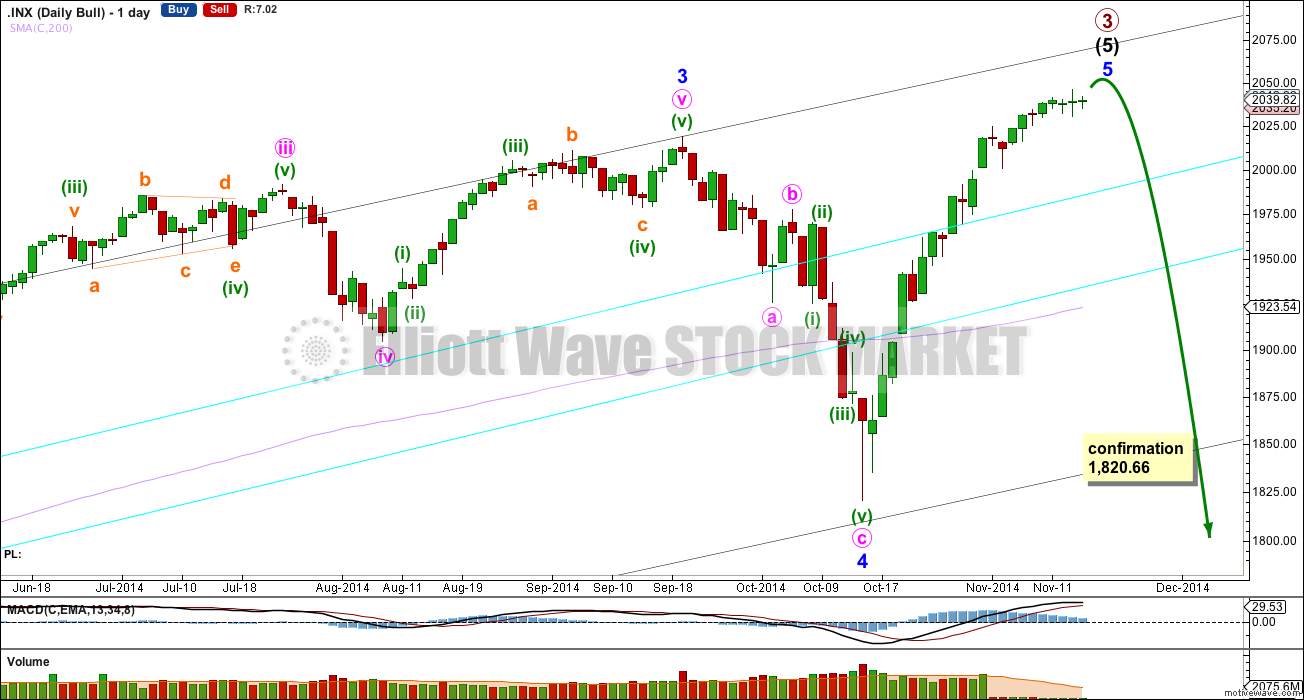
Upwards movement from the low at 666.79 subdivides as a complete 5-3-5. For the bull wave count this is seen as primary waves 1-2-3.
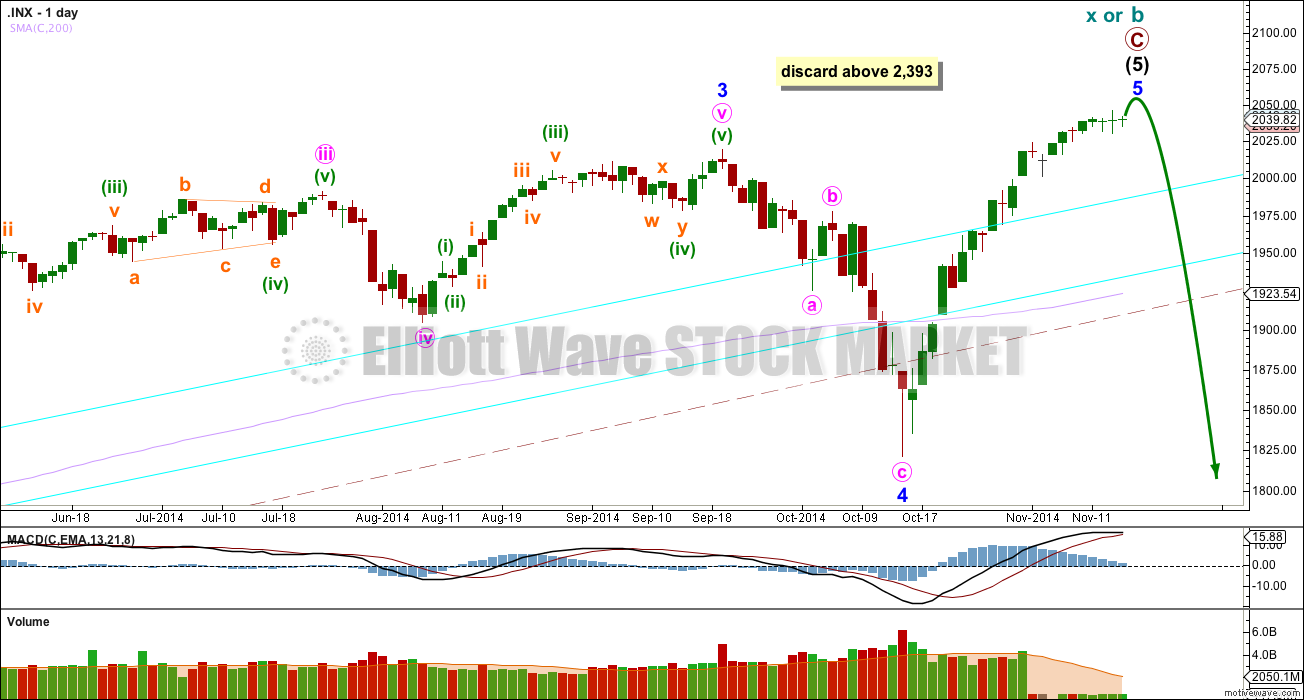
Within intermediate wave (5) minor wave 2 is an expanded flat and minor wave 4 is a zigzag. Minor wave 3 is 14.29 points longer than 1.618 the length of minor wave 1.
At intermediate degree there is also a very close relationship between intermediate waves (3) and (1): intermediate wave (3) is just 0.76 points less than 2.618 the length of intermediate wave (1).
The aqua blue trend lines are traditional technical analysis trend lines. These lines are long held, repeatedly tested, and shallow enough to be highly technically significant. When the lower of these double trend lines is breached by a close of 3% or more of market value that should indicate a trend change. It does not indicate what degree the trend change should be though.
There is still double technical divergence between MACD and price at the weekly chart level.
There is now no longer technical divergence between price and MACD at the daily chart level.
I would expect the final top to form a slow curving structure, like a double head and shoulders or a rounding top. At the high volume should be low. If the data from Google/Yahoo data feed is correct then for the last ten days volume has been quite low. This may be indicative of a high forming. Once the high is in place the new downwards trend may begin with slow movement, and deep second wave corrections. These would form two right hand shoulders, or the right hand side of a rounding top. When the neckline is formed, and eventually broken I would not expect to see an increase in volume, but I would expect to see an increase in momentum.
Movement below 1,820.66 could not be a second wave correction within minor wave 5, and so at that stage the final fifth wave would have to be over. A trend change at primary (bull count) or cycle degree (bear count) would be confirmed.
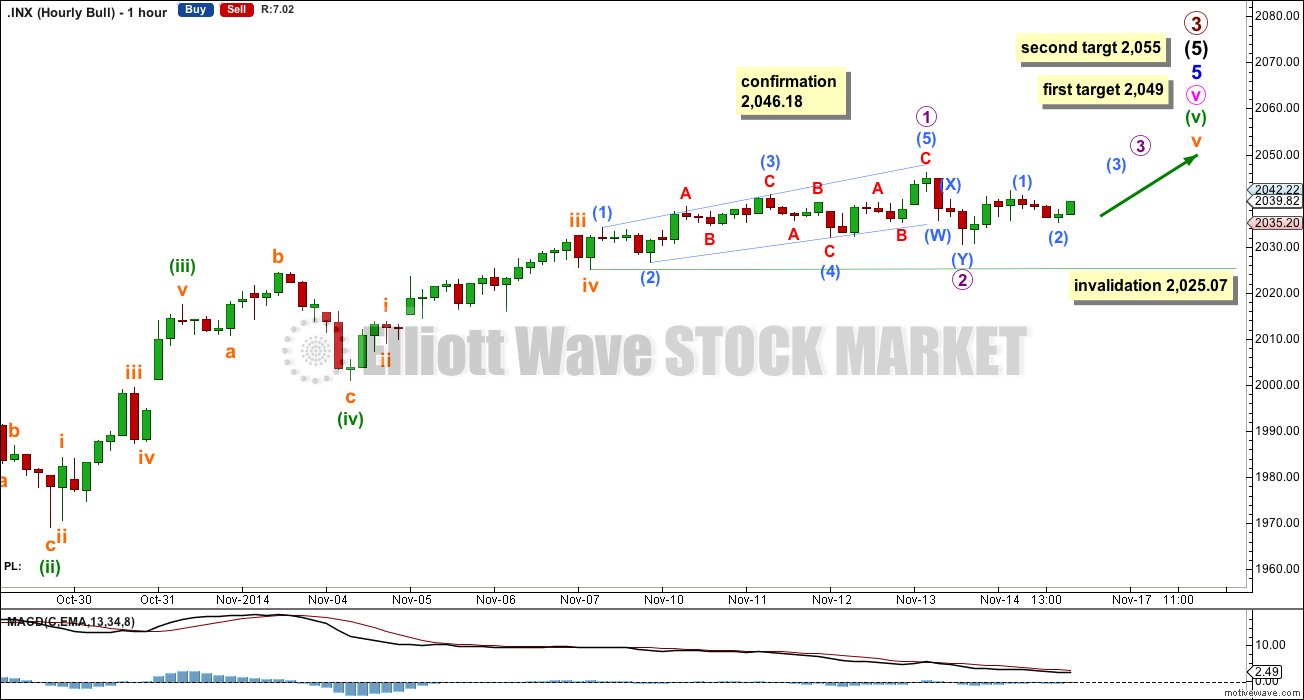
Main Bull Hourly Wave Count
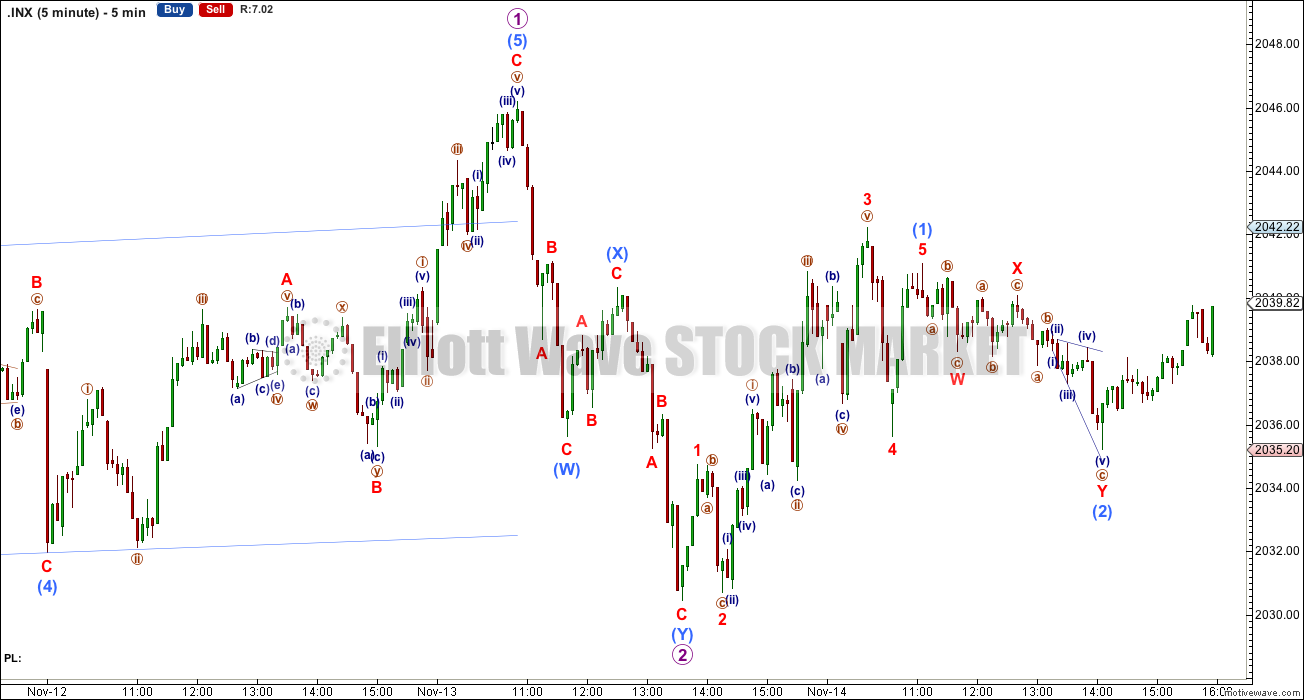
At the five minute chart level sub micro wave (1) ends with a truncated fifth wave. This sideways movement looks very corrective, and is very difficult to analyse. It may be a continuation of micro wave 2 or it may be the start of micro wave 3 as labelled. The invalidation point must remain at 2,025.07 for this reason.
Movement above 2,046.18 would invalidate the alternate bull hourly wave count below and confirm this main hourly wave count.
At 2,049 minuette wave (v) would reach equality in length with minuette wave (iii). If price keeps going up through this first target then the next expectation may be at 2,055 where minuette wave (v) would reach 1.618 the length of minuette wave (i).
The lower target expects a short micro wave 3, a shallow micro wave 4, and an even shorter micro wave 5. The lower target may not provide enough room for this structure to complete though, and so the second target may be more likely.
Within subminuette wave v micro wave 2 may not move beyond the start of micro wave 1 below 2,025.07.
Again when the structure of minor wave 5 may be a complete five wave impulse then I will have a wave count which moves the degree of labelling within minor wave 5 all down one degree. The next movement down may be only minute wave ii within an extending minor wave 5. Or it may be the start of primary wave 4. The structure of the first wave down will tell which of these two scenarios is correct: minute wave ii should subdivide as a three and the first move of primary wave 4 should subdivide as a five.
Alternate Bull Hourly Wave Count
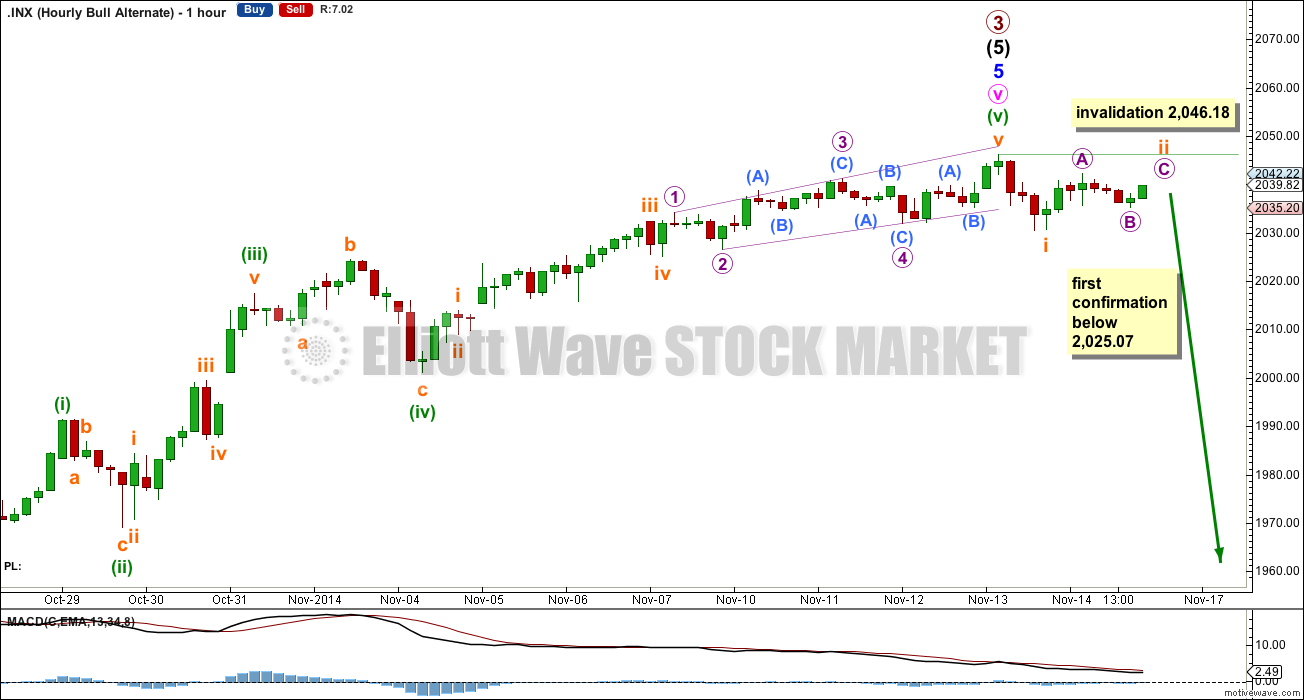
By simply moving the diagonal structure up one degree it may be subminuette wave v in its entirety, and minor wave 5 may be over.
This alternate also has a truncation at the five minute chart level. If subminuette wave i is a complete impulse then it must have ended with a slightly truncated fifth wave. Subminuette wave ii is likely incomplete and may begin Monday with a little upwards movement.
Minuette wave (iii) has no Fibonacci ratio to minuette wave (i), and now minuette wave (v) is 3.24 points short of equality with minuette wave (iii).
A new low below 2,025.07 would confirm a trend change.
At that stage this would be my alternate wave count. The main wave count would expect downward movement to be minute wave ii as described in the main hourly wave count above.
Bear Wave Count
This bear wave count differs from the bull wave count at the monthly chart level and at super cycle wave degree. To see the historic picture go here.
The subdivisions within primary waves A-B-C are seen in absolutely exactly the same way as primary waves 1-2-3 for the bull wave count.
For both wave counts now that minor wave 5 may be a complete structure on the hourly and five minute charts, I have an alternate wave count which moves the degree of labelling within it all down one degree. A completion of a five wave impulse up within minor wave 5 may be either minor wave 5 in its entirety, or it may only be minute wave i within minor wave 5.
At cycle degree wave b is over the maximum common length of 138% the length of cycle wave a, at 159% the length of cycle wave a. At 2,393 cycle wave b would be twice the length of cycle wave a and at that point this bear wave count should be discarded.
This analysis is published about 04:08 p.m. EST.