
A green candlestick was expected for Tuesday, which is what happened.
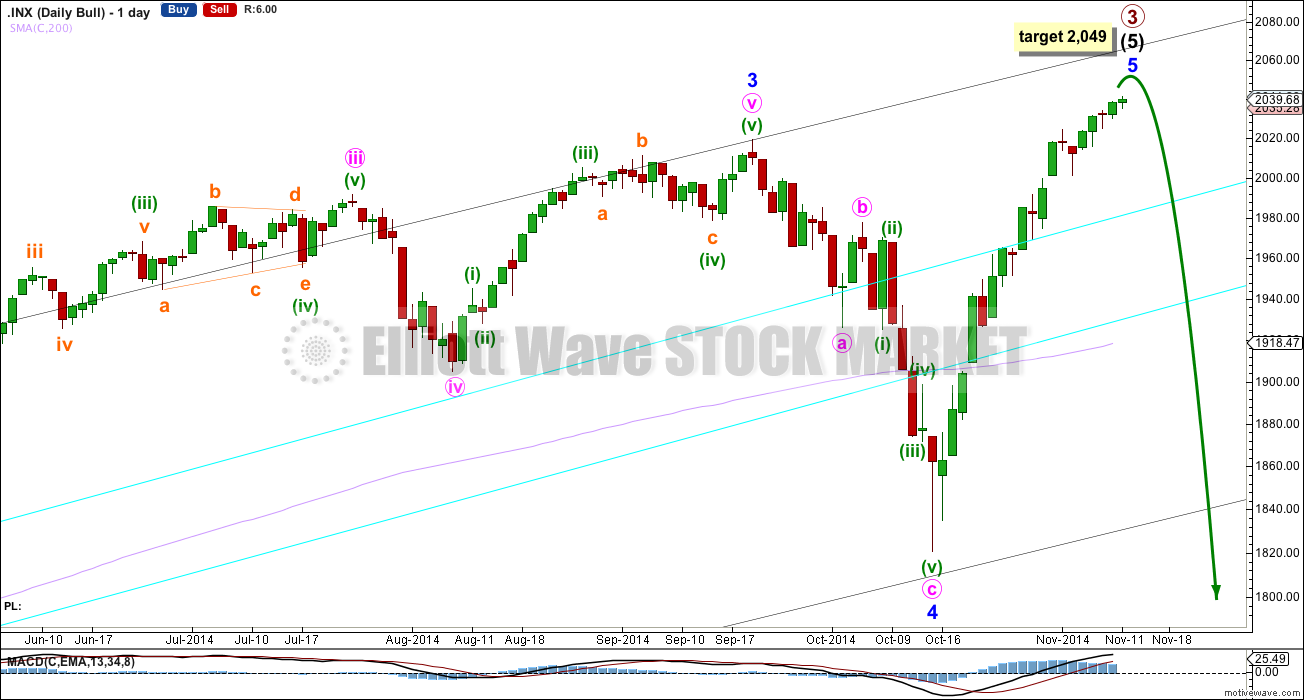
Summary: The target for upwards movement to end is 2,049. This may be met in one to two days.
Click on charts to enlarge.
Bull Wave Count
I will favour neither the bull or bear wave count. Both are viable and both expect this current upwards impulse is almost over.
To see a weekly chart with subdivisions and how to draw trend lines and channels click here.
Upwards movement from the low at 666.79 subdivides as an almost complete 5-3-5. For the bull wave count this is seen as primary waves 1-2-3.
Within intermediate wave (5) minor wave 2 is an expanded flat and minor wave 4 is a zigzag. Minor wave 3 is 14.29 points longer than 1.618 the length of minor wave 1.
At intermediate degree there is also a very close relationship between intermediate waves (3) and (1): intermediate wave (3) is just 0.76 points less than 2.618 the length of intermediate wave (1).
The aqua blue trend lines are traditional technical analysis trend lines. These lines are long held, repeatedly tested, and shallow enough to be highly technically significant. When the lower of these double trend lines is breached by a close of 3% or more of market value that should indicate a trend change. It does not indicate what degree the trend change should be though.
There is still double technical divergence between MACD and price at the weekly chart level.
There is now no longer technical divergence between price and MACD at the daily chart level.

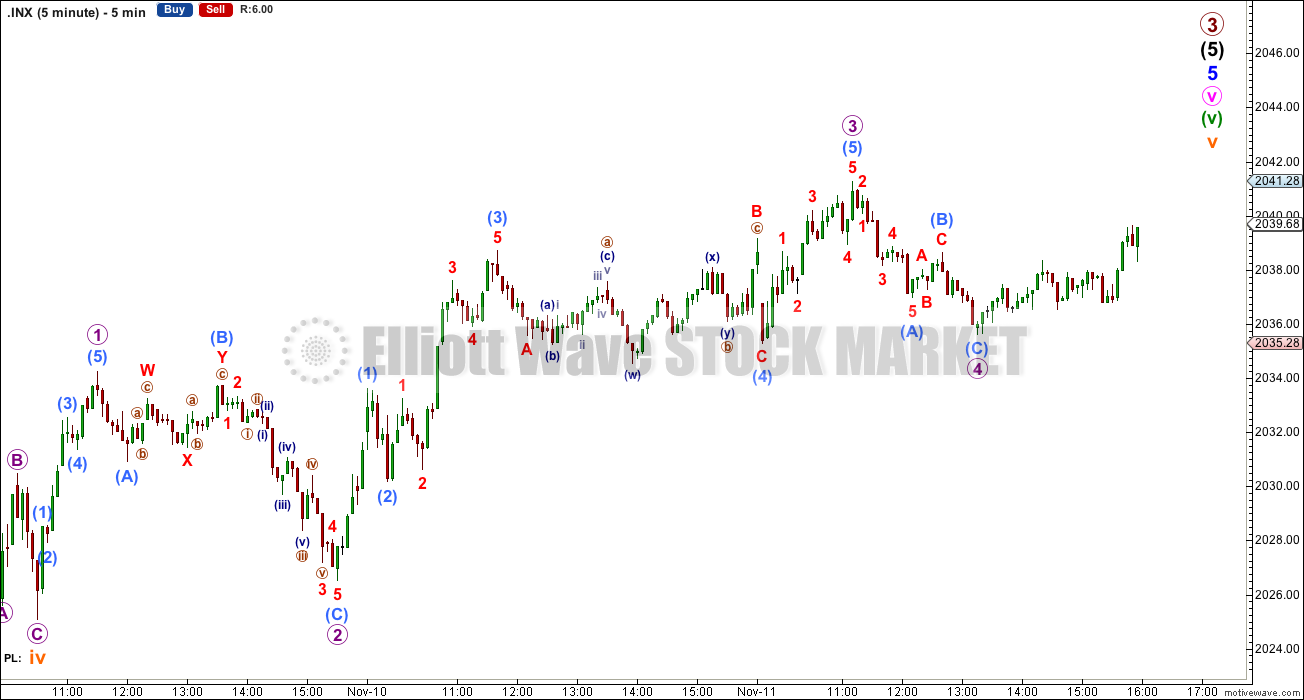
Within minor wave 5 there is already a close Fibonacci ratio at minute degree: minute wave iii is just 0.38 longer than 2.618 the length of minute wave i.
With close Fibonacci ratios already at intermediate, minor and minute degree, the target is best calculated at minuette wave degree. There is no Fibonacci ratio between minuette waves (iii) and (i). Minuette wave (v) has now passed equality in length with minuette wave (i). The next expectation may be where it reaches equality in length with minuette wave (iii) at 2,049. This target may be met tomorrow.
Within minuette wave (v) subminuette wave iii is 2.12 points longer than 1.618 the length of subminuette wave i. I would not expect to see a Fibonacci ratio between subminuete wave v and either of i or iii.
Within subminuette wave v micro wave 3 is just 0.10 points short of 1.618 the length of micro wave 1. I would not expect to see a Fibonacci ratio at micro degree, so I will leave the target calculation at minuette wave degree only.
Again the channel about this fifth wave is breached, but not by downwards movement. This slowing and curving towards the eventual high is typical behaviour from the S&P. I have drawn a best fit channel about this final fifth wave.
If micro wave 4 continues it may not move into micro wave 1 price territory below 2,034.26. Once micro wave 5 may be seen as a complete five wave structure on the five minute chart then subsequent movement below 2,034.26 would be earliest indication of a possible trend change. At that stage downwards movement could not be a fourth wave correction and so the final fifth wave of subminuette wave v would have to be over.
Bear Wave Count
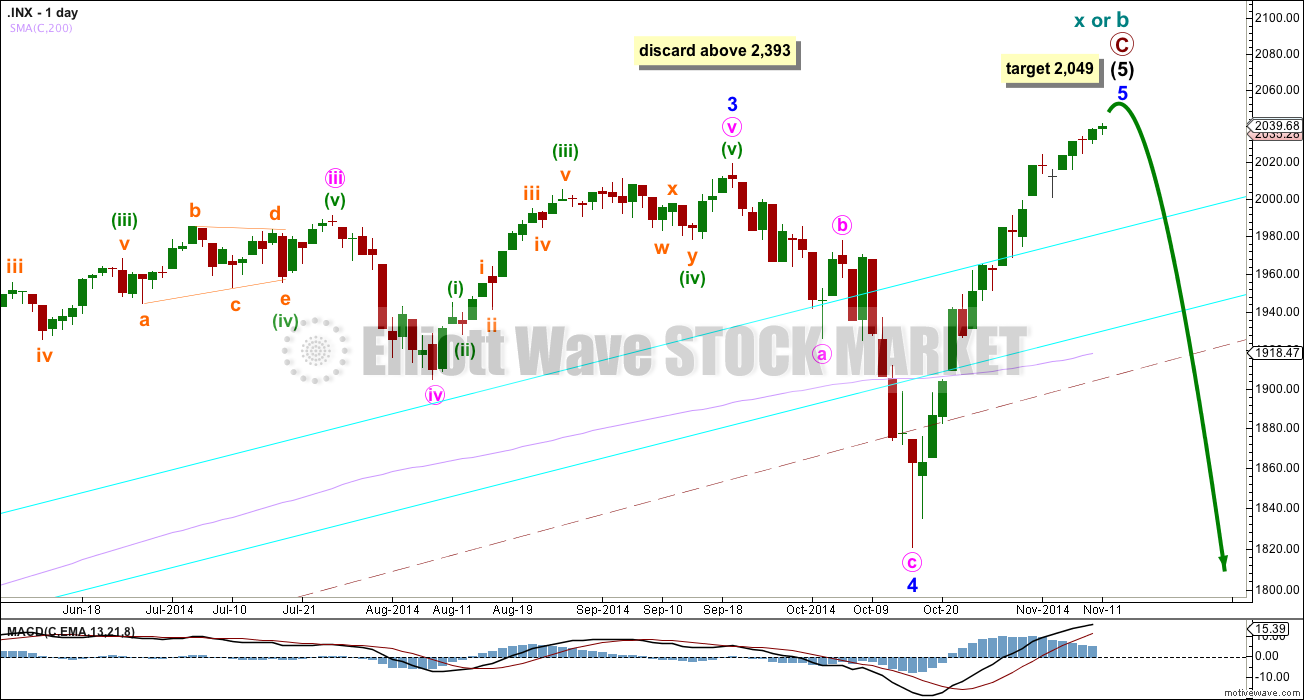
This bear wave count differs from the bull wave count at the monthly chart level and at super cycle wave degree. To see the historic picture go here.
The subdivisions within primary waves A-B-C are seen in absolutely exactly the same way as primary waves 1-2-3 for the bull wave count.
For both wave counts when minor wave 5 is a complete structure on the hourly and five minute charts then I will have an alternate wave count which moves the degree of labelling within it all down one degree. A completion of a five wave impulse up within minor wave 5 may be either minor wave 5 in its entirety, or it may only be minute wave i within minor wave 5. This is why I am leaving the invalidation point at 1,820.66.
At cycle degree wave b is over the maximum common length of 138% the length of cycle wave a, at 157% the length of cycle wave a. At 2,393 cycle wave b would be twice the length of cycle wave a and at that point this bear wave count should be discarded.
This analysis is published about 04:51 p.m. EST.