
Downwards movement remained above the invalidation point on the Elliott wave hourly chart. The structure is slightly changed and the target is recalculated. I am swapping the bull and bear wave counts over again, although I would prefer to not favour one or the other at this stage. Both have the same target and both expect a trend change soon. The degree of trend change is only one degree.
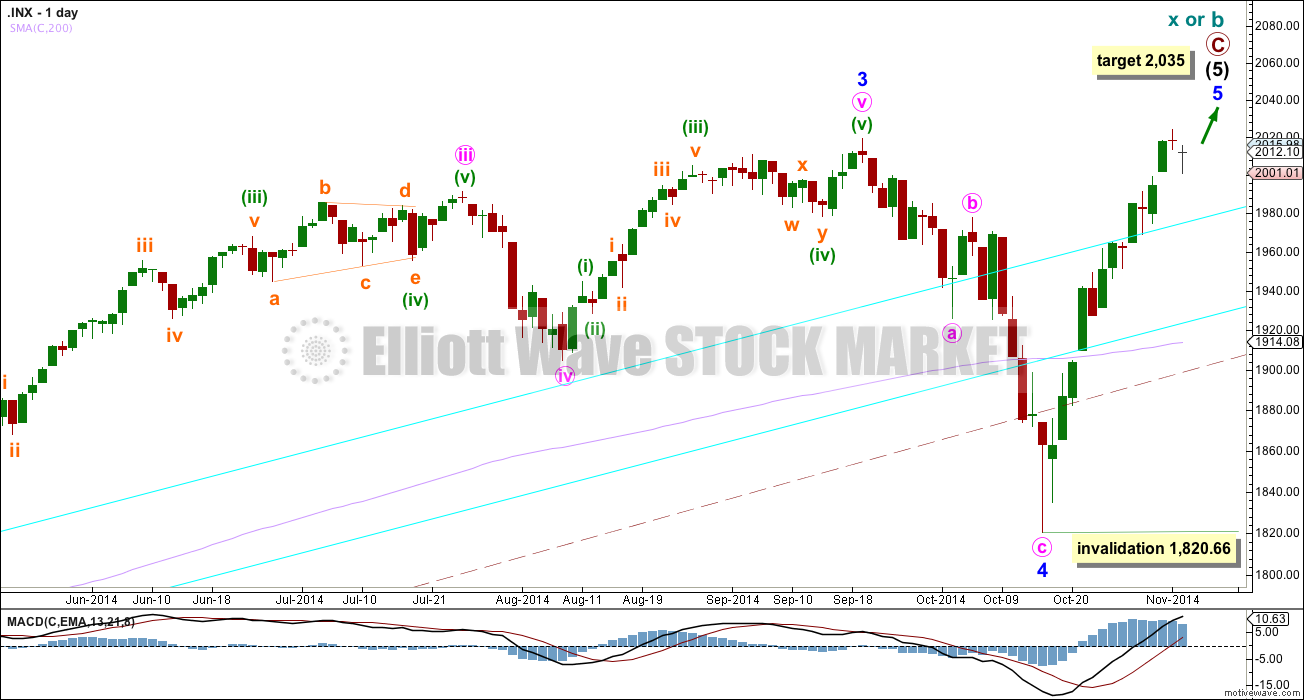
Summary: The target for this upwards movement to end is at 2,035.
Click on charts to enlarge.
Bull Wave Count
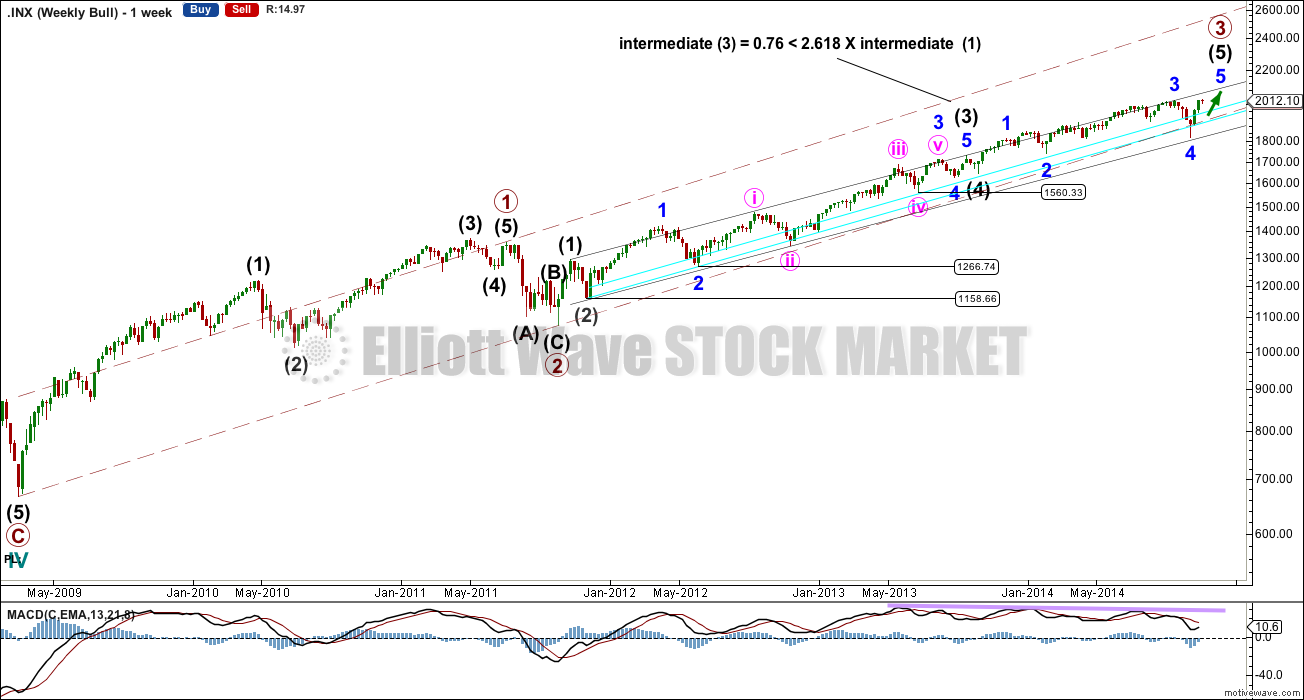
I will again publish the weekly chart to show the subdivisions within primary wave 3 and trend lines.
Upwards movement from the low at 666.79 subdivides as an almost complete 5-3-5. For the bull wave count this is seen as primary waves 1-2-3.
The maroon – – – channel is a base channel drawn about primary waves 1 and 3. Downwards corrections within primary wave 3 should find strong support at the lower edge of this channel. Primary wave 3 should find the power to break through the upper edge of this channel (although historically third waves at primary degree do not always do this to base channels). For the first time in 5 years the lower edge of this channel has been slightly breached.
Within primary wave 3 intermediate wave (3) is a perfectly complete impulse, this contains the strongest upwards momentum, and it is just 0.76 points less than 2.618 the length of intermediate wave (1). I am very confident the labelling of a third wave as over there is correct.
Within intermediate wave (5) minor wave 2 is an expanded flat and minor wave 4 is a zigzag. Minor wave 3 is 14.29 points longer than 1.618 the length of minor wave 1.
The aqua blue trend lines are traditional technical analysis trend lines, I have shown specific price points on which to draw them. Draw the lower trend line first, then place a parallel copy higher up as shown. These lines are long held, repeatedly tested and shallow enough to be highly technically significant. The recent breach was of just over 4% of market value, but my mistake in interpretation of this breach was to calculate it using the low of 15th October, 2014, and not the CLOSE of 15th October, 2014. If the breach is calculated with the close of that date it is just under 2% of market value.
I will not make that same mistake again.
I will keep these trend lines in place as they should still indicate when we have a trend change, when the lower one is breached by a close of 3% or more of market value.
Draw a channel about primary wave 3 using Elliott’s first technique (the black channel): draw the first trend line from the highs labelled intermediate waves (1) to (3), then place a parallel copy on the low labelled intermediate wave (2). This lower trend line nicely shows where the last correction for minor wave 4 found support.
Copy all trend lines and channels over carefully to daily charts on semi log scales.
There is now double technical divergence between MACD and price at the weekly chart level.
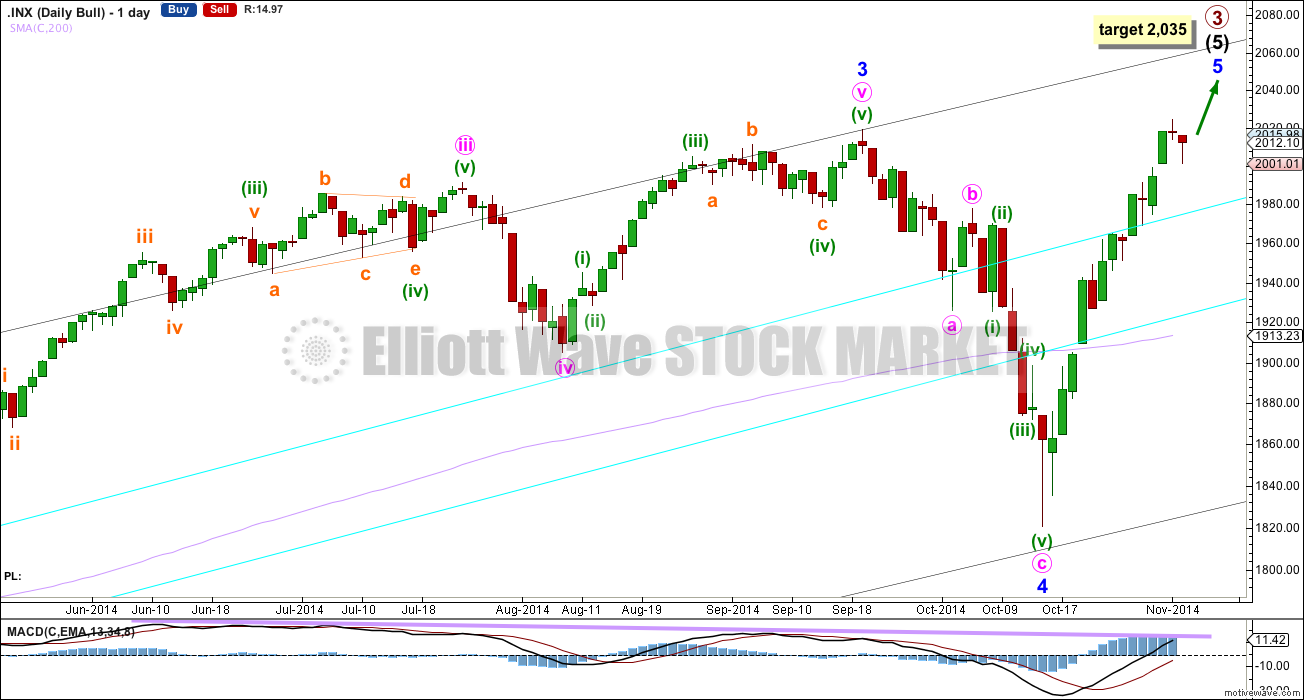
There is also technical divergence between price and MACD at the daily chart level.
Within minor wave 5 no second wave correction may move beyond the start of its first wave below 1,820.66.
If price reaches up that high there may be resistance at the upper edge of the black channel.
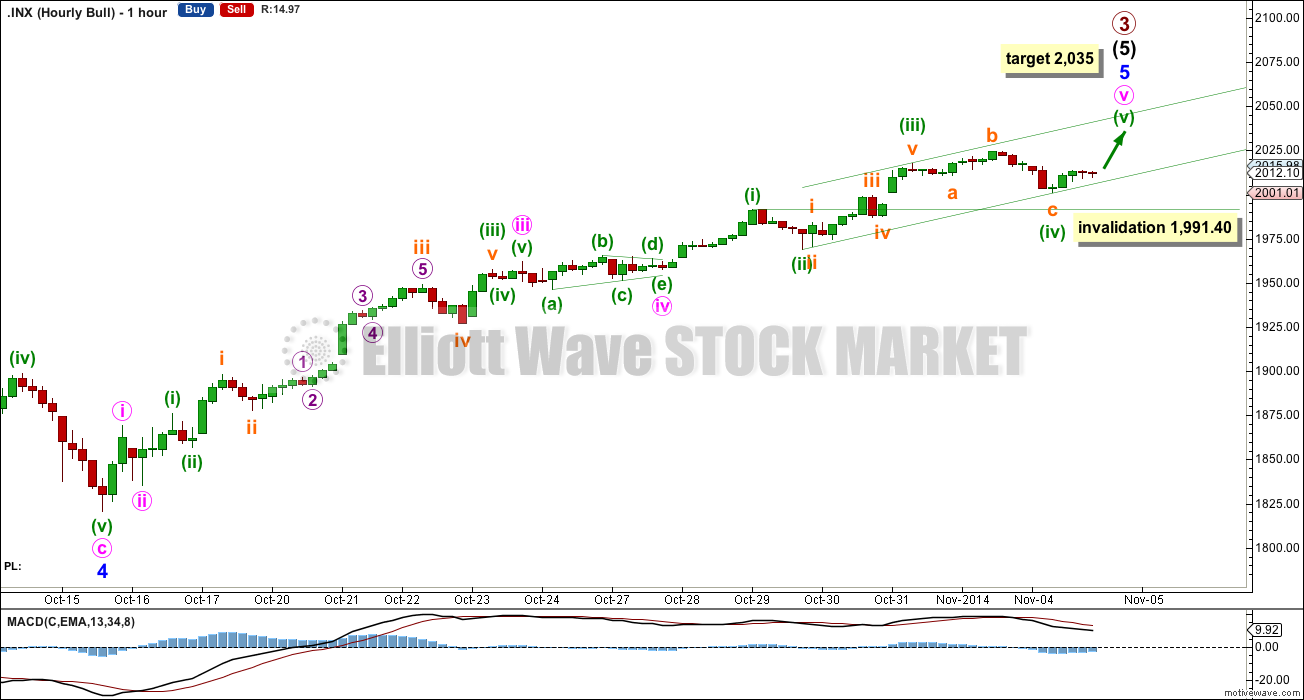
Sideways and lower movement looks like it is minuette wave (iv) continuing. It is now longer in duration that minuette wave (ii) and so it should be over.
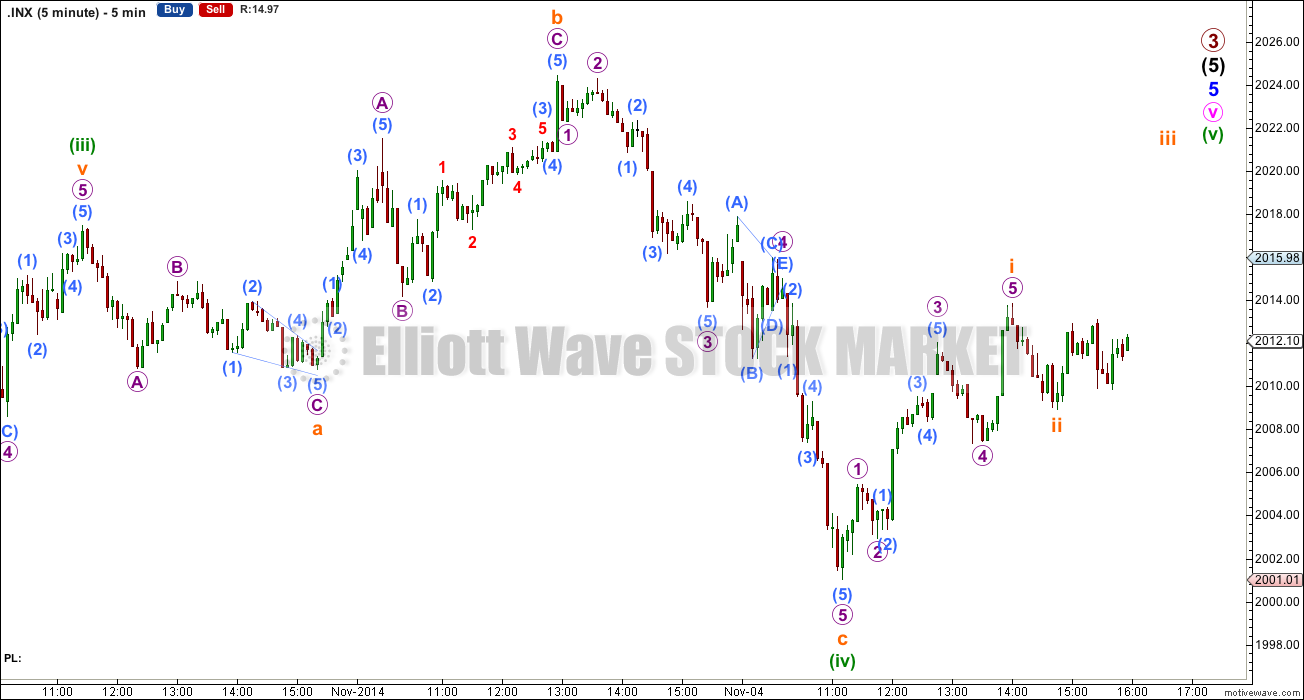
I have checked to see if this structure for minute wave v could be complete. The problem is the subdivision of the last wave up to the high. On the five minute chart this looks very much like a three wave zigzag, but it cannot be the final fifth wave up because fifth waves may only subdivide as fives and may not be threes.
Minuette wave (iv) now exhibits perfect alternation with minuette wave (ii): minuette wave (ii) is a deep 67% zigzag and minuette wave (iv) is a shallow 34% expanded flat.
At 2,035 minuette wave (v) would reach equality in length with minuette wave (i). Because there is no Fibonacci ratio between minuette waves (iii) and (i) I would expect to see a Fibonacci ratio exhibited between minuette wave (v) and either of (iii) or (i), and equality with (i) is the most likely.
At this stage it would be extremely unlikely that minuette wave (iv) would continue further, as if it did so it would become grossly disproportionate to minuette wave (ii). However, it is unlikely but still possible. Minuette wave (iv) may not move into minuette wave (i) price territory below 1,991.40.
Tuesday’s session was not contained within the prior channel. Draw a channel now about this final fifth wave using Elliott’s second technique: draw the first trend line from the lows labeled minuette waves (ii) to (iv), then place a parallel copy on the high of minuette wave (iii). This channel may indicate where minuette wave (v) finds support and resistance.
This wave count requires only one final fifth wave up at minuette wave degree to complete the entire structure up to and including primary degree for primary wave 3.
Bear Wave Count
This bear wave count differs from the bull wave count at the monthly chart level and at super cycle wave degree. To see the historic picture go here.
The subdivisions within primary waves A-B-C are seen in absolutely exactly the same way as primary waves 1-2-3 for the bull wave count.
For both wave counts when minor wave 5 is a complete structure on the hourly and five minute charts then I will have an alternate wave count which moves the degree of labelling within it all down one degree. A completion of a five wave impulse up within minor wave 5 may be either minor wave 5 in its entirety, or it may only be minute wave i within minor wave 5. This is why I am leaving the invalidation point at 1,820.66.
This analysis is published about 07:30 p.m. EST.