
Upwards movement was expected into a target zone of 1,952 – 1,982.
Summary: It is likely that the upwards correction is complete and the next wave down has begun. This is either a third wave or a C wave. Initially a clear breach of the small channel on the hourly chart will confirm this. Thereafter, a new low below 1,876.01 would provide some confidence.
Click on charts to enlarge.
Bearish Wave Count
The weekly charts show how to draw the double aqua blue trend lines. The lower trend line began back in 2011 has repeatedly been tested and is reasonably shallow which is highly technically significant. It has now been breached by more than 3% of market value indicating a trend change.
Because there is such a close Fibonacci ratio between intermediate waves (3) and (1) and intermediate wave (3) lasted 455 days, I am confident this labeling is correct. Also, intermediate wave (3) has the strongest upwards momentum within primary wave C. Therefore, the only piece of this wave count of which I am not confident is the structure within intermediate wave (5). Is it complete or not? This is why I have an alternate bearish wave count for you.
There is technical divergence between price and MACD at the weekly and daily chart levels. This indicates a trend change, but it does not indicate what degree the trend change should be.
For the first time in five years the lower edge of the maroon – – – channel about cycle wave b (or x) was breached. This is significant.
The bear wave count sees a huge super cycle wave (II) incomplete as either an expanded flat correction, a combination, or a double flat.
If cycle wave b or x is now over then the first downwards wave for intermediate wave (1) is now most likely unfolding as a leading diagonal.
To have full confidence in this bearish wave count, and to discard the bullish wave count, I want to see three things happen:
1. A clear five down on the daily chart, with completion of intermediate wave (1).
2. Confirmation from NASDAQ with a new swing low for that market below 3,414,11.
3. A new low below 1,370.58 (although using structure as a guide the bull wave count would probably be discarded before this point).
When we have those three things I will have full confidence in this wave count.
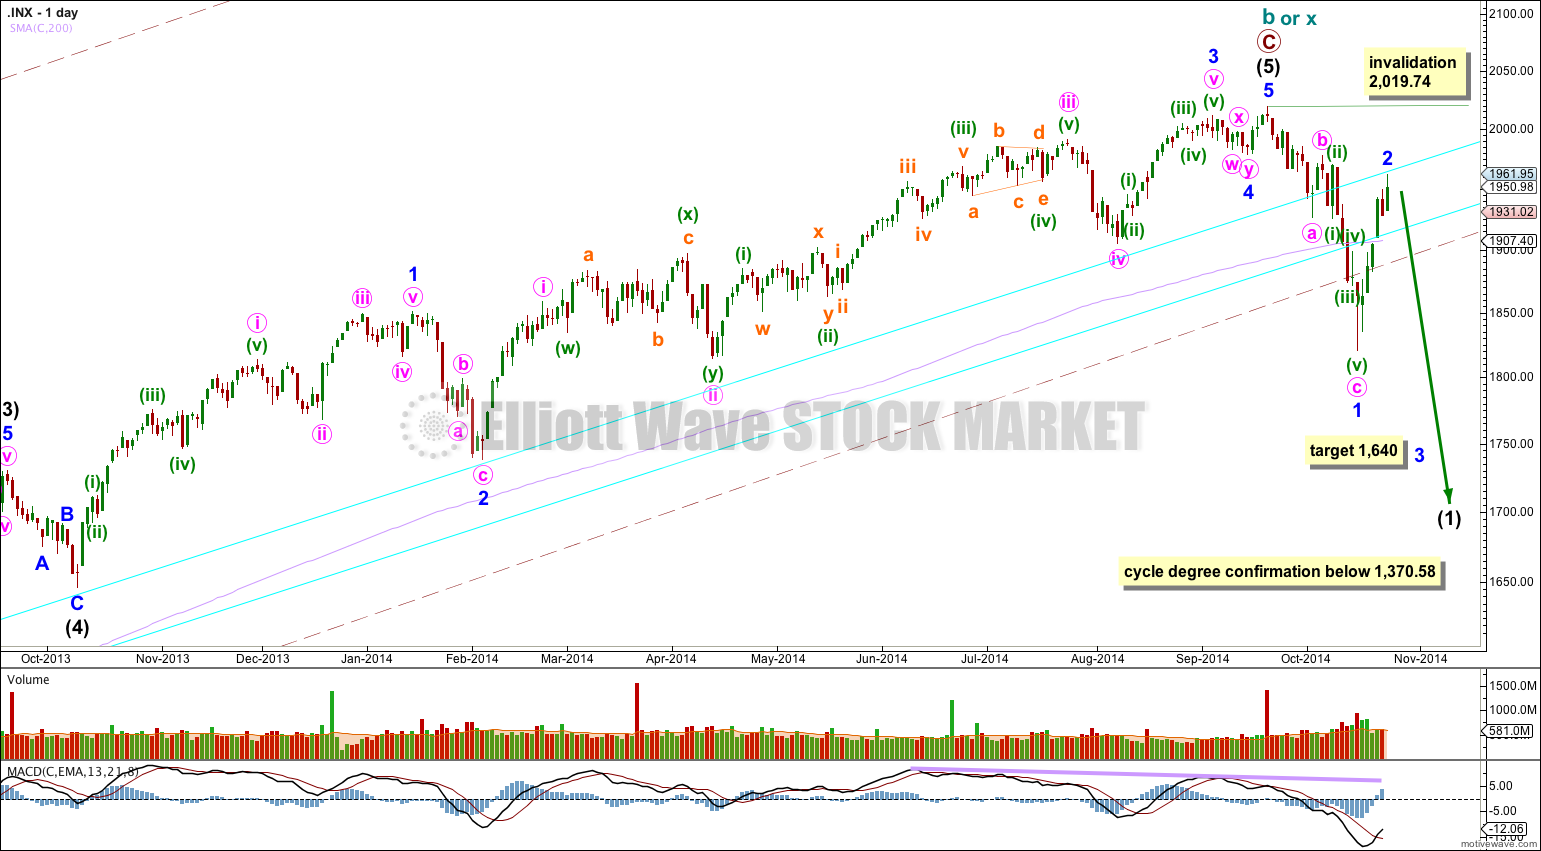
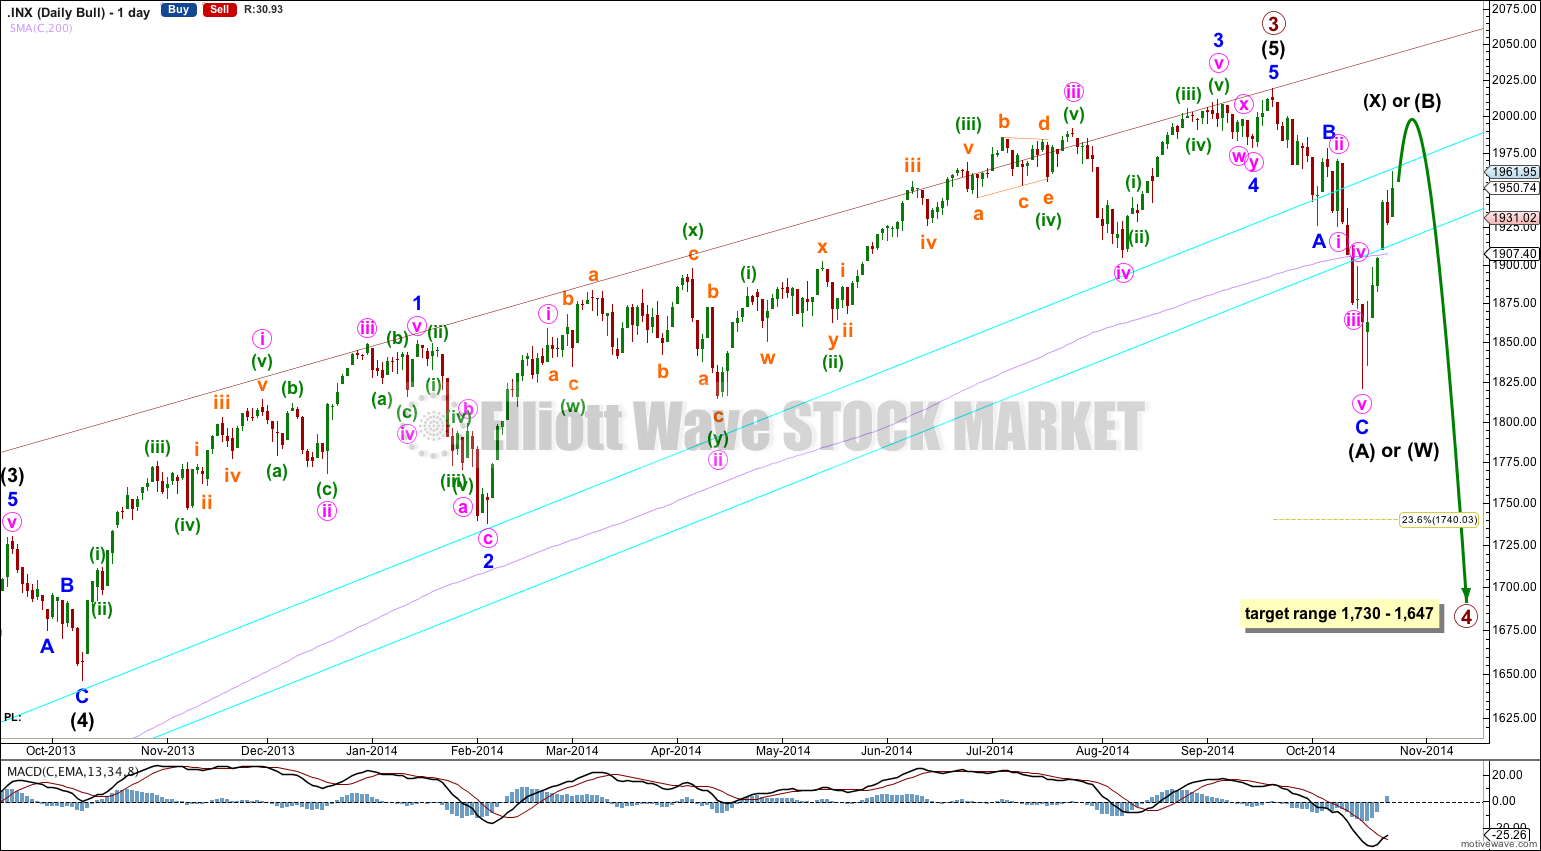
If minor wave 3 has begun (and this requires confirmation on the hourly chart) then at 1,640 it would reach 1.618 the length of minor wave 1.
This wave count differs from the alternate bear count below in the labeling of the subdivisions within intermediate wave (5). Here, there is no Fibonacci ratio between minor waves 3 and 1, and minor wave 5 is 0.89 points longer than 0.146 the length of minor wave 3. Minor wave 2 is a single zigzag lasting 14 days, and minor wave 4 is a double combination lasting 7 days.
Full disclosure: I consider the bear wave count to be most likely because of social mood. If the bull wave count is correct we have just completed a third wave at primary degree, and social mood should be overall positive (third wave) and unrealistically optimistic (within a fifth wave). For there to be rioting in the USA, mass social unrest continuing in Europe, war in the Middle East which is escalating, and the biggest epidemic ever of Ebola in Africa a third wave makes no sense. But a B wave makes complete sense. However, my caution comes from knowing that any analysis of social mood is extremely subjective. I would rather let the structure of the waves guide as to which wave count is correct.
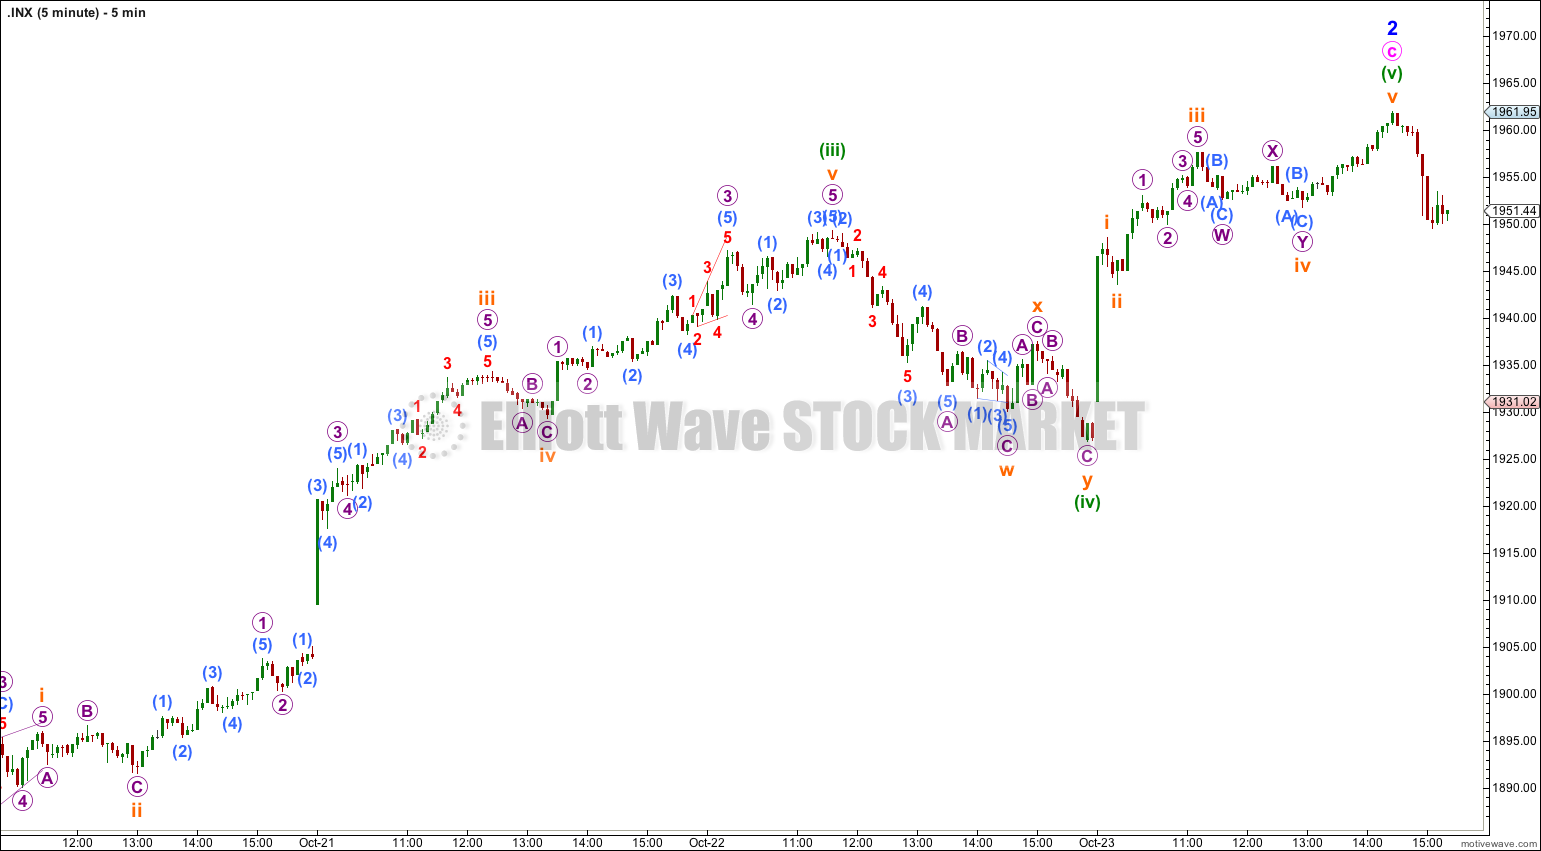
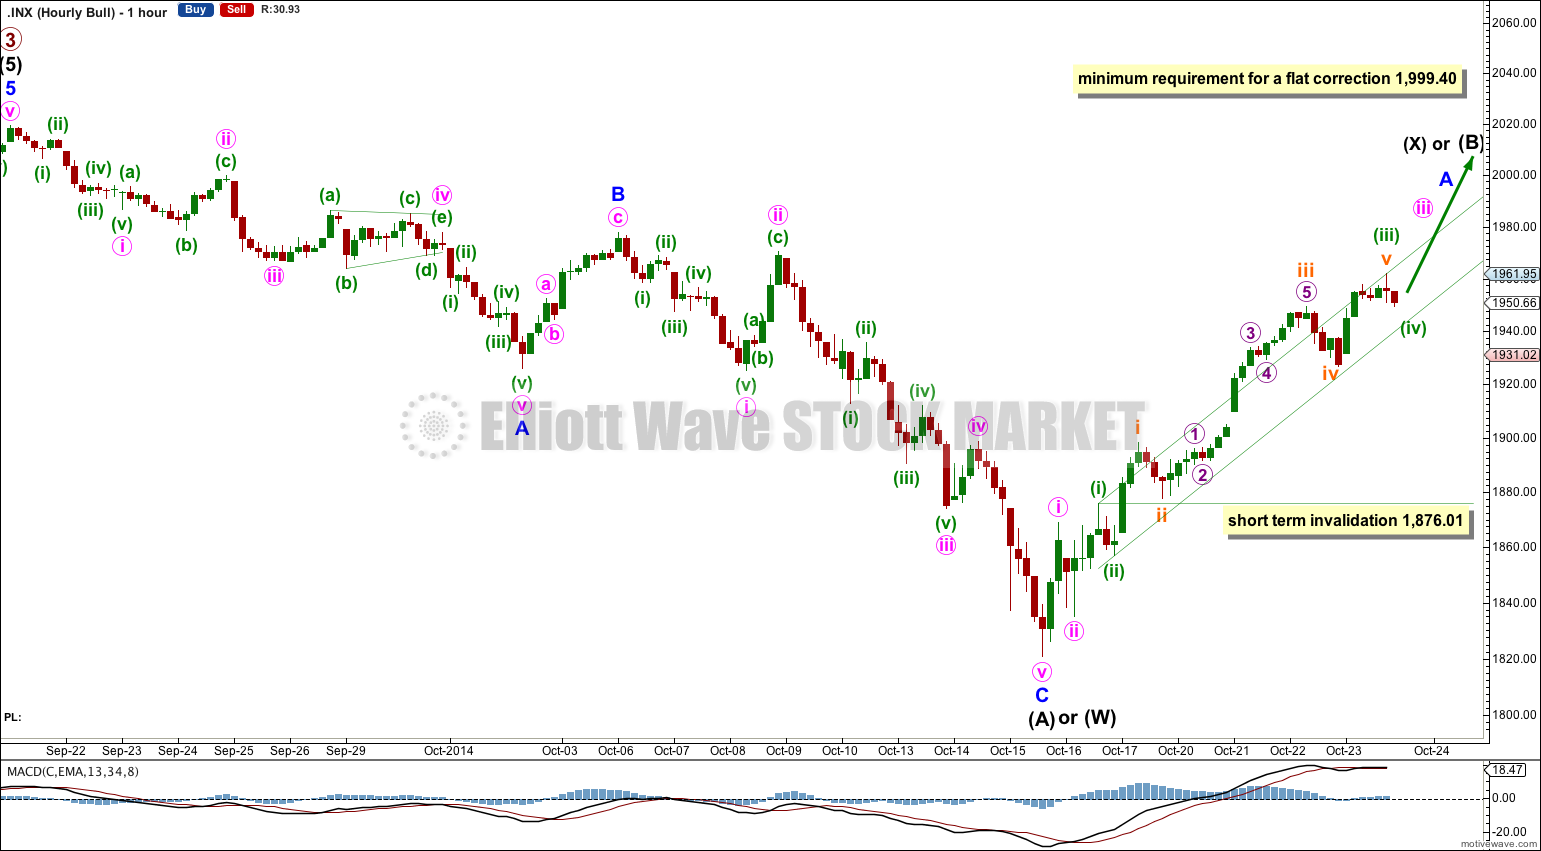
Upwards movement for minor wave 2 is now a complete five wave impulse. Minor wave 2 is now 0.71 of minor wave 1, which is within the normal range for a second wave of a diagonal of between 0.66 to 0.81.
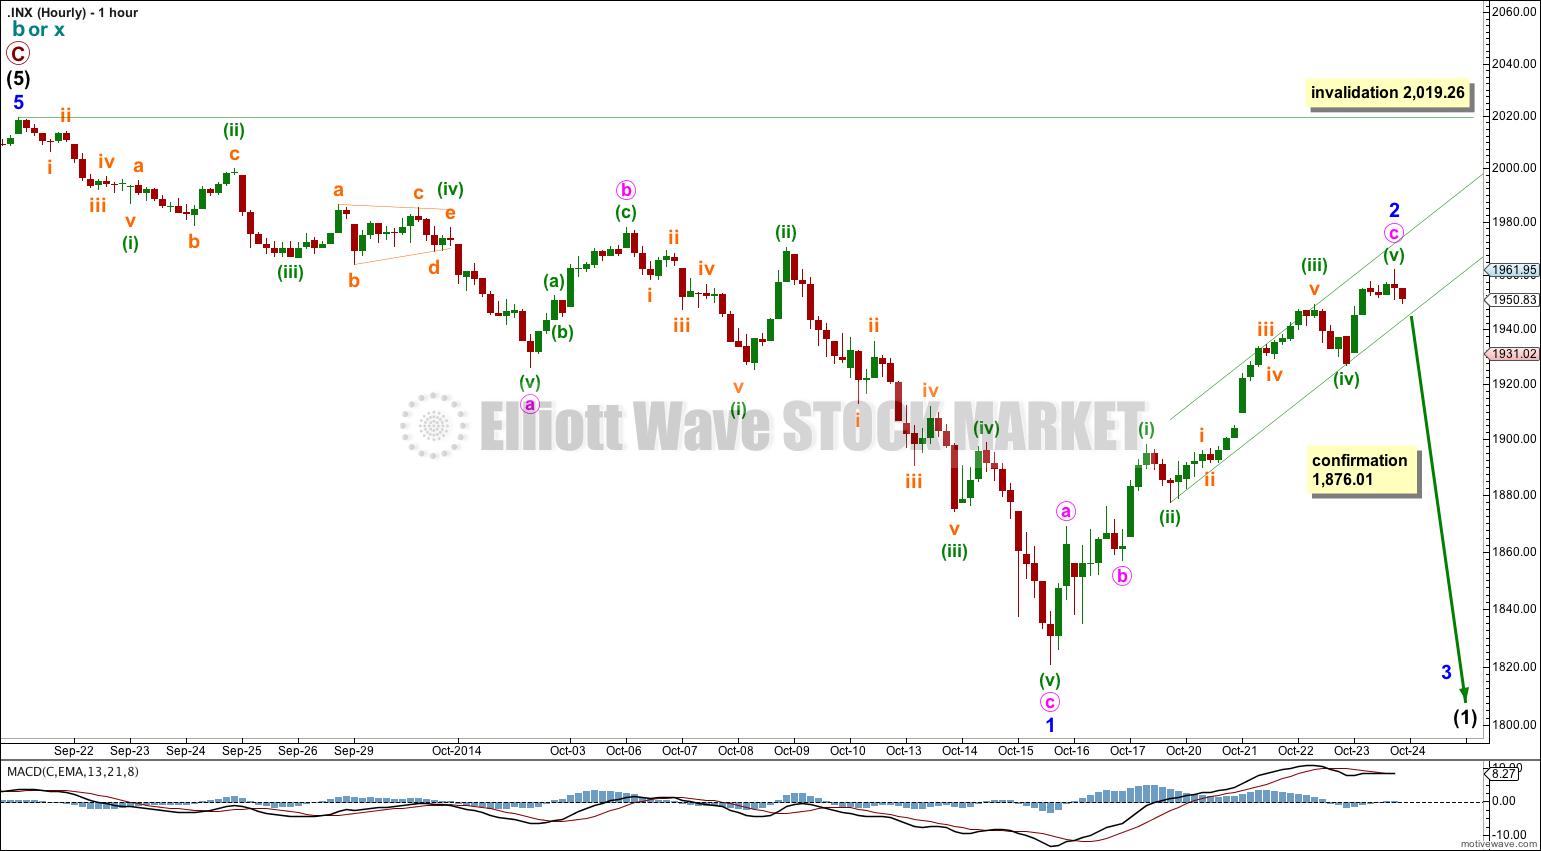
Although the structure is complete it is not confirmed that minor wave 2 is over and a third wave down has just begun. Initially a clear breach of the channel about minor wave 2 is required for an indication that this trend change has happened. Thereafter, a new low below 1,876.01 would provide some price confirmation.
While price remains within the channel about minute wave c we must accept the possibility that upwards movement could continue as minute wave c extends higher.
Minor wave 2 may not move beyond the start of minor wave 1 above 2,019.26.
There is another possible labeling of minor wave 1: it could be an impulse, with the third wave ending at the spike of the red candlestick within minuette wave (v), the last wave down. This would see minor wave 1 having an impulsive count, and intermediate wave (1) an impulse and not a leading diagonal. I am not labeling it thus because on the daily chart this movement looks like a three and not a five. It makes no difference to direction expected, and it makes no difference to the expectation of a third wave next. Only when the fourth wave arrives would this idea diverge. At that stage I will consider it as an alternate if it is still possible.
Alternate Bearish Wave Count
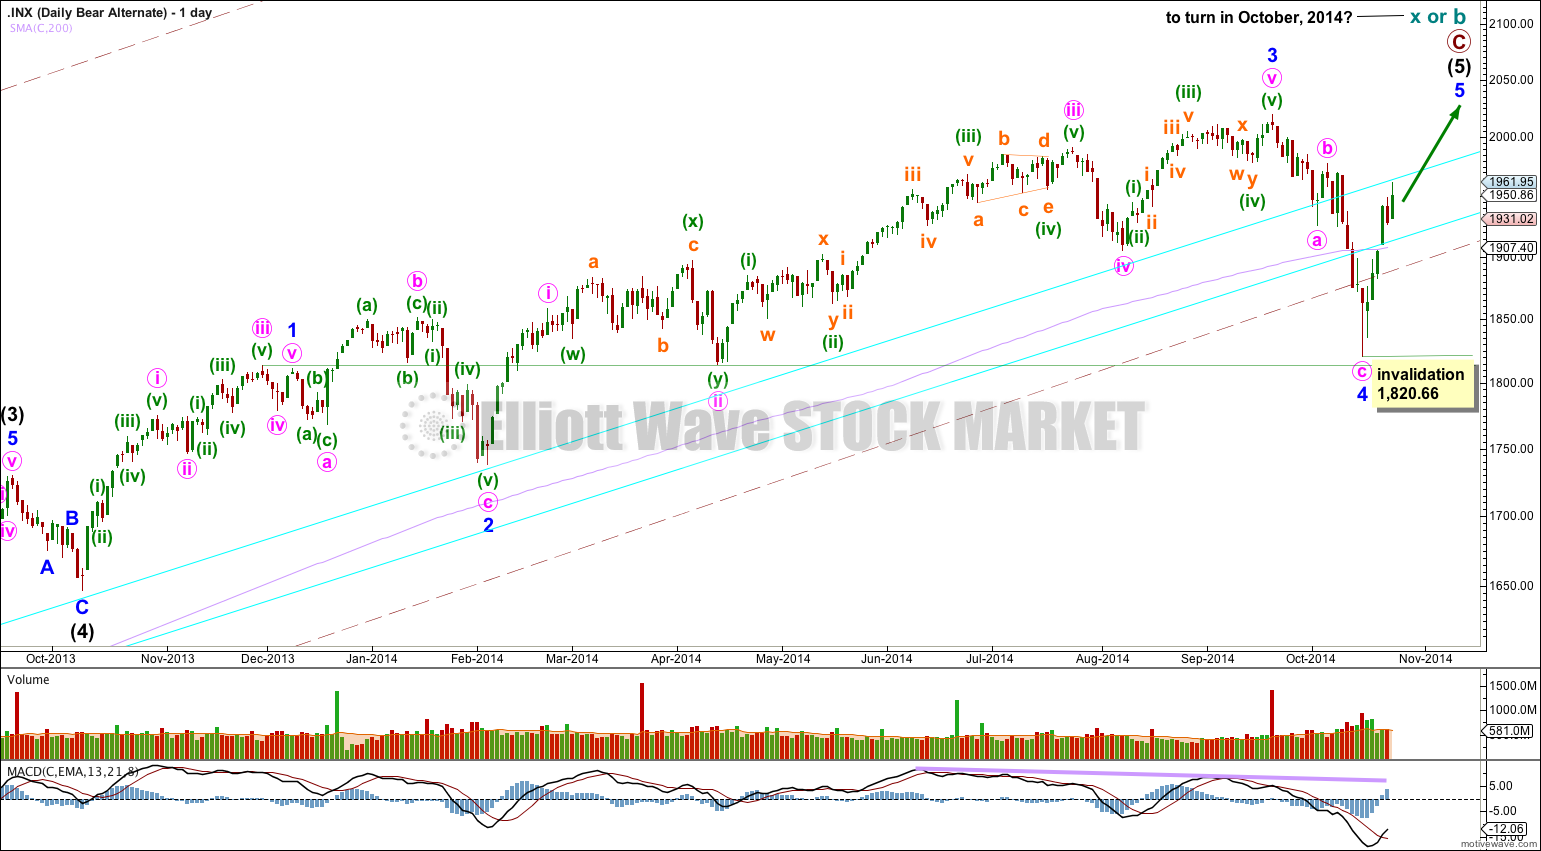
I am confident that I have the labeling of intermediate waves (3) and (4) correct. Intermediate wave (3) lasted 455 days and is just 0.76 short of 2.618 the length of intermediate wave (1). Intermediate wave (3) has the strongest upwards momentum within primary wave C.
With this wave count minor wave 3 is 14.29 points longer than 1.618 the length of minor wave 1. Minor wave 2 is an expanded flat lasting 39 days and minor wave 4 is a zigzag lasting 18 days, and the proportions between minor waves 2 and 4 are better.
The problem within this wave count is at the end of minor wave 3: within it minute wave v looks like a three wave structure and not a five because minuette waves (ii) and (iv) are grossly disproportionate.
Because there is a Fibonacci ratio between minor waves 3 and 1 I would not expect to see a Fibonacci ratio for minor wave 5 to either of 3 or 1. If minor wave 5 only reached equality with minor wave 1 it would be truncated. Minor wave 5 is most likely to make a new high above minor wave 3 at 2,019.26, but it does not have to. It only needs to subdivide as a five wave structure.
It is at this point that this alternate wave count now diverges from the main bearish wave count. This alternate would expect to see maybe six more days of upwards movement to a slight new high.
Bullish Wave Count
This bullish wave count differs from the bearish wave count at the monthly chart level and at super cycle wave degree. To see the historic picture go here.
Primary wave 4 may end within the price territory of the fourth wave of one lesser degree. Intermediate wave (4) price territory is from 1,730 to 1,647.
Primary wave 2 was a 41% zigzag correction. I would expect primary wave 4 to show alternation in structure so most likely it will be a flat, combination or triangle. All of these structures may include a new price extreme beyond the start of intermediate wave (A), so they could see a new high.
Primary wave 2 lasted a Fibonacci 13 weeks. Zigzags tend to be more brief structures. I would expect primary wave 4 to last at least 13 weeks, and it may last up to a Fibonacci 21 weeks if it is a more time consuming structure like a combination or triangle. This would give it a 1.618 duration to primary wave 2.
It is too early to label primary wave 4 as over because it has lasted only 4 weeks and would be a zigzag so have no structural alternation with the zigzag of primary wave 2.
However, my degree of labeling for this downwards movement may be one degree too high. If we see a five down complete then I would move the degree of labeling for this bull wave count down one degree within primary wave 4, which could be only minor wave A of a zigzag for intermediate wave (A).
Because primary wave 4 is most likely to be a flat, triangle or combination, the first movement down is most likely to subdivide as a three wave structure.
If intermediate wave (A) is over then primary wave 4 may be a flat or triangle. Intermediate wave (B) may make a new high above the start of intermediate wave (A) at 2,019.26 as in an expanded flat or running triangle.
If primary wave 4 is a combination then the first structure in the double may be a completed zigzag for intermediate wave (W).
There is more than one way to label this upwards movement. It may now be a complete three as per the hourly chart for the bear wave count, or it may be an incomplete five as per this hourly chart.
If it is a complete three then minor wave A may be over if intermediate wave (B) or (X) is unfolding as a flat correction, double zigzag or combination.
If it is an incomplete five then intermediate wave (B) or (X) is unfolding as a zigzag.
If primary wave 4 is unfolding as a flat correction then within it intermediate wave (B) must reach a minimum 90% length of intermediate wave (A) at 1,999.40. Intermediate wave (B) may make a new high above 2,019.26 as in an expanded flat.
If primary wave 4 is unfolding as a triangle then intermediate wave (B) has no minimum upwards requirement, and may now be over. It could also continue higher and may make a new high above 2,019.26 as in a running triangle.
If primary wave 4 is a combination then within it intermediate wave (X) has no minimum requirement, and may now be over as a zigzag or could continue higher.
If upwards movement is an incomplete structure with minor wave A an incomplete five then minuette wave (iv) may not move into minuette wave (i) price territory below 1,876.01.
This analysis is published about 04:07 p.m. EST.