
The target for the main Elliott wave count for downwards movement at 1,884 has been comfortably exceeded. The bearish wave count looks like it may be correct, but there is no confirmation of a huge trend change at this time.
Summary: If the bull wave count is correct then downwards movement should stop about the lower edge of the maroon – – – channel. If the bearish wave count is correct then the middle of a third wave has just passed. We would still have to wait for confirmation of this bearish wave count for about two weeks. I want to see a full weekly candlestick below the maroon – – – trend line before I call a trend change at cycle degree. For tomorrow I expect to see a green candlestick for a minute degree fourth wave correction.
Click on charts to enlarge.
Bullish Wave Count
All daily, weekly and monthly charts are viewed on a semi log scale.
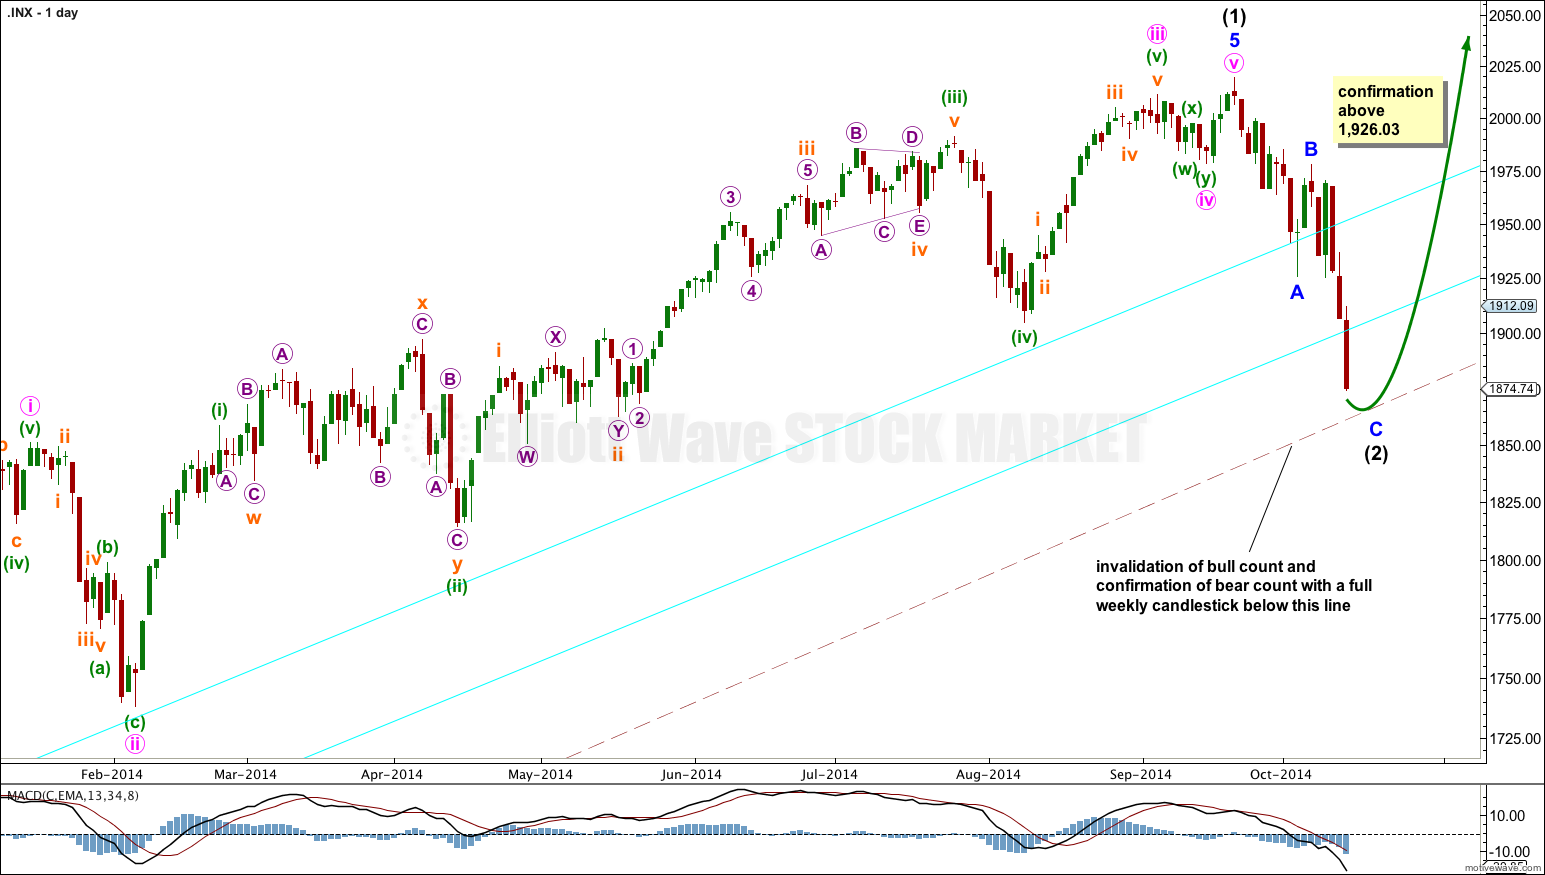
The aqua blue trend lines are critical. Draw the first trend line from the low of 1,158.66 on 25th November, 2011, to the next swing low at 1,266.74 on 4th June, 2012. Create a parallel copy and place it on the low at 1,560.33 on 24th June, 2013. While price remains above the lower of these two aqua blue trend lines we must assume the trend remains upwards. This is the main reason for the bullish wave count being my main wave count. Using a traditional technical analysis approach, a breach of the lower trend line by more than 3% of market value would indicate a trend change. To see how I have drawn these trend lines go here.
There are a couple of things about this wave count of which I am confident. I see minor wave 3 within intermediate wave (1) as over at 1,729.86 (19th September, 2013). It has the strongest upwards momentum and is just 0.76 longer than 2.618 the length of minor wave 1. At 455 days duration this is a remarkably close Fibonacci ratio. The subdivisions within it are perfect.
Minor wave 5 is 20.24 points longer than 1.618 the length of minor wave 1. This is a 5.4% variation. I consider any variation less than 10% to be acceptable.
The large maroon – – – channel is copied over from the weekly chart. It is drawn in exactly the same way on bull and bear wave counts. For the bull wave count this channel is termed a base channel about primary waves 1 and 2. A lower degree second wave should not breach the lower edge of a base channel drawn about a first and second wave one or more degrees higher. The lower maroon – – – trend line differentiates the bull and bear wave counts at cycle degree and monthly chart level.
Intermediate wave (2) is expected to be a very shallow second wave correction. The support provided by the base channel should be stronger than the tendency of a second wave to be deep. Intermediate wave (1) lasted 35 months. Intermediate wave (2) should not be nearly as long in duration; I would expect it to last only a few weeks, maybe only five weeks in total. So far it is in its third week.
The strong overshoot of the channel about intermediate wave (2) indicates an unfolding third wave down, and so fits the bearish wave count better than this bullish wave count. But I will not swap them over until the bearish wave count is confirmed.
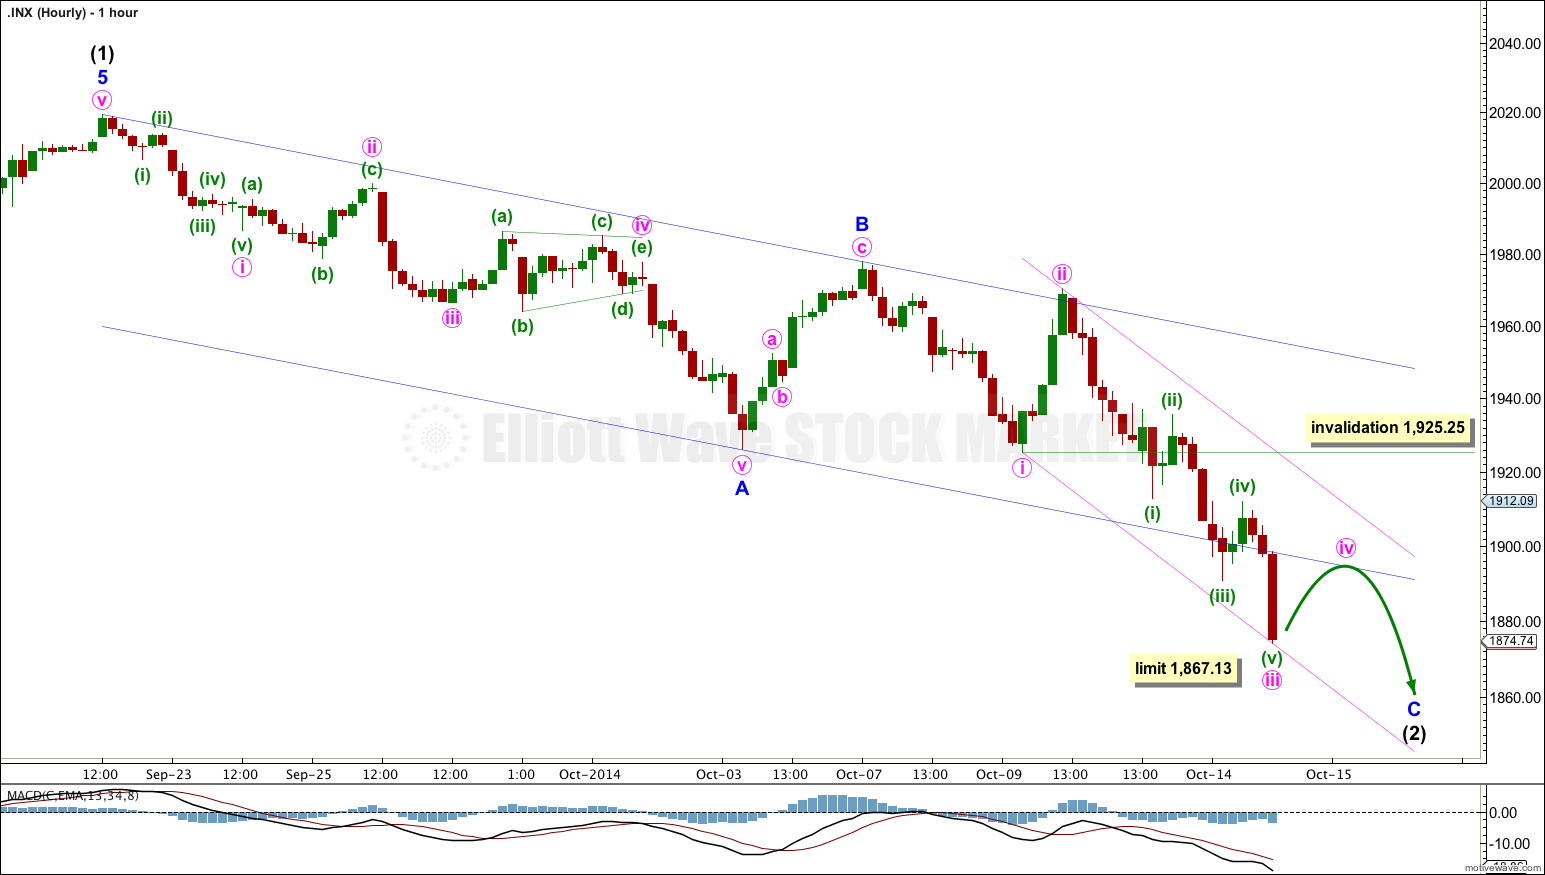
There is no Fibonacci ratio between minute waves iii and i.
Ratios within minute wave iii are: minuette wave (iii) has no Fibonacci ratio to minuette wave (i), and minuette wave (v) would be 2.33 points longer than 0.618 the length of minuette wave (iii). Importantly, minuette wave (iii) is shorter than minuette wave (i). This limits minuette wave (v) to no longer than equality in length with minuette wave (iii) at 1,867.13 because a third wave may not be the shortest within an impulse.
For both the bull and bear wave counts tomorrow I would expect to see a small fourth wave correction for minute wave iv, then more downwards movement to complete minor wave C for the bull count and minor wave 3 for the bear wave count. Once that is done then the wave counts will diverge.
Within minor wave C minute wave iv may not move into minute wave i price territory above 1,925.25.
*Analysis is late today and I have no 5 minute chart for you due to problems with MotiveWave. I have had to replicate all my work on a second computer. Hopefully I’ll be back to normal tomorrow.
Bearish Wave Count
We should always assume the trend remains the same, until it is proven otherwise. The trend is your friend. I will assume the S&P 500 remains in a bull market until this wave count is confirmed.
To see the difference between bull and bear wave counts they must be viewed on monthly charts here and video here.
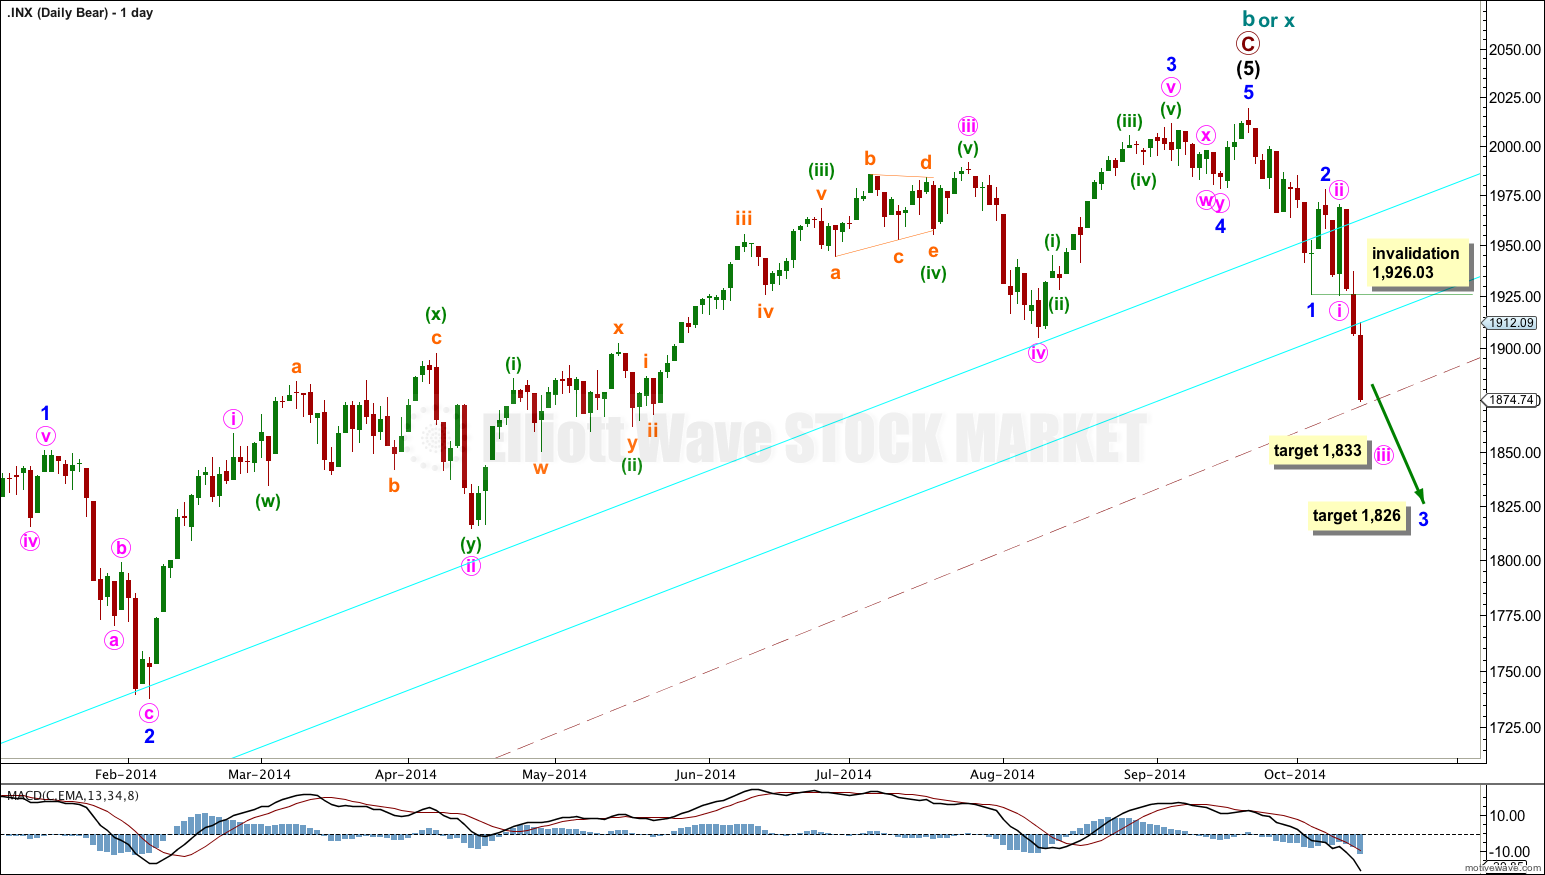
The differentiation between the bull and bear wave count is the maroon – – – channel. For the bear wave count this channel is a corrective channel about cycle wave b or x zigzag. When a channel drawn about a zigzag is breached that provides trend channel confirmation that the zigzag is over and the next wave is underway.
If this trend line is breached by a full weekly candlestick below it and not touching it then this bear wave count would be my main wave count and I would then calculate downwards targets at cycle degree.
Before final confirmation of this wave count we now have indication it may be correct with a clear breach of the lower aqua blue trend line. This line began in November 2011. It is reasonably shallow and repeatedly tested, and is extremely technically significant. If it is breached that would be a very strong indication that this bear wave count is actually correct. Because the implications are so significant (a huge market crash) it is important to wait for full and final confirmation before making such a huge call.
At 1,833 minute wave iii would reach 2.618 the length of minute wave i. At 1,826 minor wave 3 would reach 1.618 the length of minor wave 1.
Minor wave 4 may not move into minor wave 1 price territory. When this current impulse downwards for minor wave 3 (and for the bull wave count for minor wave C) is complete then subsequent movement above 1,926.03 would invalidate this bear wave count and provide confirmation of the bull wave count.
*Note: on this daily chart for the bear wave count I cannot get the maroon – – – channel or the aqua blue trend lines to sit correctly. This may be a workstation problem and may be fixed tomorrow. The lines on the bull wave count are more accurate.
This analysis is published about 10:11 p.m. EST.