
Downwards movement has brought price to touch the upper aqua blue trend line.
Summary: The situation is unclear, but the main wave count still has the better overall look. Movement above 1,964.04 would provide price confirmation that minute wave iv is over and minute wave v is underway. It is possible that intermediate wave (1) (and for the bear count cycle wave b or x) is over. Only a breach of the lower aqua blue trend line would provide confirmation of a trend change.
Click on charts to enlarge.
Bullish Wave Count
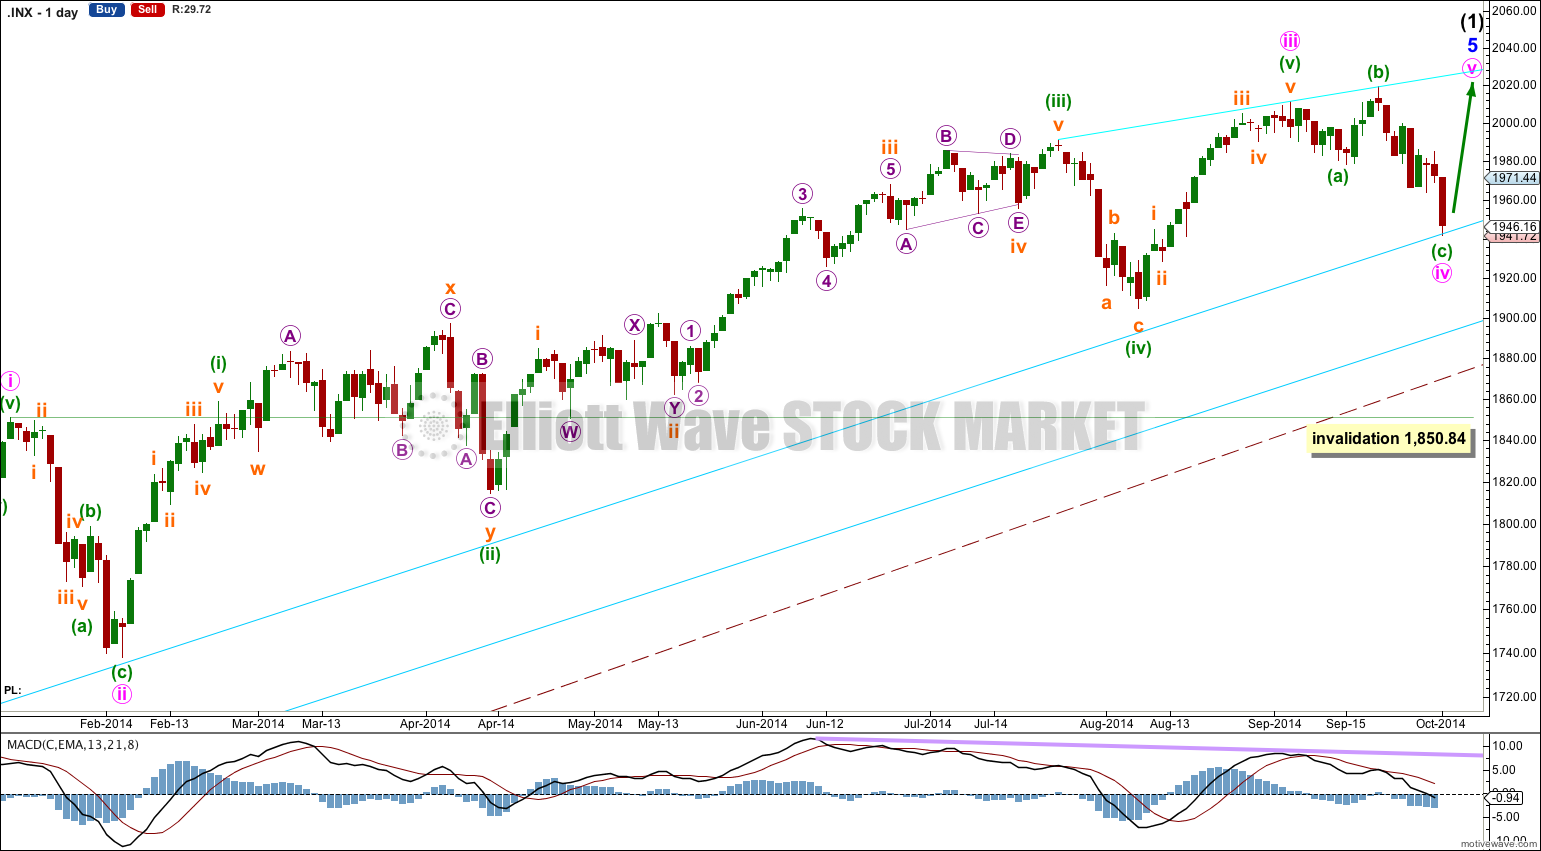
The S&P 500 is either just about to have one small final upwards fifth wave to complete the long impulse of intermediate wave (1), or intermediate wave (1) is over and intermediate wave (2) has just begun (alternate wave count at the end of this analysis).
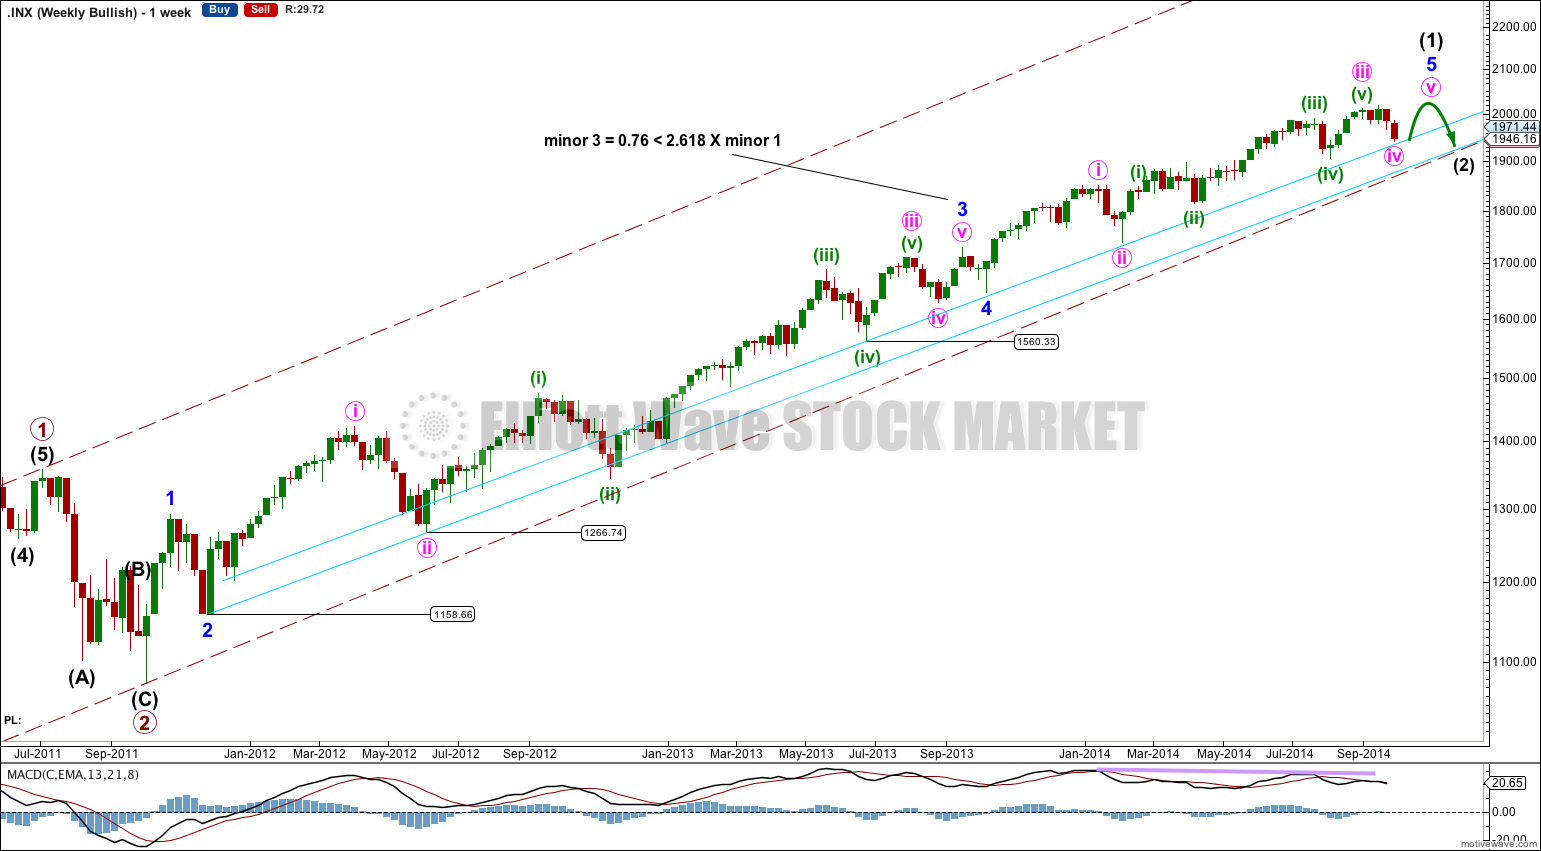
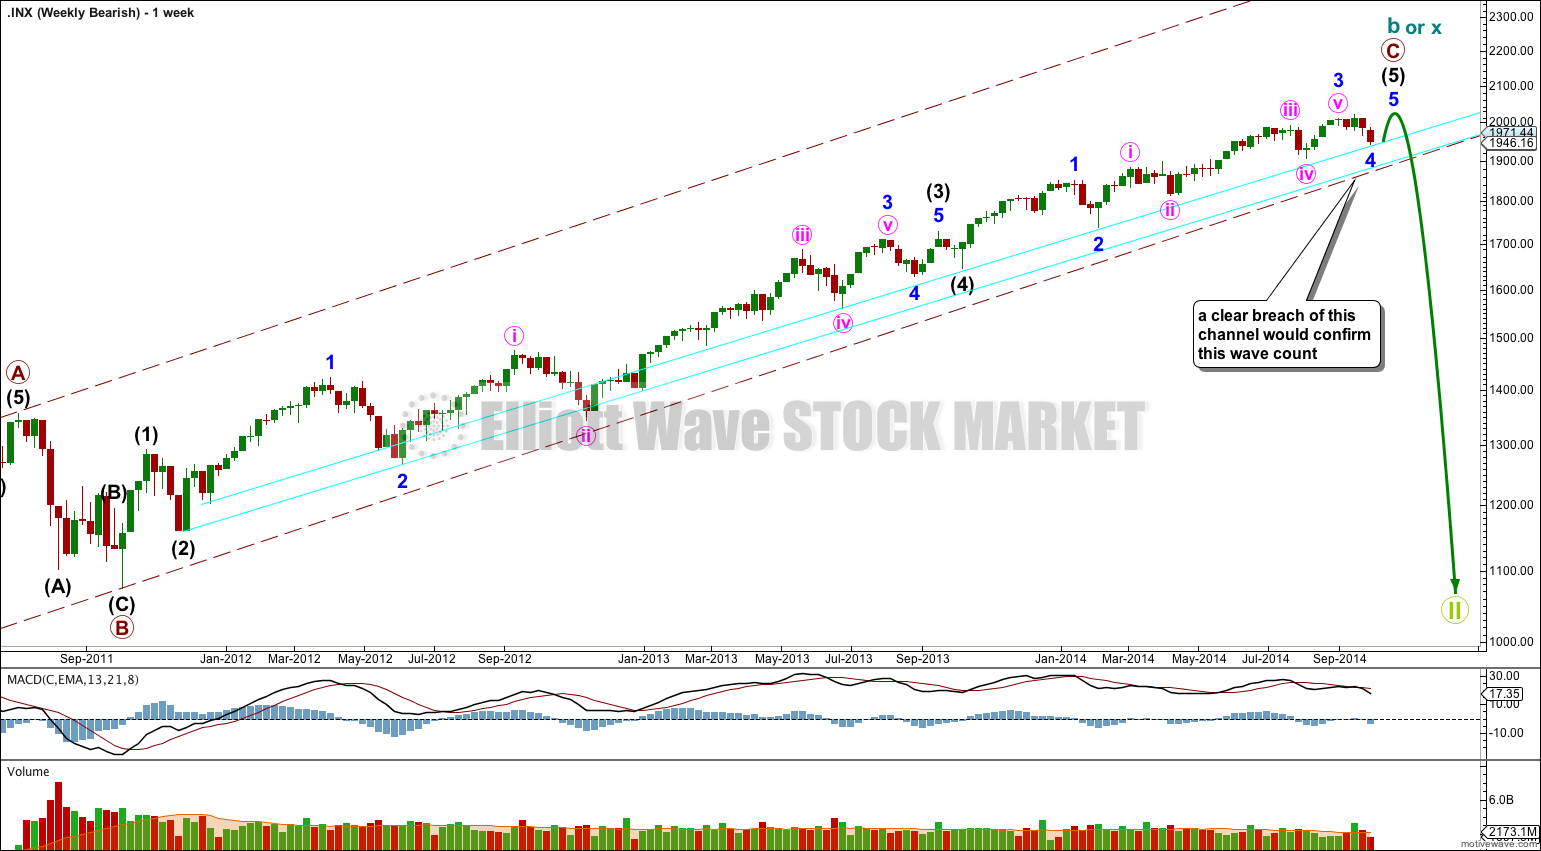
The maroon – – – channel is a base channel drawn about primary waves 1 and 2. Primary wave 3 should have clearly and strongly breached the upper edge of this base channel by now. The fact that it has not is great cause for concern for this bullish wave count, and the biggest reason why I take the bearish wave count very seriously.
Primary wave 3 cannot have passed its middle if price is still within the lower half of the base channel. This is why I am labeling this long impulse intermediate wave (1) only within primary wave 3.
A lower degree second wave correction should not breach the base channel drawn about a first and second wave one or more degrees higher. If it does then the wave count should be discarded and an alternative explanation sought. For the S&P if the lower maroon – – – channel is breached I will discard this wave count in favour of the bearish wave count.
This wave count would expect a remarkably shallow second wave correction for intermediate wave (2). The tendency of second waves to be deep is not as strong as the support which should be provided by the base channel.
For the Dow price is below the base channel, indicating the bearish wave count is actually correct.
The aqua blue trend lines are critical. Draw the first trend line from the low of 1,158.66 on 25th November, 2011, to the next swing low at 1,266.74 on 4th June, 2012. Create a parallel copy and place it on the low at 1,560.33 on 24th June, 2013. While price remains above the lower of these two aqua blue trend lines we must assume the trend remains upwards. This is the main reason for the bullish wave count being my main wave count.
There are a couple of things about this wave count of which I am confident. I see minor wave 3 within intermediate wave (1) as over at 1,729.86 (19th September, 2013). It has the strongest upwards momentum and is just 0.76 longer than 2.618 the length of minor wave 1. At 455 days duration this is a remarkably close Fibonacci ratio. The subdivisions within it are perfect. If this is correct then minor wave 4 ends at 1,646.47 and this is where minor wave 5 begins.
Within minor wave 5 there is no Fibonacci ratio between minute wave i and iii. This makes it more likely that minute wave v will exhibit a Fibonacci ratio to either of i or iii. Within minor wave 5 minute waves i and iii are both extended. This means that minute wave v may not extend and should be relatively short and brief.
The first target has a higher probability, and may even be slightly too high. A trend line drawn at the upper range of recent movement shows minute wave v may end close to 2,042. This trend line may be slightly overshot with a final push upwards before the market turns.
I would expect to see more divergence between price and MACD develop over coming weeks as minute wave v unfolds.
I would expect minute wave v to be relatively brief and should be over within about two to four weeks.
Minute wave ii lasted 14 sessions and was a relatively deep 55% zigzag correction. Minute wave iv is showing alternation as a shallow flat correction lasting 19 sessions.
The large maroon – – – channel is copied over from the weekly chart. It is drawn in exactly the same way on bull and bear wave counts. For the bull wave count this channel is termed a base channel about primary waves 1 and 2. A lower degree second wave should not breach the lower edge of a base channel drawn about a first and second wave one or more degrees higher. The lower maroon – – – trend line differentiates the bull and bear wave counts at cycle degree and monthly chart level.
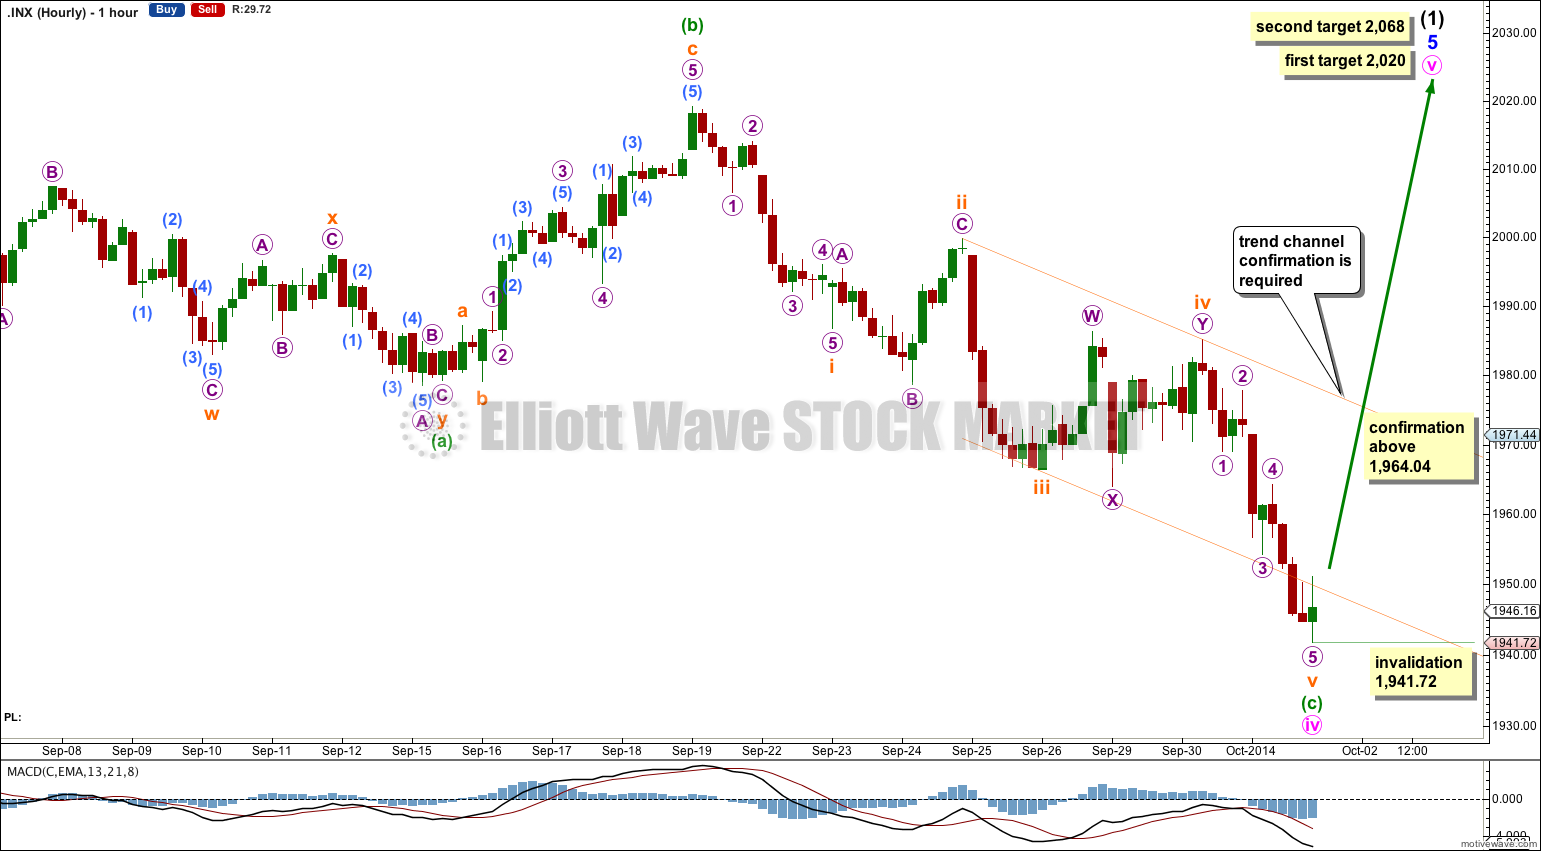
Minute wave iv was not complete and price moved lower. Minute wave iv may again be seen as a completed expanded flat correction.
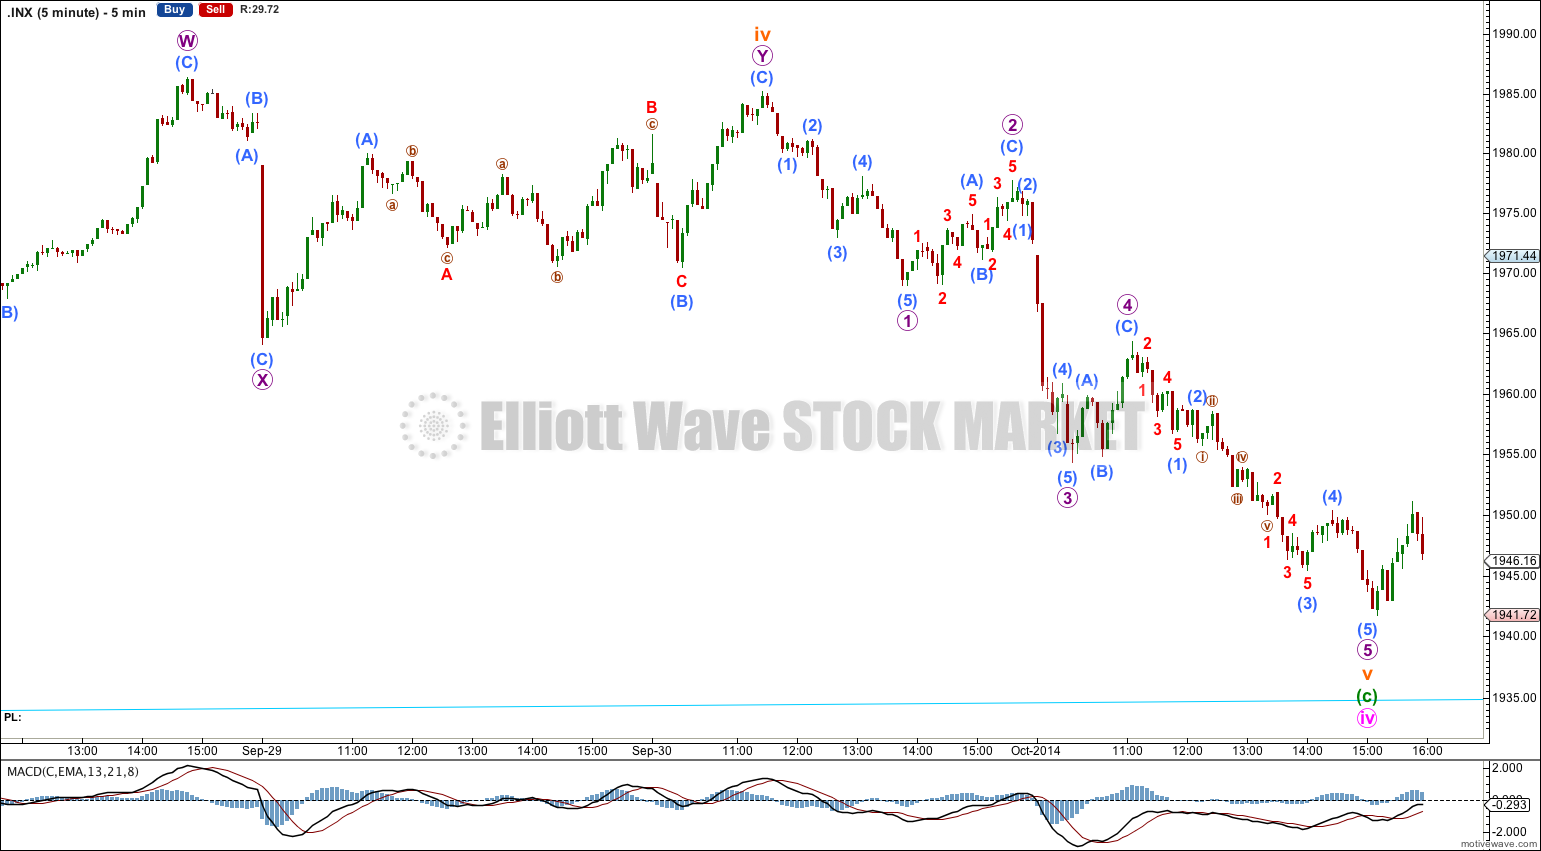
There is no Fibonacci ratio between minuette waves (a) and (c).
Ratios within minuette wave (c) are: subminuette wave iii is just 1.01 longer than equality with subminuette wave i, and subminuette wave v has no Fibonacci ratio to either of subminuette waves i or iii. Subminuette wave v has ended with a slight overshoot of the lower edge of the channel.
Movement above 1,964.04 would invalidate the alternate hourly wave count below.
At 2,020 minute wave v would reach 0.382 the length of minute wave i. At 2,068 minute wave v would reach 0.618 the length of minute wave i.
If the main wave count is correct, if intermediate wave (1) (and for the bear wave count cyle wave b or x) requires one final upwards fifth wave to complete the structure then it should begin tomorrow. The upper aqua blue trend line has not been breached in over a year; this is the first time it has been touched. However, if it is breached we may be seeing a “shakeout bottom” before the final fifth wave up.
Hourly Alternate Wave Count.
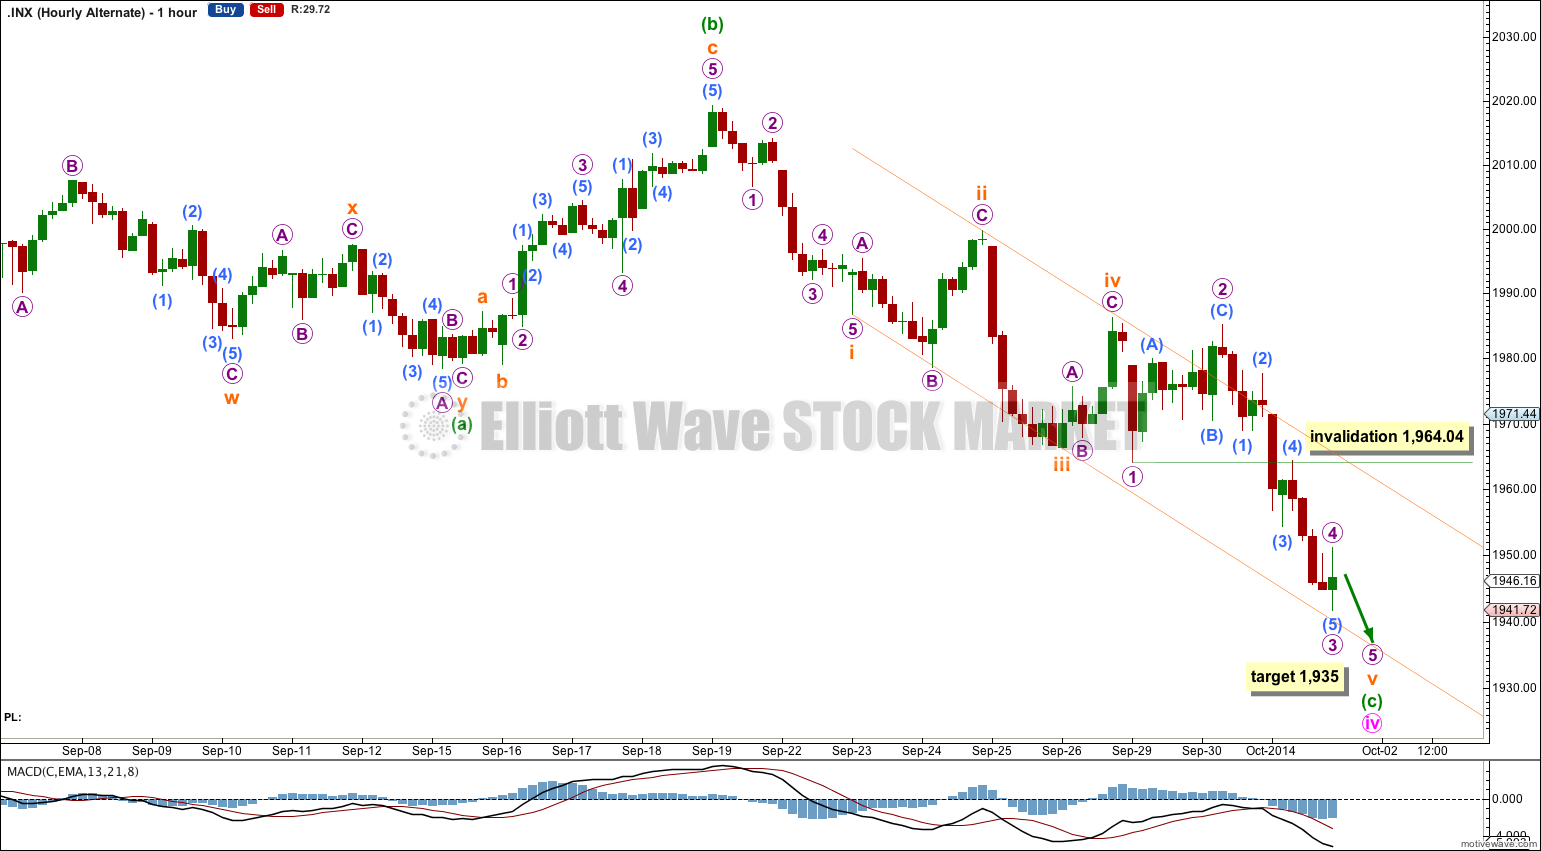
According to Magee in “Technical Analysis of Stock Markets” 9th edition, page 266: sometimes “shakeout bottoms tend to fall on the outer line. The recoveries from such bottoms are usually just as sharp, and prices, therefore, rally back above the upper, inner line quickly.”
Minute wave iv could continue below the upper aqua blue trend line in a “shakeout bottom” ending on the lower aqua trend line, before a final fifth wave up for minute wave v.
Only when the lower aqua blue trend line is breached by 3% or more of market value would we be using Magee’s trend lines correctly in identifying a trend change. Because it would be a downtrend it need not be accompanied by increased volume (pg 262). The market may fall of its own weight.
If minute wave iv continues then at 1,935 minuette wave (c) would reach 2.618 the length of minuette wave (a).
Bearish Alternate Wave Count
To see the difference between bull and bear wave counts they must be viewed on monthly charts here and video here.
The differentiation between the bull and bear wave count is the maroon – – – channel. For the bear wave count this channel is a corrective channel about cycle wave b or x zigzag. When a channel drawn about a zigzag is breached that provides trend channel confirmation that the zigzag is over and the next wave is underway.
If this trend line is breached by a full weekly candlestick below it and not touching it then this bear wave count would be my main wave count and I would then calculate downwards targets.
We should always assume the trend remains the same until proven otherwise; the trend is your friend. While price remains above the lower maroon – – – trend line I will assume that the S&P 500 remains within a bull market.
Alternate Wave Count
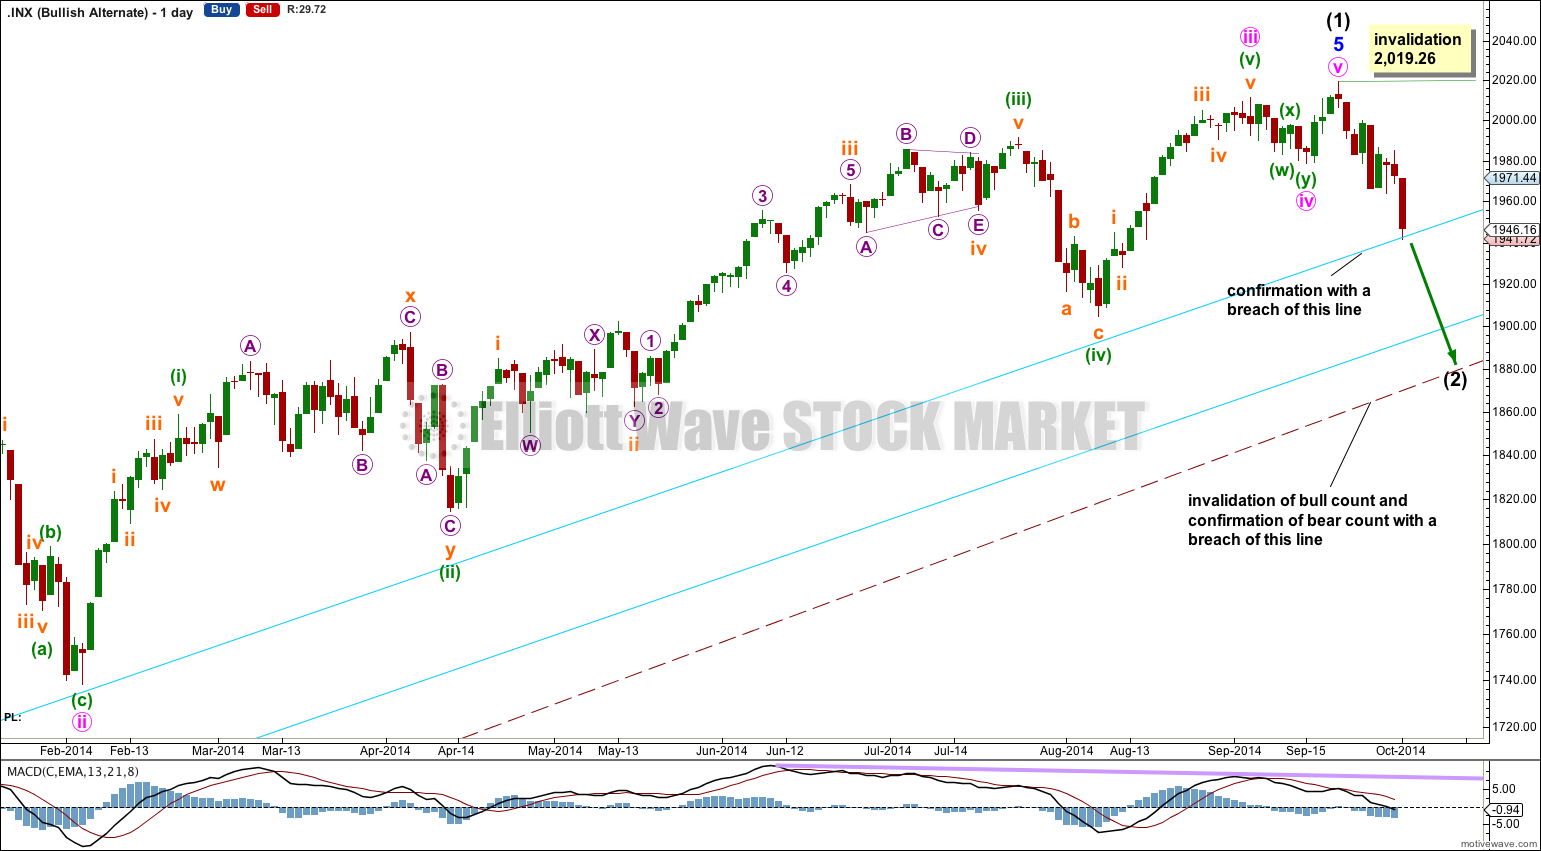
This alternate idea works for both bull and bear wave counts. It is possible that the upwards impulse of intermediate wave (1) (and for the bear wave count the upwards impulse for primary wave C) is over.
However, this alternate has a low probability from an Elliott wave perspective for two reasons:
1. Minute wave iv is very brief at only 7 sessions compared to minute wave ii at 14 sessions. The lack of proportion looks odd.
2. Minute wave iv has little structural alternation with minute wave ii; minute wave ii is a single zigzag and minute wave iv is a double zigzag.
Within intermediate wave (2) the first move down should be a five. Within it no second wave correction may move beyond its start above 2,019.26.
Intermediate wave (2) should not breach the lower edge of a base channel drawn about primary waves 1 and 2. For the bear wave count cycle wave c should breach this corrective channel about cycle wave b.
This analysis is published about 09:17 p.m. EST.