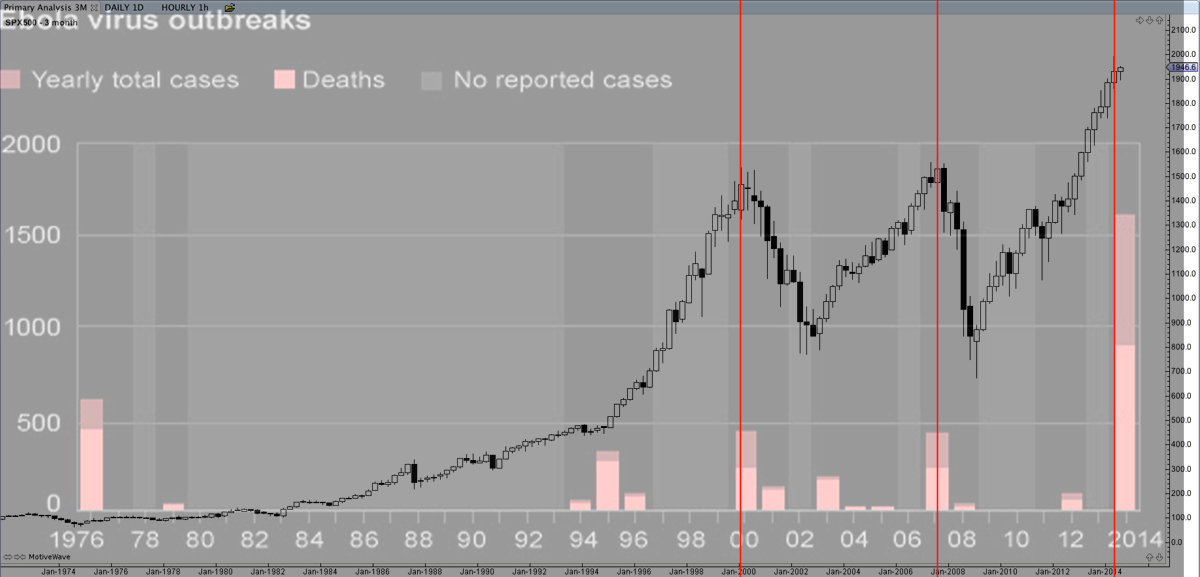
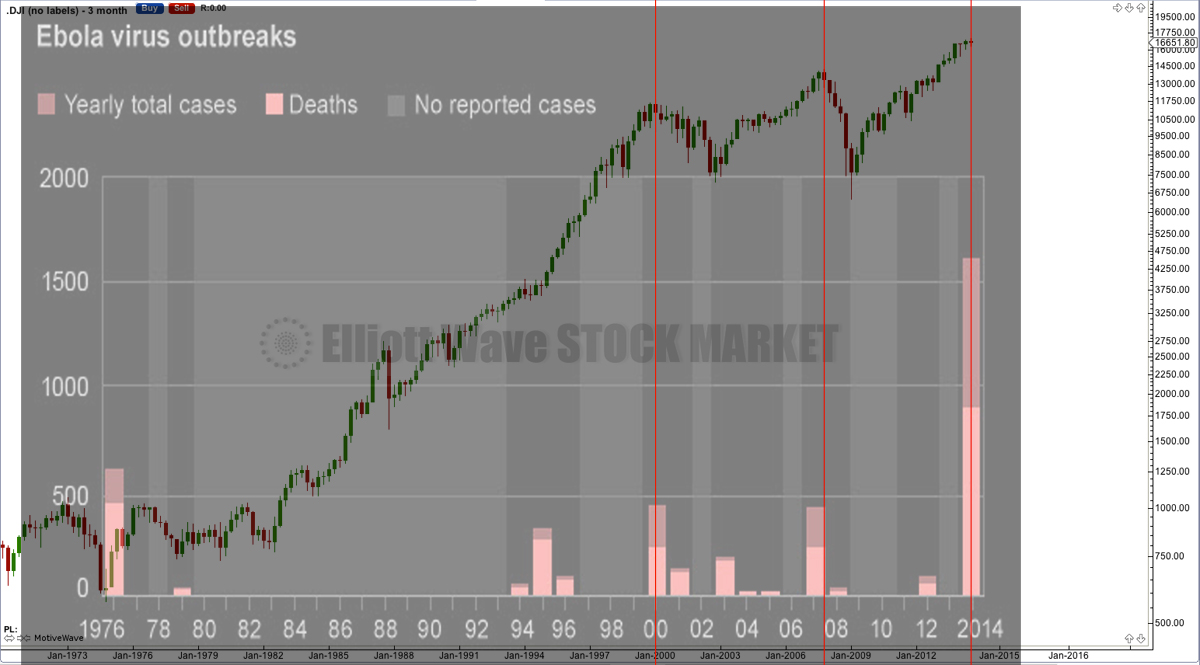
Below are charts which show recorded outbreaks of Ebola alongside stock market price movement.
There appears to be a correlation between Ebola outbreaks and both the Dow and S&P. Ebola outbreaks occur close to the beginning of a market crash in 2000, 2008 and a large correction (not a crash) in 2012. Previously an Ebola outbreak occurred at the end of a major market correction in 1976.
The Dotcom crash of 2000 to October 2002 was followed at its end by another outbreak of Ebola.
In 1994 / 1995 another outbreak of Ebola coincided with only a minor degree market correction (so the correlation is small).
Currently we are seeing the largest ever outbreak of Ebola. It’s an interesting correlation and if correct would support the bearish wave counts for S&P and Dow.


Nice chart. I like esoteric work and people who think beyond the end of their nose. 🙂 Mutations are happening very rapidly in our world. That likely includes mutations of human behavior and consciousness. The very weak solar maxima plays a major role in this. When the solar wind is very weak, gamma ray radiation, the source of cellular mutation, is able to penetrate the solar system and impact life on earth. NASA and other space agencies have recorded massive gamma ray energy spikes from deep space including Orion. Which, by the way, is the constellation known in Biblical times as the Son of Man.
The world is clearly not as it seems. And, this moment in human history is likely unprecedented. Buckle up.
I glad I can see beyond the end of my nose, let alone think that far. Life would be more difficult if I could not 🙂
It certainly would. We see that manifested in the countless difficulties in this world because people aren’t able to think beyond the end of their nose. Generally because of the endless stream of propaganda that teaches us what to think rather than how to think.
Lara,
Thanks, fascinating data. When you say “support the bearish wave counts for S&P and Dow” do you mean the S&P bearish wave count as currently shown–both S&P bullish and bearish waves moving up until a top in maybe October?
Sorry, yes. I mean the very long term bearish wave count for S&P and Dow. The one which sees a huge market crash possibly to begin in October.
The alternate.
Thanks. I understand. I appreciate seeing alternative wave patterns. Ebola to S&P–wow never saw that before but obvious visual tendencies when compared.