
I expect FTSE has seen a big trend change, but this is unconfirmed. Only when the channel on the monthly chart is clearly breached will I have confidence in this wave count.
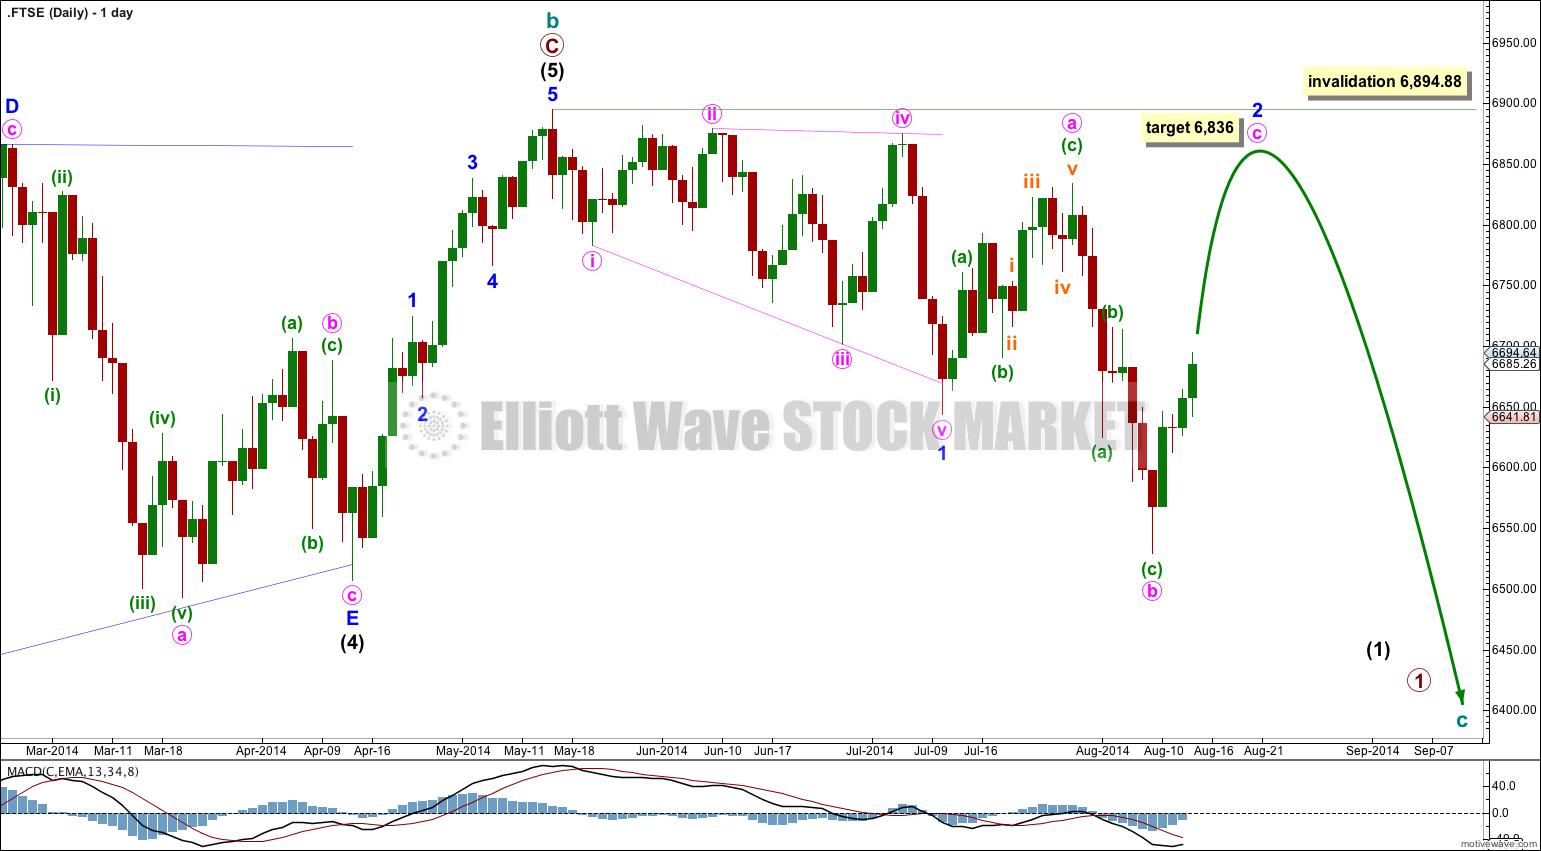
In the short term I expect some more upwards movement to 6,836, but not above 6,894.88.
Click on charts to enlarge.
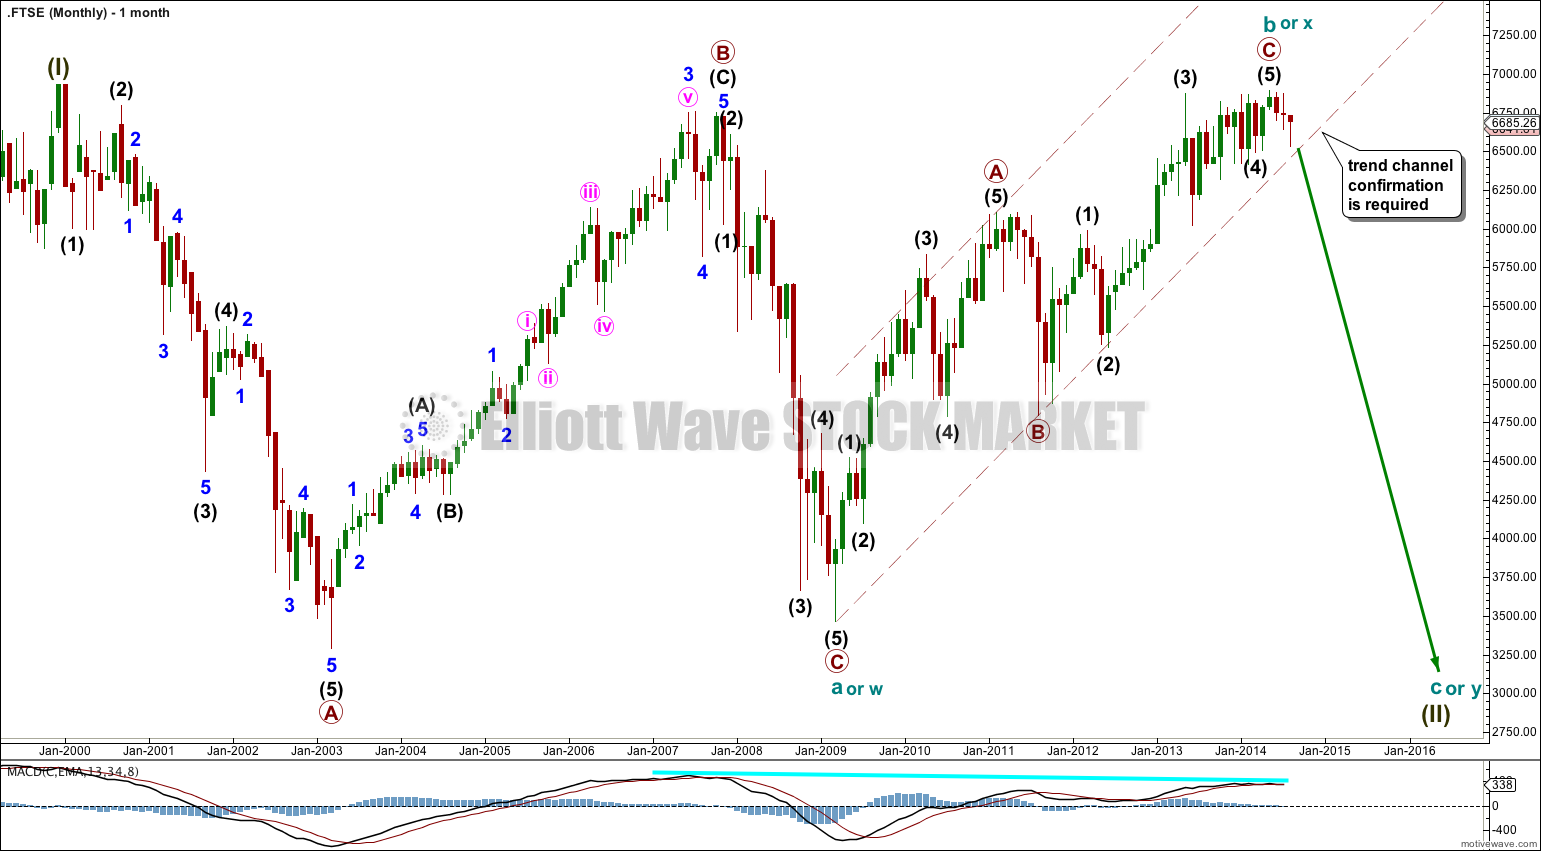
The bigger picture sees FTSE in a huge correction for a super cycle wave (II).
Super cycle wave (II) may be either a regular flat correction (labeled cycle a, b, c) or it may be a double flat or combination (labeled cycle w, x and y).
A regular flat correction would expect a five wave structure downwards for cycle wave c to move at least a little below the end of cycle wave a at 3,460.71 to avoid a truncation. Cycle wave c would be expected to last from one to several years, with a shorter time frame more likely.
A double flat or combination would expect a three wave structure downwards for cycle wave y to end about the same level as cycle wave a at 3,460.71. Cycle wave y would be expected to last from one to several years, with a longer time frame more likely. It could look like a repeat of cycle wave a.
There is divergence at the monthly chart level with MACD which supports this wave count.
Cycle wave b (or x) subdivides as a zigzag and is most likely incomplete. At 7,691 intermediate wave (5) would reach equality with intermediate wave (1).
I expect that intermediate wave (5) was typically very short following the barrier triangle of intermediate wave (4).
So far to the downside there is a leading expanding diagonal for a first wave, followed by a typically deep second wave correction which now looks to be incomplete.
Downwards movement for minute wave b is a clear three wave structure, and it is complete. Minor wave 2 looks like it is continuing as a larger expanded flat correction.
It is extremely likely that minute wave c will make at least a slight new high above the end of minute wave a at 6,833.67 to avoid a truncation. At 6,836 minute wave c would reach 1.618 the length of minute wave a. Minute wave a lasted a Fibonacci 13 days and minute wave b lasted a Fibonacci 8 days. Minute wave c may complete in a total Fibonacci 13 or 21 days, so the target at 6,833.67 may be reached in a further 9 or 17 days time.
Minor wave 2 may not move beyond the start of minor wave 1 above 6,894.88.
When minor wave 2 is finally complete then minor wave 3 downwards should show a strong increase in momentum, and must move well below the end of minor wave 1 at 6,643.62.
Love your work Laura, however it is likely that intermediate wave 5 is not complete imo