
Last analysis of FTSE expected downwards movement to complete a correction. The target was at 6,655.22. Downwards movement reached 6,643.62 (11.6 points below the target) and turned. I expect upwards movement from here to a mid term target about 6 – 8 weeks away at 7,271.
Click on charts to enlarge.
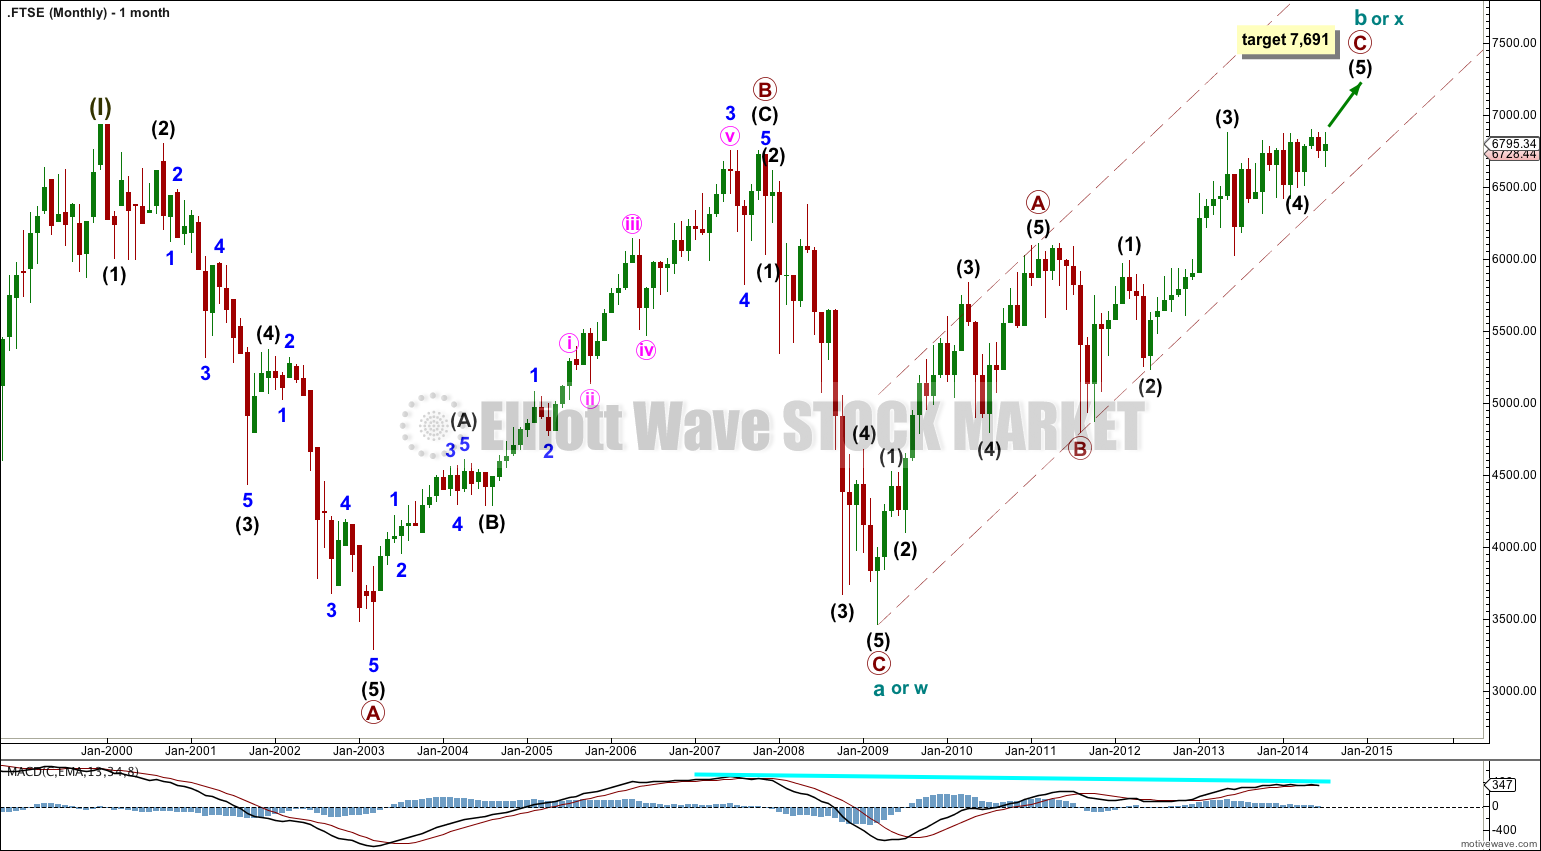
The bigger picture sees FTSE in a huge correction for a super cycle wave (II).
Super cycle wave (II) may be either a regular flat correction (labeled cycle a, b, c) or it may be a double flat or combination (labeled cycle w, x and y).
A regular flat correction would expect a five wave structure downwards for cycle wave c to move at least a little below the end of cycle wave a at 3,460.71 to avoid a truncation. Cycle wave c would be expected to last from one to several years, with a shorter time frame more likely.
A double flat or combination would expect a three wave structure downwards for cycle wave y to end about the same level as cycle wave a at 3,460.71. Cycle wave y would be expected to last from one to several years, with a longer time frame more likely. It could look like a repeat of cycle wave a.
There is divergence at the monthly chart level with MACD which supports this wave count.
Cycle wave b (or x) subdivides as a zigzag and is most likely incomplete. At 7,691 intermediate wave (5) would reach equality with intermediate wave (1).
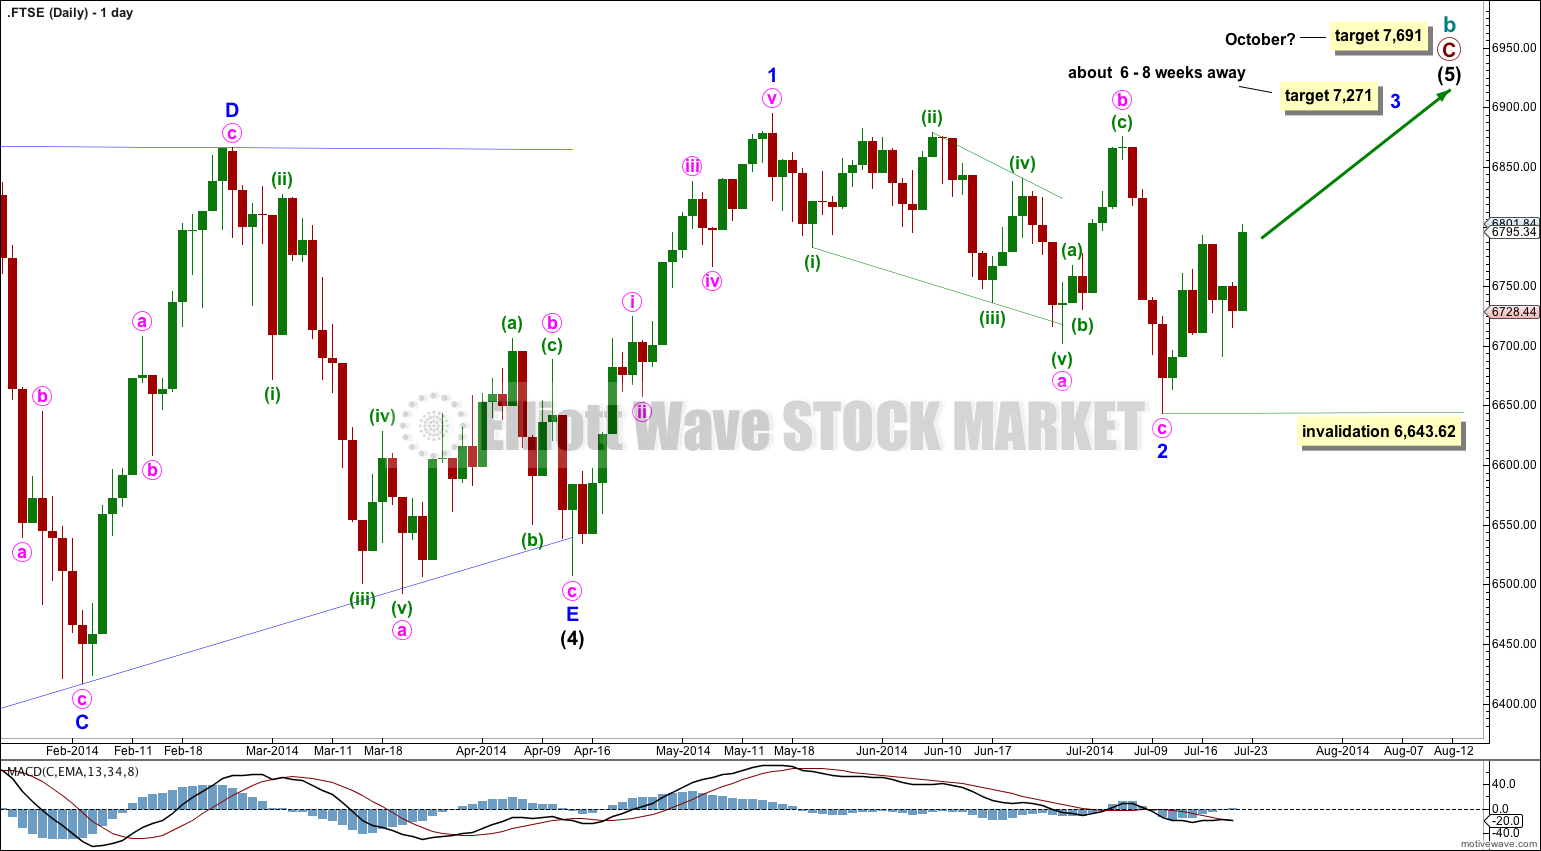
Intermediate wave (5) has begun. Sideways movement since the end of minor wave 1 at 6,894.88 is very corrective, and minor wave 2 subdivides perfectly as a zigzag. There is nice alternation within minor wave 2: minute wave a is a leading contracting diagonal and minute wave c is a swift impulse.
At 7,271 minor wave 3 would reach 1.618 the length of minor wave 1.
Intermediate wave (5) would reach equality in length with intermediate wave (1) at 7,691. Intermediate wave (5) lasted seven months. So far intermediate wave (1) is in its fourth month. In another three months it may end at equality in duration with intermediate wave (1).
Upwards movement from the low at 6,643.62 is a clear five on the hourly chart. This adds confidence to this wave count.
If price breaks below 6,643.62 then minor wave 2 may be continuing as a double zigzag, flat or combination. The invalidation point would move down to 6,507.08. However, at this stage I would consider this unlikely.
Lara, what would you need to see to revisit your June 26th count which I think indicated the FTSE topped in May with green b at 6895 versus forecast for an extension beyond this. Thank you