
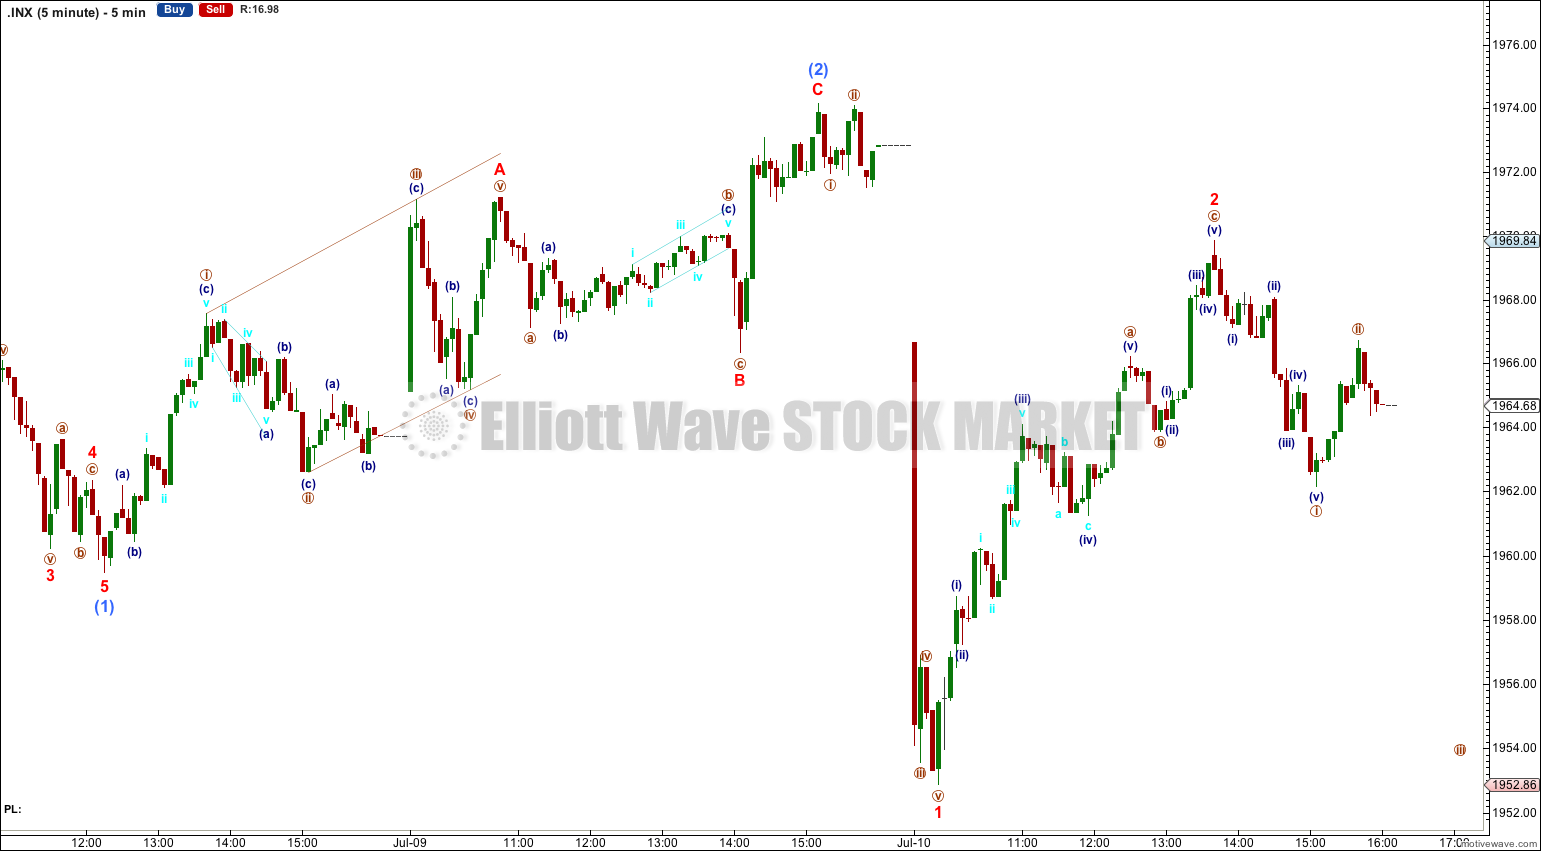
Yesterday’s analysis had allowed for a correction for a small second wave to show up as a doji or green candlestick, and so the green candlestick for Wednesday’s session was anticipated.
The Elliott wave count remains the same.
Summary: I expect downwards movement to continue for a few days to a target at 1,924. I have an alternate which expects a continuation of upwards movement, and it would be confirmed with movement above 1,985.59. For tomorrow I expect to see some increase in downwards momentum to a short term target at 1,935.
Click on charts to enlarge.
The aqua blue trend lines are critical. Draw the first trend line from the low of 1,158.66 on 25th November, 2011 to the next swing low at 1,266.74 on 4th June, 2012. Create a parallel copy and place it on the low at 1,560.33 on 24th June, 2013. While price remains above the lower of these two aqua blue trend lines we must assume the trend remains upwards. This is the main reason for the bullish wave count being my main wave count.
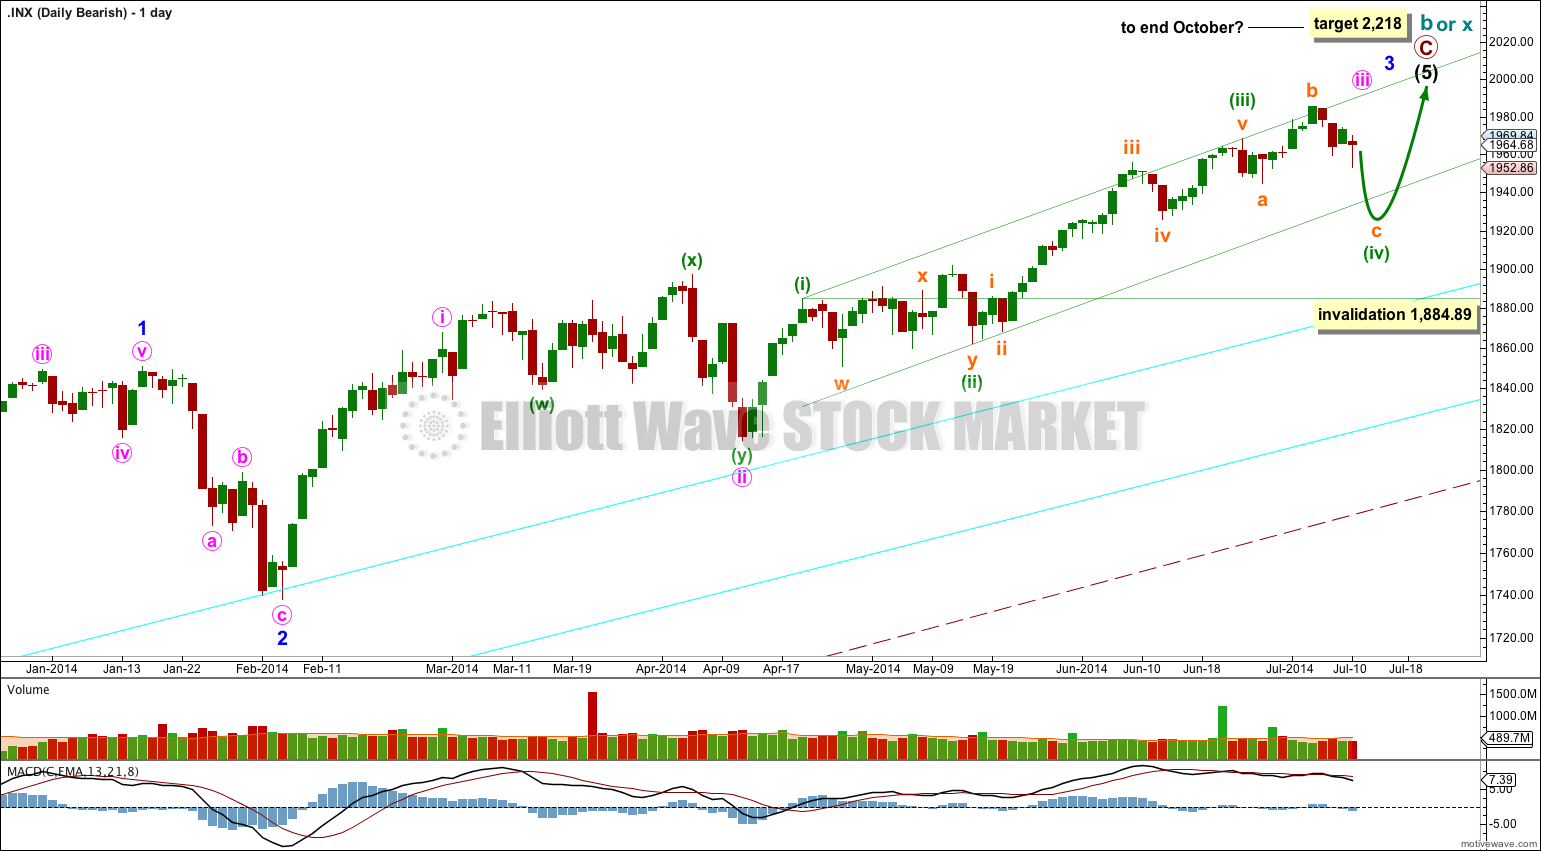
Bullish Wave Count.
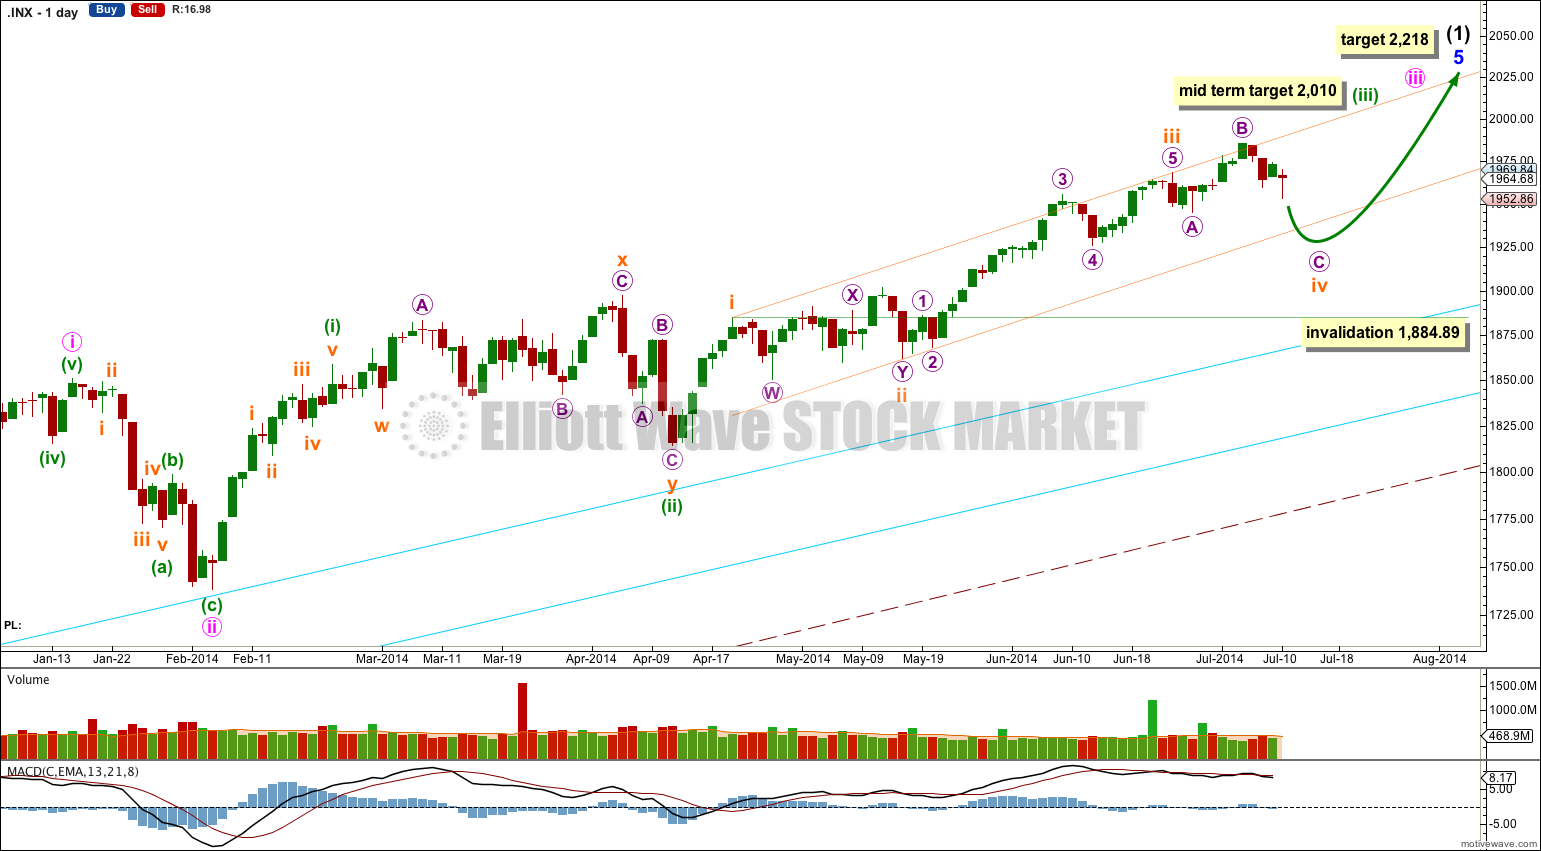
There are a couple of things about this wave count of which I am confident. I see minor wave 3 within intermediate wave (1) as over at 1,729.86 (19th September, 2013). It has the strongest upwards momentum and is just 0.76 longer than 2.618 the length of minor wave 1. At 455 days duration this is a remarkably close Fibonacci ratio. The subdivisions within it are perfect. If this is correct then minor wave 4 ends at 1,646.47 and this is where minor wave 5 begins.
Minor wave 5 may be only one of two structures: a simple impulse or an ending diagonal. At this stage an ending diagonal looks less likely, and most recent upwards movement is looking like a third wave so a more common impulse is more likely.
Along the way up towards the final target I would expect to see three more corrections complete. The first for subminuette wave iv is most likely to be somewhat in proportion to subminuette wave ii which lasted 17 days. So far subminuette wave iv has lasted only 11 days and is very likely to continue.
Subminuette wave iv may not move into subminuette wave i price territory below 1,884.89.
At 2,010 minuette wave (iii) would reach 1.618 the length of minuette wave (i).
At 2,218 minor wave 5 would reach equality in length with minor wave 3. This target may be met in October.
I have drawn a parallel channel about minuette wave (iii) using Elliott’s first technique: draw the first trend line from the highs of subminuette waves i to iii, then place a parallel copy on the low of subminuette wave ii. The upper edge of this channel is slightly overshot, and this may indicate an overshoot on the opposite side may happen when subminuette wave iv ends.
There is still divergence with price trending higher and MACD trending lower on the weekly chart, and a little on the daily chart for most recent movement. This classic technical divergence indicates that a correction should unfold.
The large maroon – – – channel is copied over from the weekly chart. It is drawn in exactly the same way on bull and bear wave counts. For the bull wave count this channel is termed a base channel about primary waves 1 and 2. A lower degree second wave should not breach the lower edge of a base channel drawn about a first and second wave one or more degrees higher. The lower maroon – – – trend line differentiates the bull and bear wave counts.
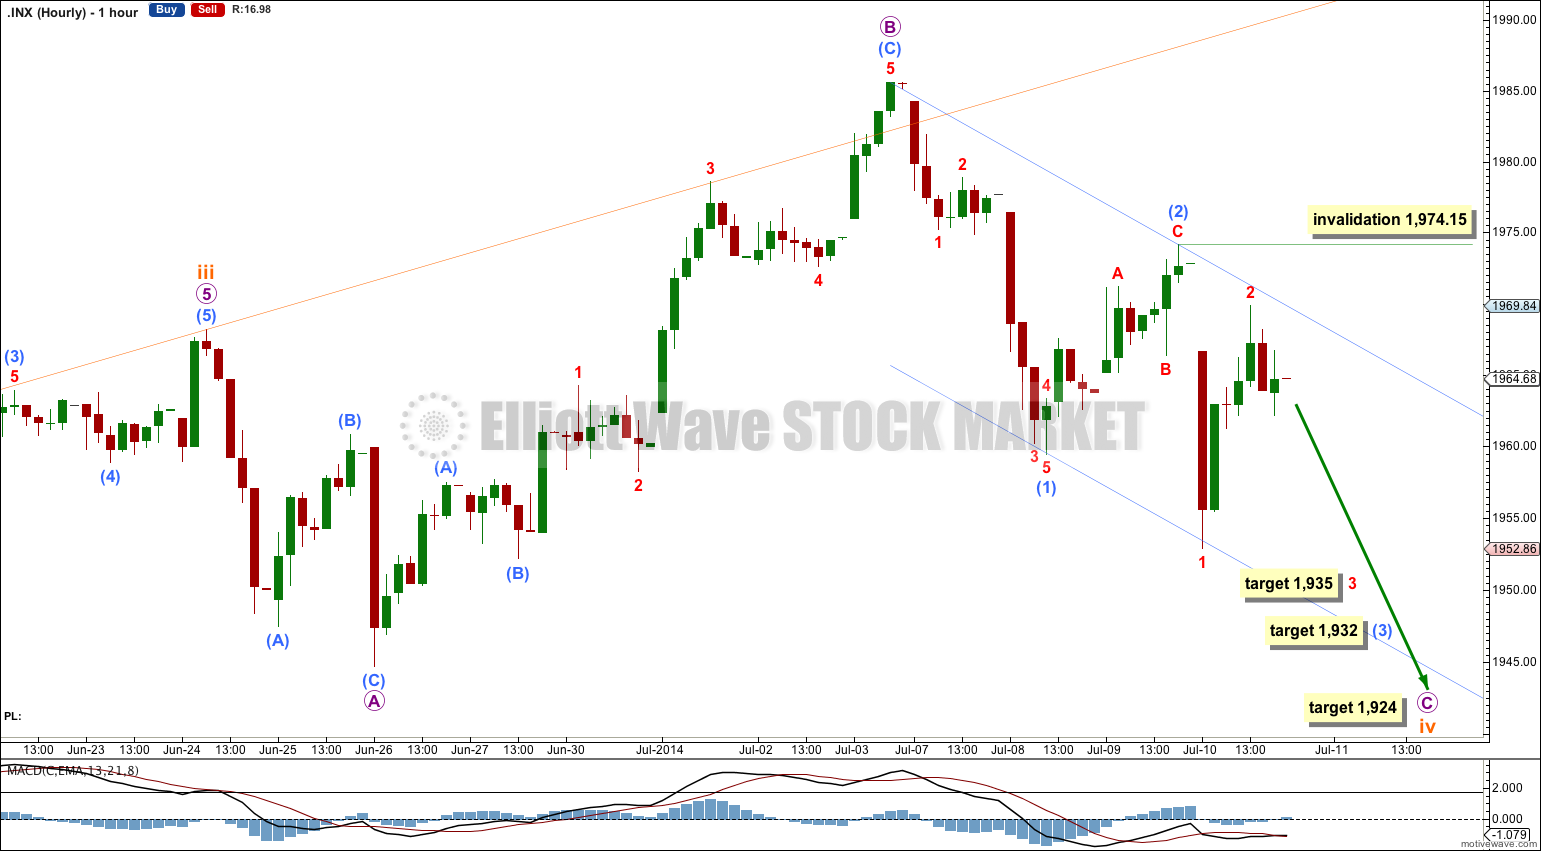
Subminuette wave iv may be unfolding as an expanded flat correction; micro wave B within it is a 174% correction of micro wave A. This is longer than the maximum common length of 138% but still entirely viable.
The overshoot of the upper edge of the channel may indicate an overshoot of the lower edge to come.
At 1,924 micro wave C would reach 2.618 the length of micro wave A. This could see subminuette wave iv slightly overshoot the channel at the lower edge.
Within micro wave C the third wave has begun. I would expect to see a strong increase in downwards momentum tomorrow as this middle of a third wave unfolds downwards.
I have drawn a base channel about submicro waves (1) and (2). Along the way down upwards corrections should find resistance at the upper edge of this base channel. A breach of the upper edge of this channel would put significant doubt on this wave count at this stage.
At 1,935 minuscule wave 3 would reach 1.618 the length of minuscule wave 1.
At 1,932 submicro wave (3) would reach 1.618 the length of submicro wave (1).
Tomorrow when markets open if minuscule wave 2 moves higher (which is possible but I would judge it to be unlikely) then it may not move beyond the start of minuscule wave 1 above 1,974.15.
Overall this wave count expects a continuation of downwards movement for a few days yet, with one more upwards correction along the way.
Alternate Bullish Wave Count.
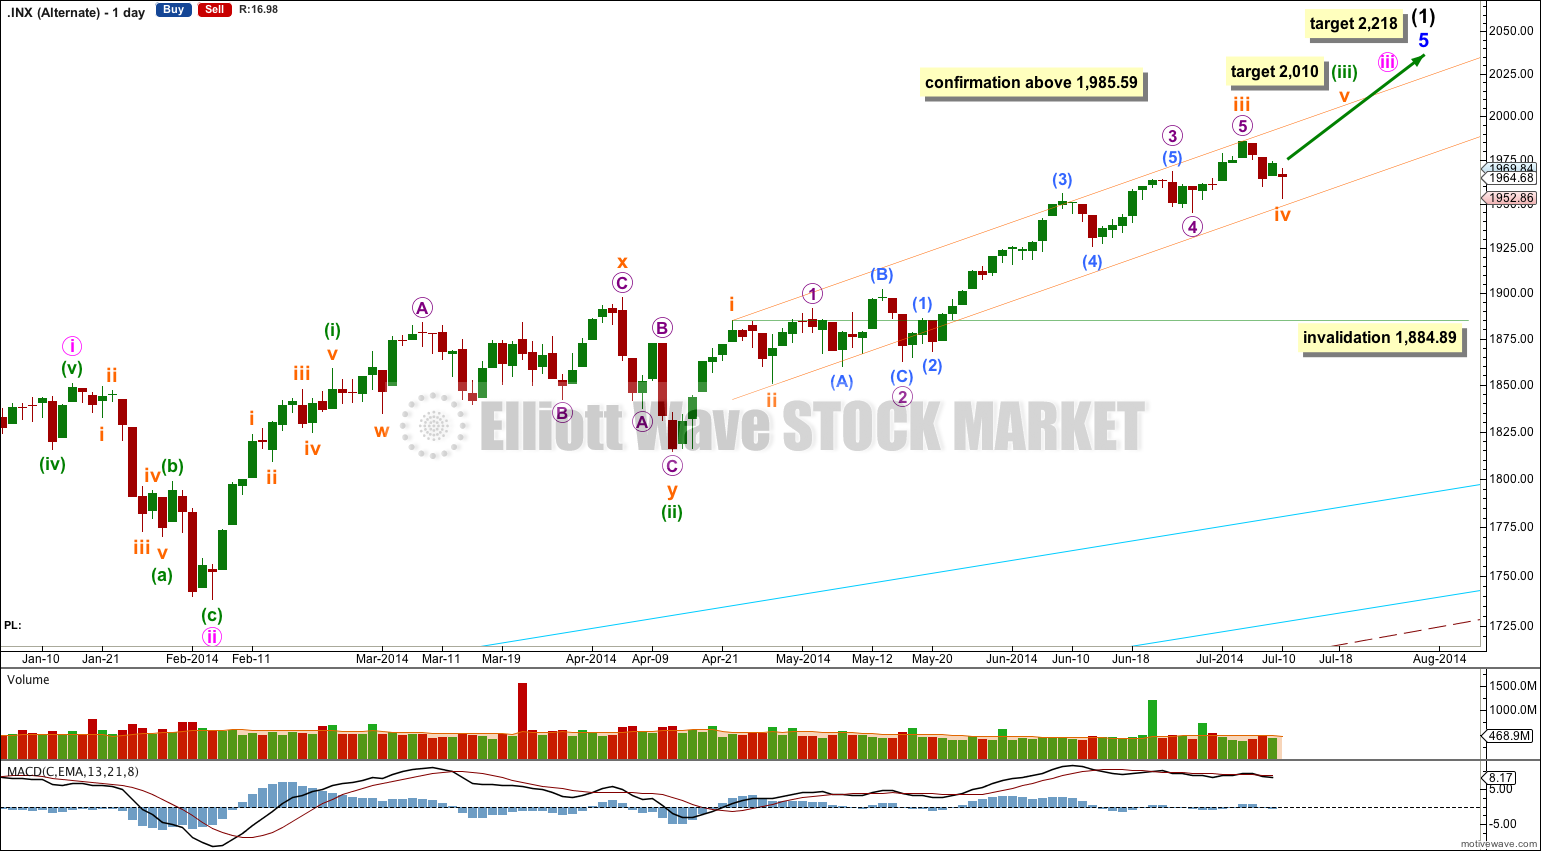
I have adjusted this alternate wave count today. It is possible that subminuette wave iv is complete, as a zigzag that’s nicely in proportion with subminuette wave ii (both waves lasted four days).
Within subminuette wave iii this wave count sees micro wave 2 as a very rare running flat correction. Normally running flats only show up in the middle of very strong movements, but this one is not exactly in the middle of a very strong movement. This reduces the probability significantly for this wave count.
At this stage this wave count would be confirmed with a new high above 1,985.59. If this price point is passed my target for the trend to be interrupted by the next fourth wave correction is 2,010. At that point minuette wave (iii) would reach 1.618 the length of minuette wave (i).
Bearish Alternate Wave Count.
This bearish alternate wave count expects that the correction is not over. The flat correction which ended at 666.79 was only cycle wave a (or w) of a larger super cycle second wave correction.
The structure and subdivisions within primary wave C for the bear wave count are the same as for intermediate wave (1) for the bull wave count. Thus the short to mid term outlook is identical.
The differentiation between the bull and bear wave count is the maroon – – – channel. The bull wave count should see price remain above the lower maroon – – – trend line. The bear wave count requires a clear breach of this trend line. If this trend line is breached by a full weekly candlestick below it and not touching it then this bear wave count would be my main wave count and I would then calculate downwards targets.
We should always assume the trend remains the same until proven otherwise; the trend is your friend. While price remains above the lower maroon – – – trend line I will assume that the S&P 500 remains within a bull market.
This analysis is published about 10:50 p.m. EST.
Time is running out for this bearish wave 3 to play out. We where supposed to have a big move down today, we didn’t. If the market doesn’t sell hard on monday, that is it. You can then consider the wave invalidated. Because on tuesday we got Retail Sales and Yellen is speaking. Every time Yellen speaks we get a big move up in the market, maybe 15 to 20 points in the S&P 500. And if the market doesn’t sell hard on monday that’s it. Wave count invalid. I’ll have no choice but to close my shorts and open longs. Monday is kind of light on economic news, we got Citi earnings which I expect it to be weak. So maybe we go a little sideways on monday if nothing happens in Europe over the weekend. Which would indeed invalidate the wave count on my books. No point on staying short ahead of strong retail sales and Yellen ultra bullish speach. Does it is consider in the wave counts? Cheers
No…not the bearish nest of 1’s & 2’s count. Futures are up small and I think the channel gets broken upward once again but stops short of ATH. Leaning towards this being some type of B wave eventually reversing towards a target of 1924.