
Yesterday’s Elliott wave analysis of SPX expected downwards movement towards a target at 1,912. This is not what happened. Upwards movement again has fallen short of the invalidation point.
Summary: In the short term I expect a little upwards movement to end between 1,945 to 1,950. Thereafter, downwards movement should resume.
Click on charts to enlarge.
The aqua blue trend lines are critical. Draw the first trend line from the low of 1,158.66 on 25th November, 2011 to the next swing low at 1,266.74 on 4th June, 2012. Create a parallel copy and place it on the low at 1,560.33 on 24th June, 2013. While price remains above the lower of these two aqua blue trend lines we must assume the trend remains upwards. This is the main reason for the bullish wave count being my main wave count.
Bullish Wave Count.
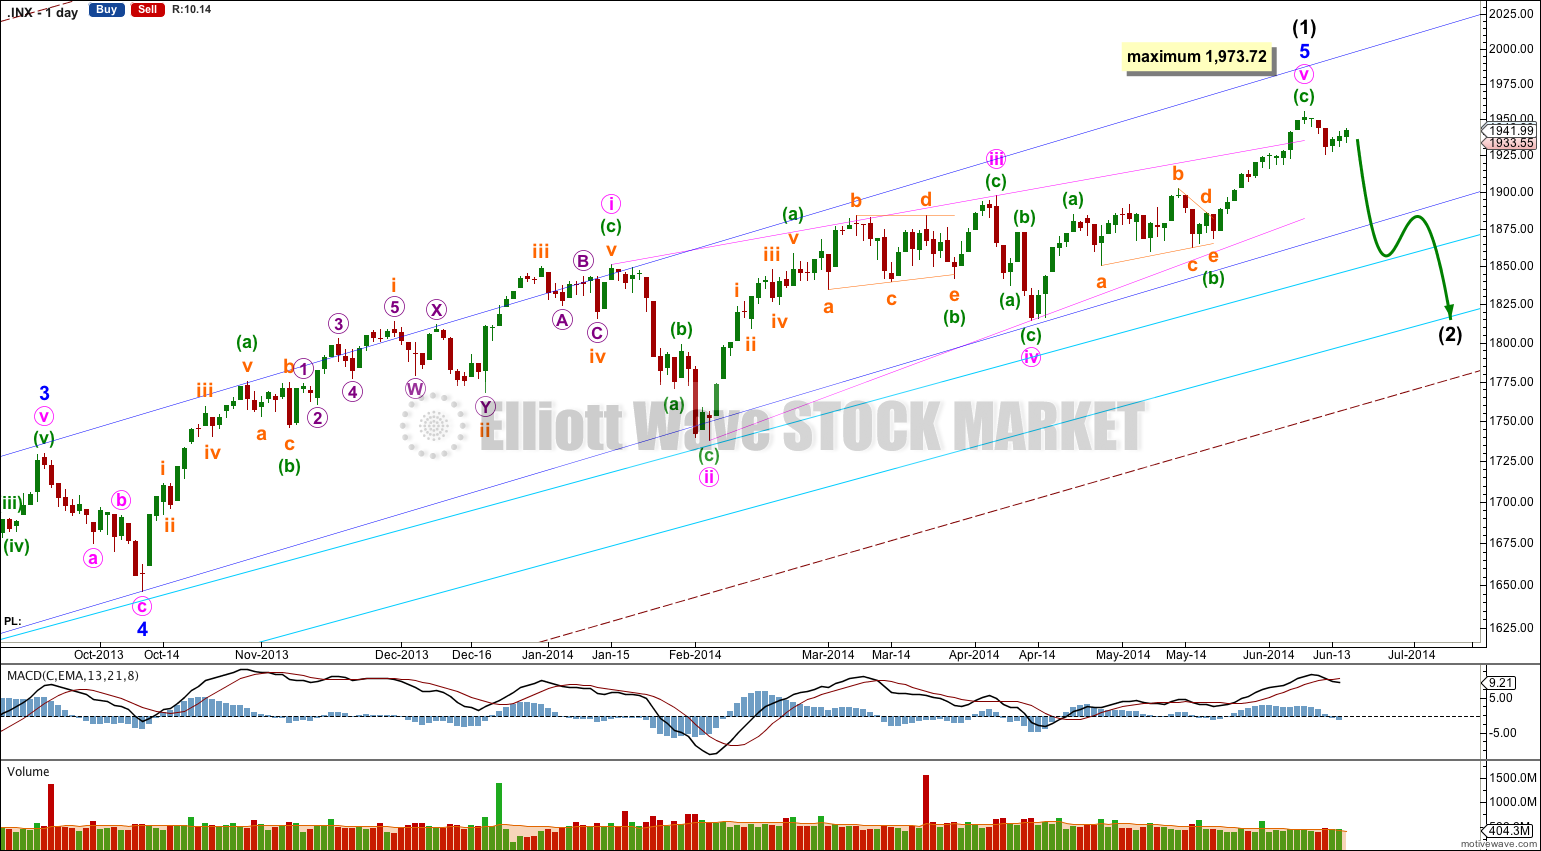
This bullish wave count expects a cycle degree correction was over at 666.79 for a fourth wave, and a new cycle degree bull market began there for a fifth wave. Within cycle wave V primary waves 1 and 2 are complete. Within primary wave 3 intermediate wave (1) may be just now complete.
Minor wave 5 is a complete ending contracting diagonal. Within an ending diagonal all the subwaves must be single zigzags, and the fourth wave should overlap first wave price territory.
The final fifth wave of this diagonal may have ended with an overshoot the upper i-iii trend line of the contracting diagonal. This is the most common place for fifth waves of ending contracting diagonals to end. This gives the wave count a very typical look, if it is over here.
The diagonal is contracting because minute wave iii is shorter than minute wave i. Minute wave v may not be longer than equality with minute wave iii at 1,973.72 because a third wave may never be the shortest wave. At this stage it is not confirmed that the final fifth wave of the diagonal is over.
There is still divergence with price trending higher and MACD trending lower. This classic technical divergence supports this wave count and indicates that at least a reasonably sized correction should arrive soon. By reasonably sized I mean in fitting with this bullish wave count: Intermediate wave (2) should last at least two or four weeks, probably longer, and should not breach the lower aqua blue trend line nor the lower edge of the maroon – – – channel. The wave count remains bullish at primary degree.
This upwards movement does not now look like a fourth wave within a continuing impulse. This looks like a separate wave.
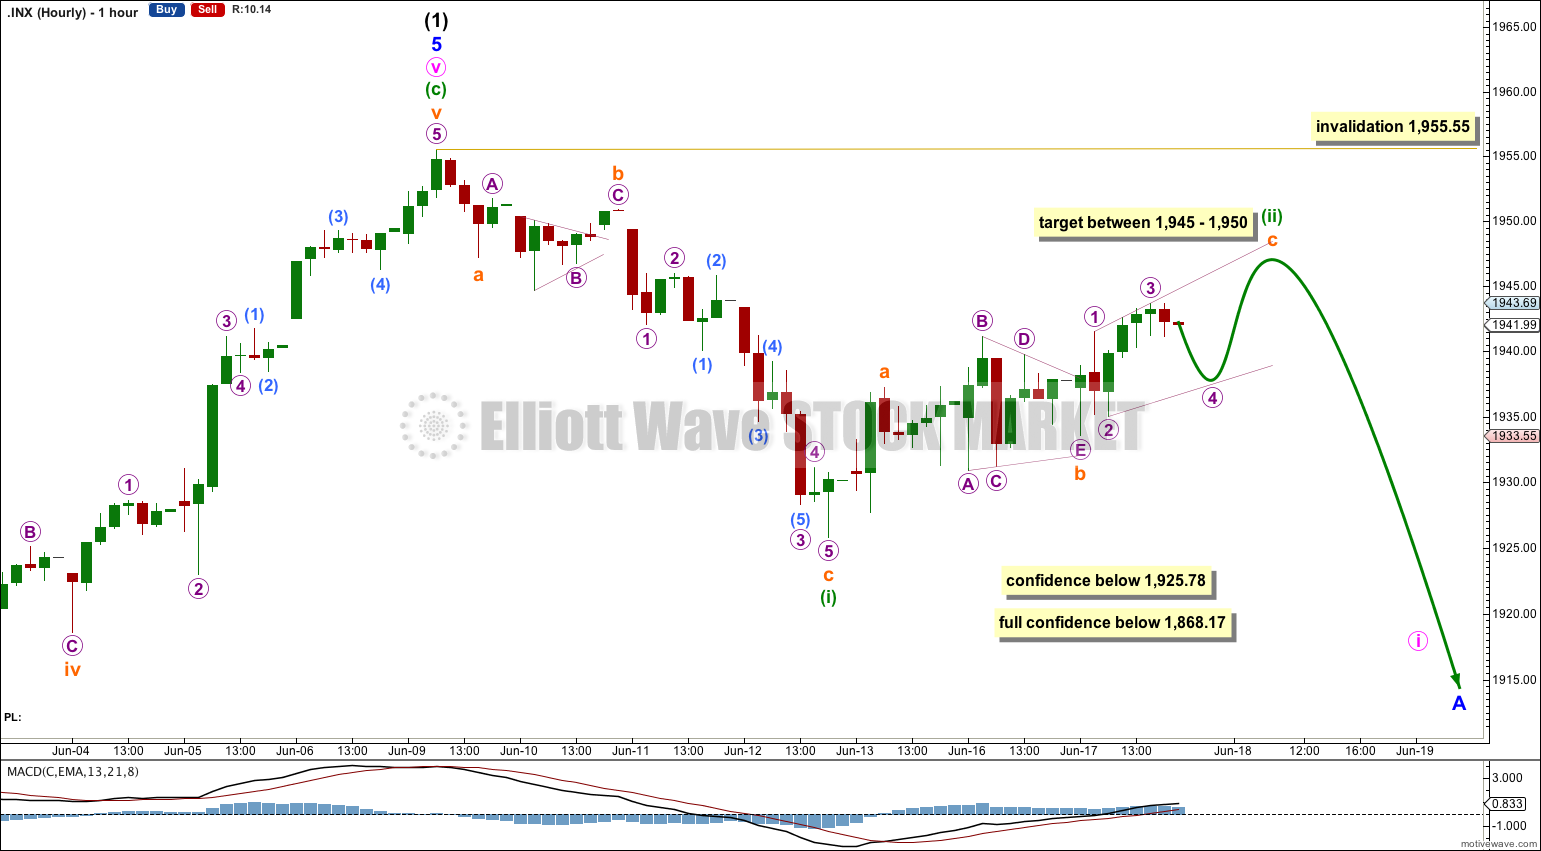
There are two possible structures which may unfold to the downside to begin the new intermediate wave (2) trend: either an impulse which is much more common or a leading diagonal which is not very common. A leading diagonal requires subwaves 2 and 4 to be zigzags, while subwaves 1, 3 and 5 are most commonly zigzags but may also be impulses. Because the first downwards wave to the low at 1,925.78 does not subdivide well as a five wave structure but does fit nicely as a three then the first wave down may be unfolding as the less common leading diagonal.
Within this possible leading diagonal of minute wave i minuette wave (i) is complete and minuette wave (ii) is most likely incomplete.
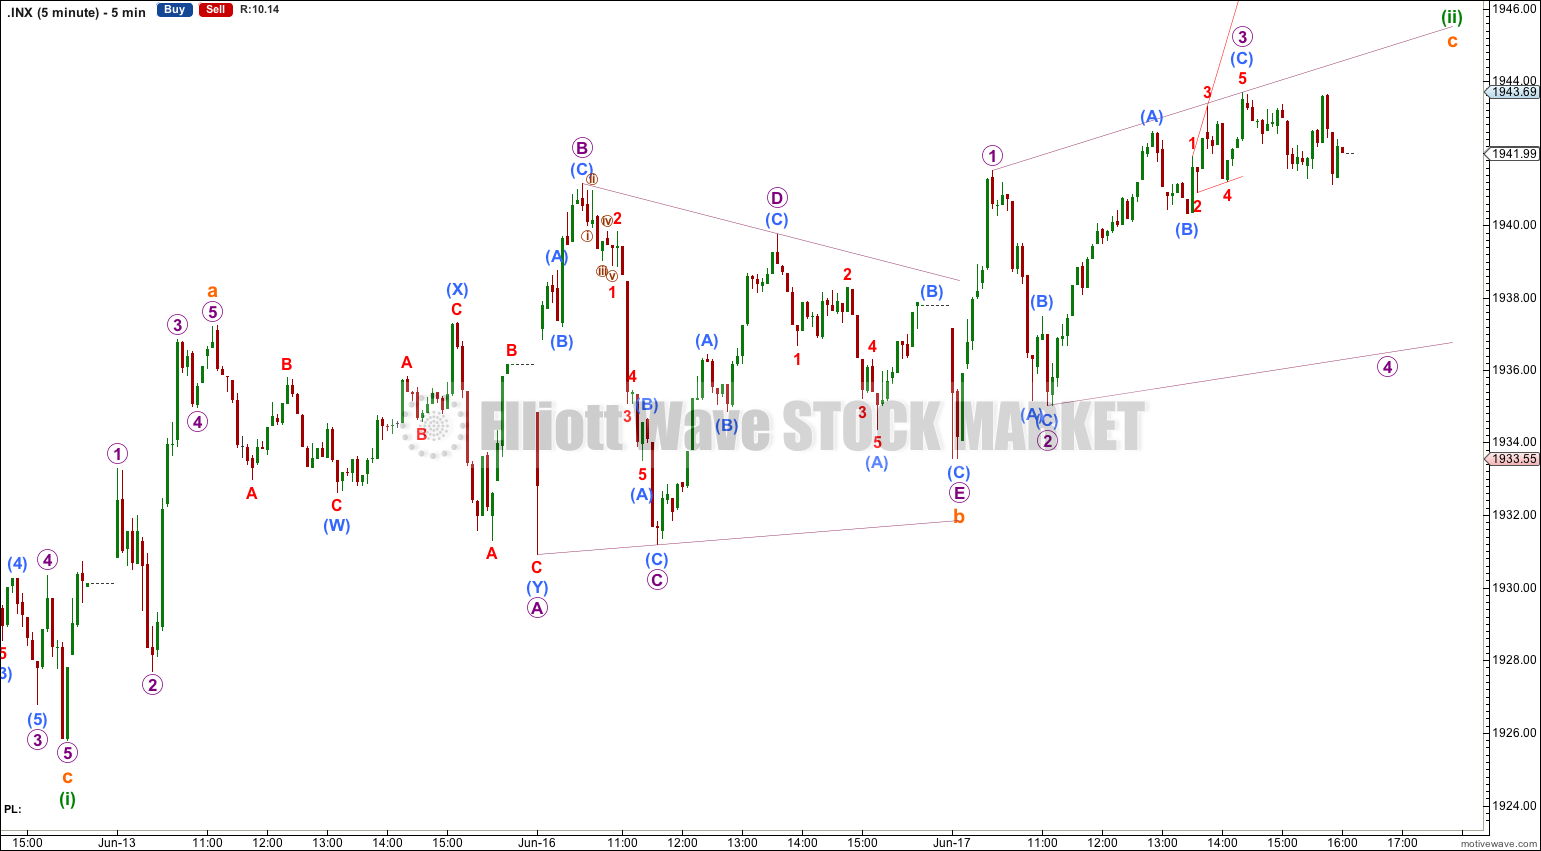
The most common length for second and fourth waves within diagonals is between 0.66 to 0.81 the length of the prior wave. Minuette wave (ii) is most likely to end between 1,945 to 1,950 the length of minuette wave (i). The structure for minuette wave (ii) looks incomplete on the five minute chart. I will expect it to move a little higher tomorrow to complete.
Thereafter, minuette wave (iii) downwards should unfold. It may be either an impulse or a zigzag. Within leading diagonals it is often the third wave which unfolds as an impulse, if one of the actionary waves does.
Minuette wave (ii) may not move beyond the start of minuette wave (i) above 1,955.55.
Movement below 1,925.78 at this stage would provide confidence in this wave count. At that stage the downwards wave labeled minuette wave (i) would not be the total correction and the correction would have to be continuing.
Finally movement below 1,868.17, the beginning of minuette wave (c) as the last upwards wave to the high of intermediate wave (1), would provide full and final confidence in a trend change at intermediate degree. At that stage minuette wave (c) would have to be over.
Bearish Alternate Wave Count.
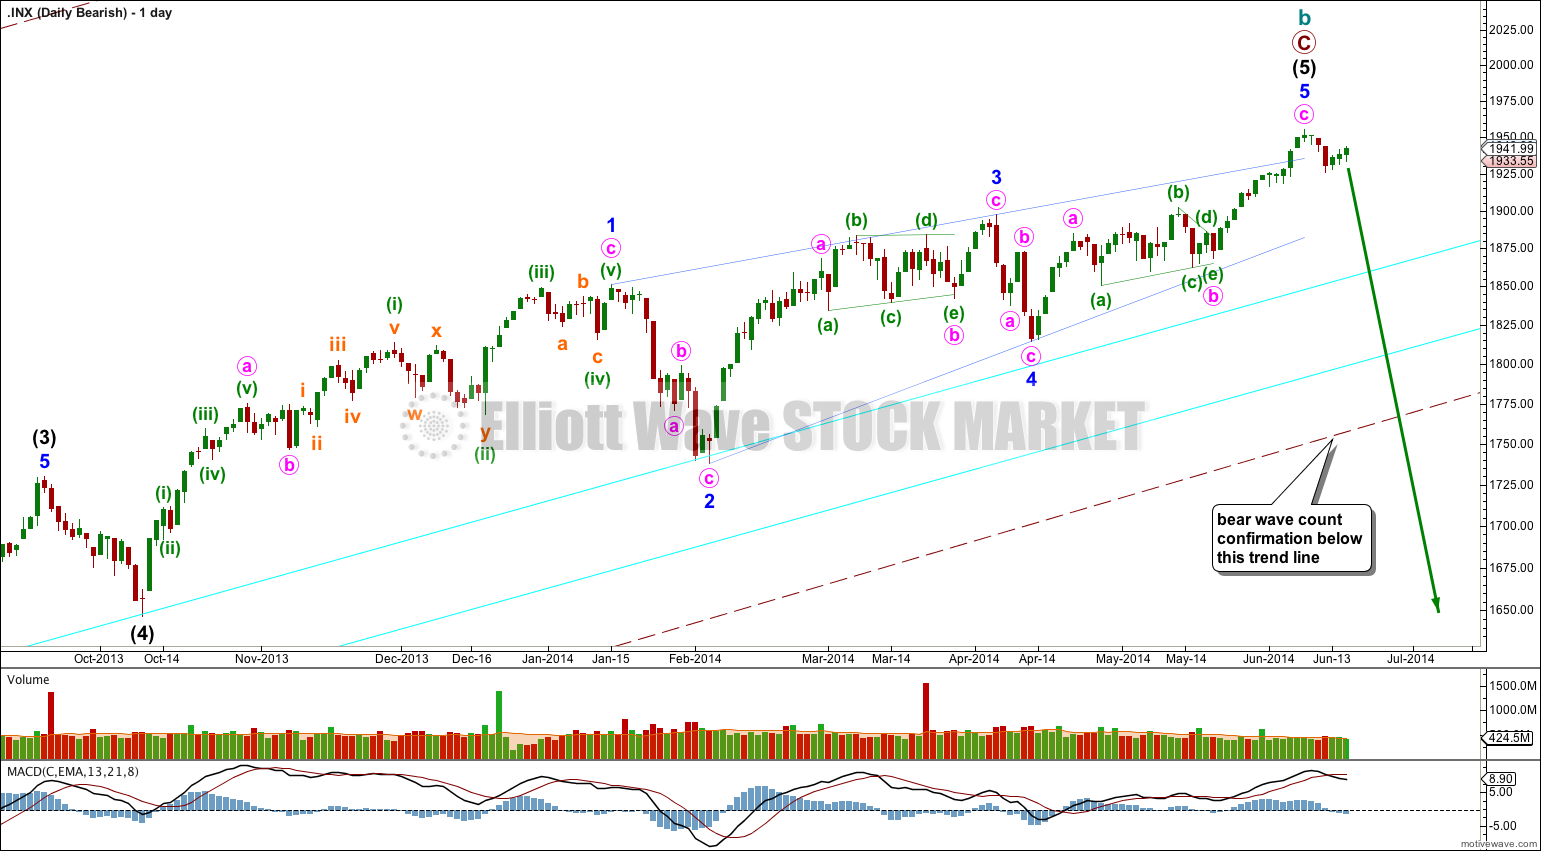
This bearish alternate wave count expects that the correction is not over. The flat correction which ended at 666.79 was only cycle wave a of a larger super cycle second wave correction.
Cycle wave b is now longer than the maximum common length of 138% for a B wave of a flat correction, at 149%.
Cycle wave b may again be a complete zigzag structure.
A clear breach of the large maroon – – – channel on the monthly and weekly charts is required for confirmation of this wave count. If that happens then this would be my main wave count and would be strongly favoured. Only once this wave count is confirmed will I calculate downwards targets for cycle wave c for you; it would be premature to do that prior to confirmation.
This analysis is published about 07:00 p.m. EST.
This is off topic of Elliot, but it seems like we might get a new high or very close, and if we do, I think we’ll get the RSI divergence on the daily chart that we like to see. just my not so educated prediction.