
I had expected a continuation of upwards movement for Wednesday, with a slowing of momentum. This is not what happened. Price moved lower. Although price remains above the invalidation point on yesterday’s hourly wave chart, the red candlestick for Wednesday’s session necessitates a reanalysis of recent movement.
Summary: I expect for the short term outlook tomorrow to see a little more downwards movement to end about 1,880.37. This may take most or all of tomorrow’s session. In the mid term it is likely we shall see more upwards movement. The target is 1,938.
This analysis is published about 06:05 p.m. EST. Click on charts to enlarge.
Bullish Wave Count.
The aqua blue trend lines are critical. Draw the first trend line from the low of 1,158.66 on 25th November, 2011 to the next swing low at 1,266.74 on 4th June, 2012. Create a parallel copy and place it on the low at 1,560.33 on 24th June, 2013. While price remains above the lower of these two aqua blue trend lines we must assume the trend remains upwards. This is the main reason for the bullish wave count being my main wave count.
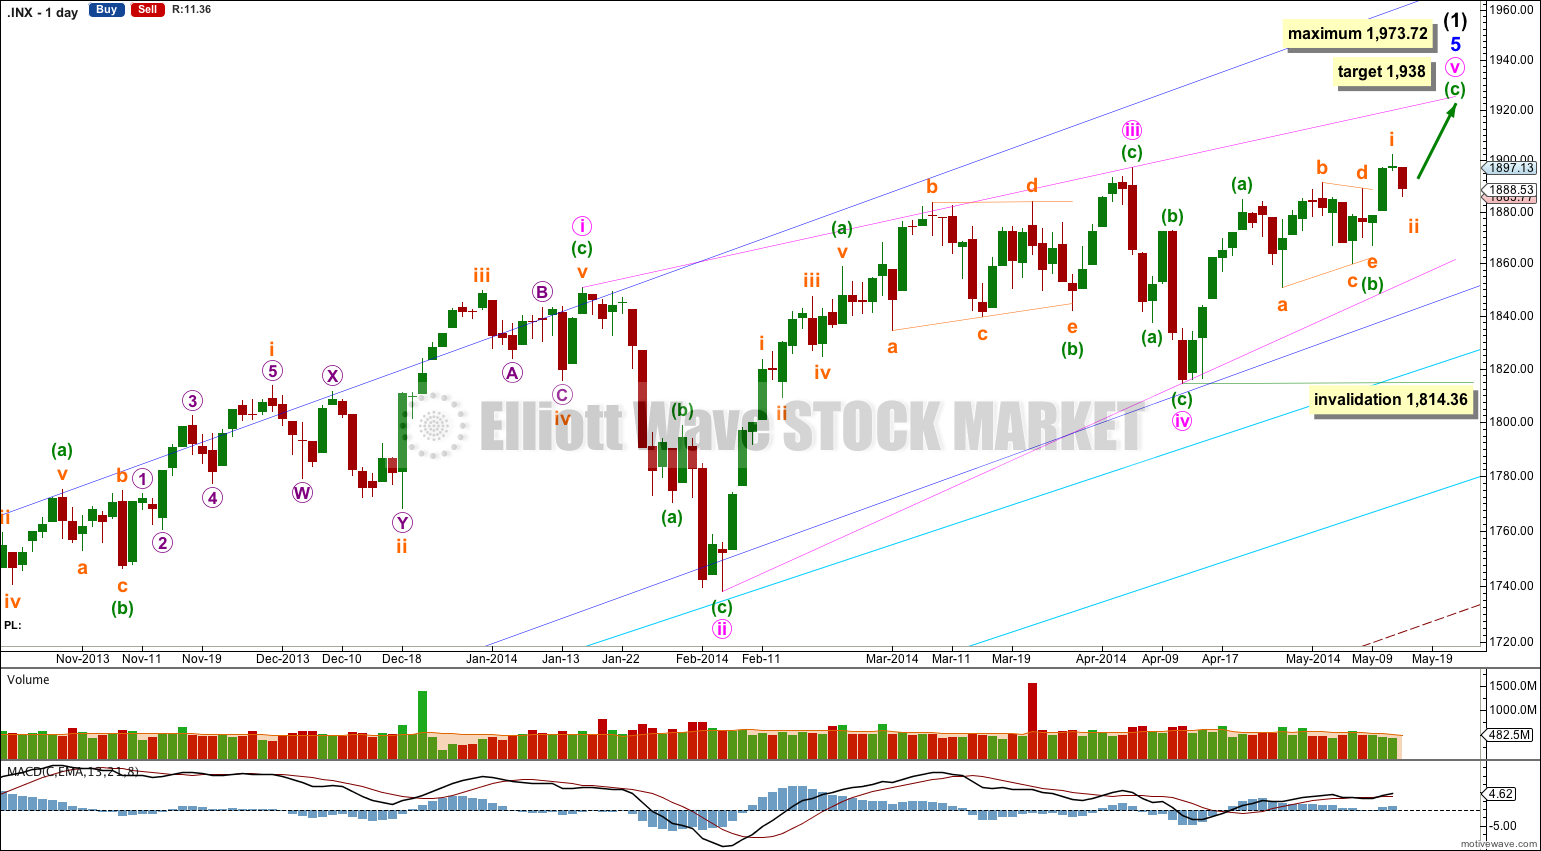
This bullish wave count expects a new bull market began at 666.79 for a cycle wave V. Within cycle wave V primary waves 1 and 2 are complete. Within primary wave 3 intermediate wave (1) is incomplete.
Within intermediate wave (1) the final fifth wave of minor wave 5 is an almost complete ending contracting diagonal. Although minute waves ii and iv within the diagonal are shallower than normal, all the subdivisions fit perfectly. The diagonal is contracting and the final fifth wave may not be longer than equality with the third at 1,973.72.
Within an ending diagonal all the subwaves may only subdivide as single zigzags. The fourth wave should overlap back into first wave price territory. Minute wave v should end when price comes to touch the upper 1-3 trend line of the diagonal. Alternately, it may overshoot this trend line, but that has a lower probability.
Within the final fifth wave of this diagonal, minute wave v, at 1,938 minuette wave (c) would reach equality in length with minuette wave (a).
Within the zigzag of minute wave v minuette wave (b) may not move beyond the start of minuette wave (a) at 1,814.36.
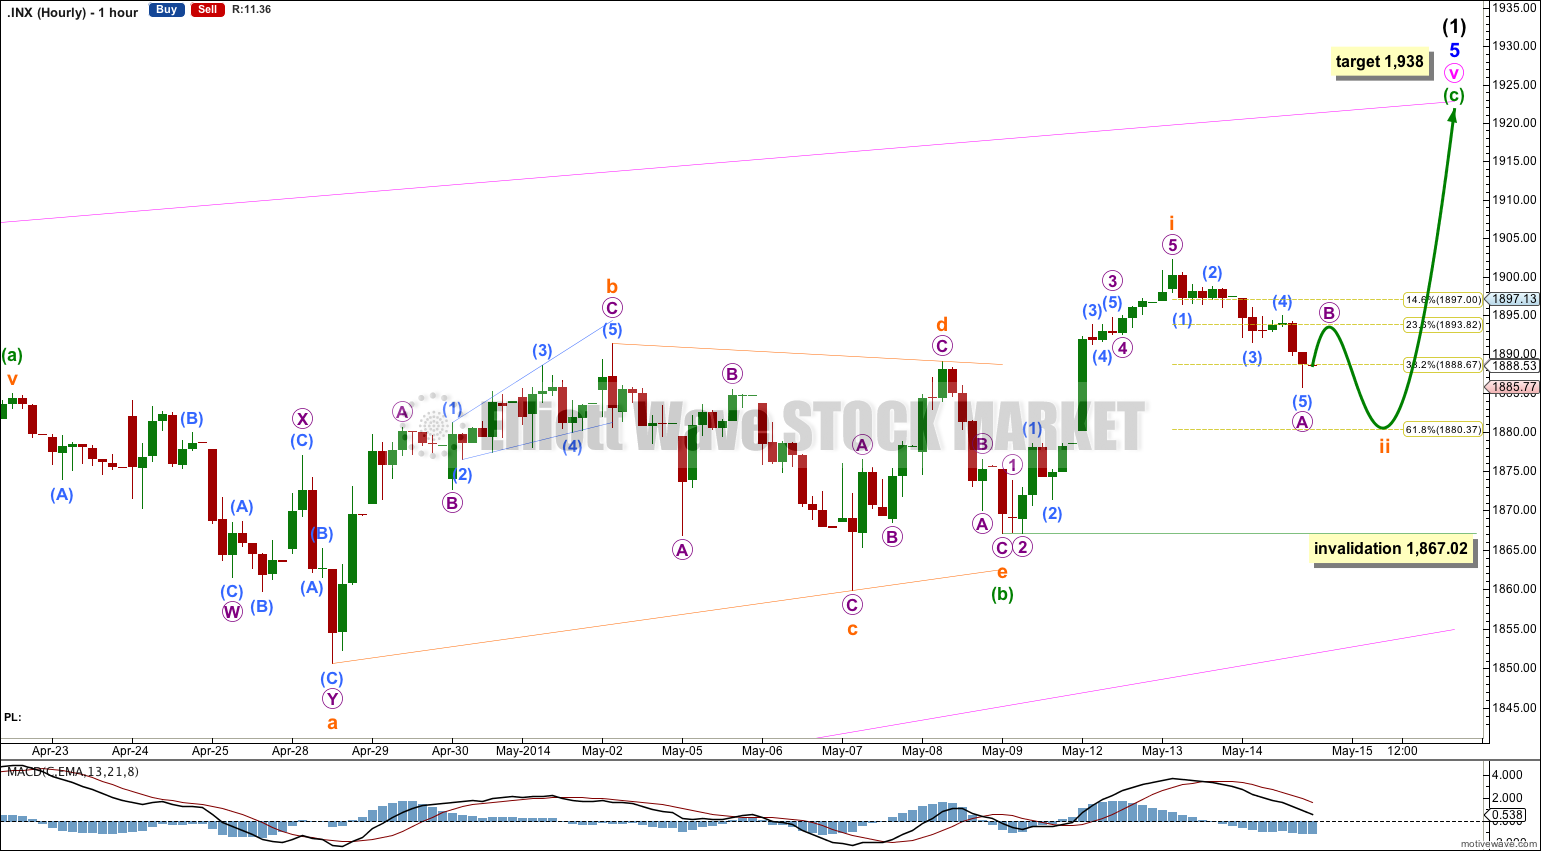
Downwards movement for Wednesday’s session breached the small parallel channel I had drawn about prior upwards movement. This is not a fourth wave correction and must be a second wave correction.
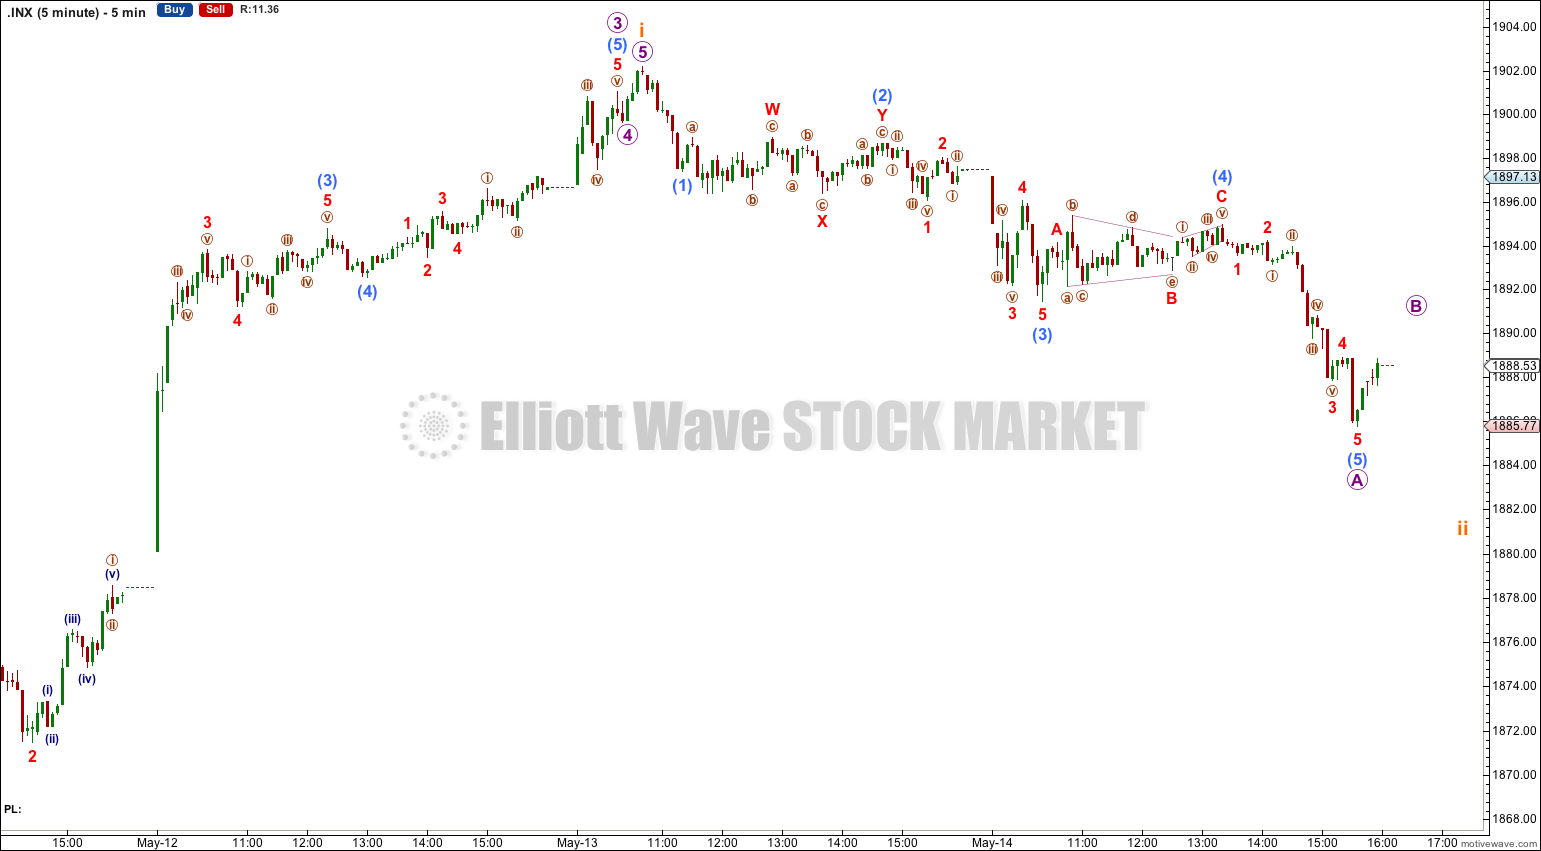
Within minuette wave (c) subminuette wave i is a complete impulse. Subminuette wave ii is an incomplete zigzag and so far there is only a five down for micro wave A.
Micro wave B should move a little higher because it looks incomplete on the five minute chart. It may end about the 0.236 Fibonacci ratio of subminuette wave i about 1,893.82.
Thereafter micro wave C downwards is most likely to move below the end of micro wave A at 1,885.77 to avoid a truncation. It may end about the 0.618 Fibonacci ratio about 1,880.37.
When subminuette wave ii is a complete corrective structure then I would expect to see a third wave up to new all time highs which shows an increase in upwards momentum.
Subminuette wave ii may not move beyond the end of subminuette wave i below 1,867.02.
Bearish Alternate Wave Count.
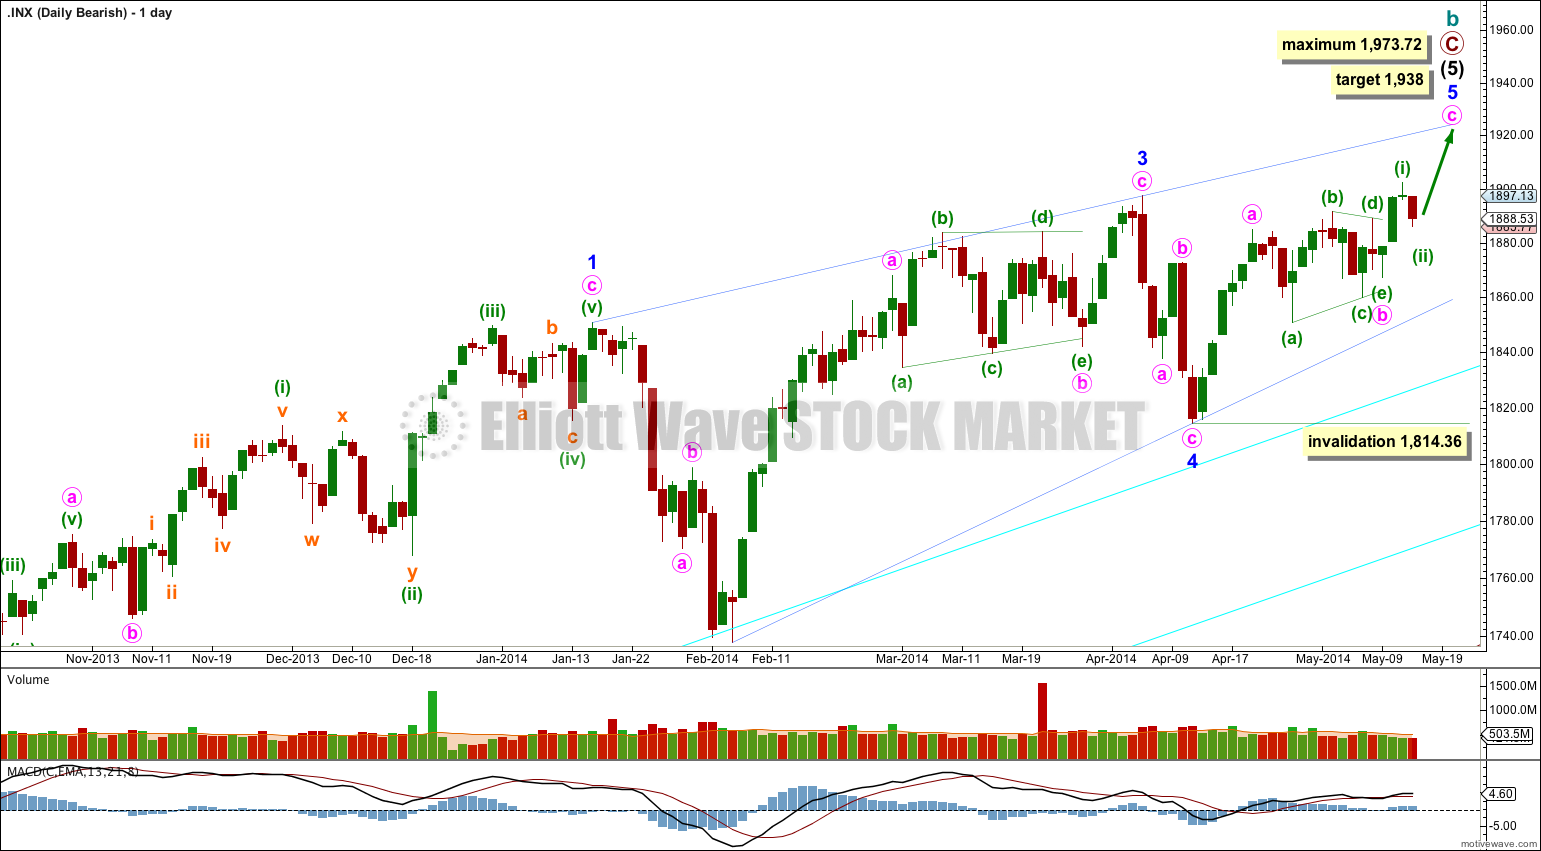
This bearish wave count expects that the correction was not over at 666.79, and that may have been just cycle wave a of a huge expanded flat for a super cycle wave II. Cycle wave b upwards is a close to complete zigzag.
Within flat corrections the maximum common length of B waves in relation to A waves is 138%. So far cycle wave b is a 141% correction of cycle wave a. For this reason also this wave count is an alternate.
Within primary wave C the subdivisions are seen here in exactly the same way as the main wave count, both are seen as incomplete five wave impulses with the final fifth wave an almost complete ending contracting diagonal. This bearish wave count would expect a cycle degree trend change to come in a few days.
Alternatively, it is possible that primary wave C is not close to completion. There are several ways to see the many subdivisions within this long movement. The depth of the next downwards correction will tell us what degree the trend change may be: if downwards movement breaches the lower of the two aqua blue trend lines by more than 3% of market value then I would consider a trend change at cycle degree, and if downwards movement breaches the lower edge of the wider maroon – – – channel on the monthly chart then a cycle degree trend change would be confirmed.
Hi Lara,
Today SPX made 1862 new low . Does this mean ED ended at 1902 invalidating the main wavecount?
Can you please post both bearish and bullish alternative counts , so we’re better informed of the direction.
Thx