
Upwards movement continued as expected almost touching the target.
The wave count remains the same.
Summary: Minor wave 2 may end during tomorrow’s session. I am expecting a trend change tomorrow and a red candlestick to complete the session.
Click on the charts below to enlarge.
Main Bearish Wave Count.
This wave count has a higher probability than the bullish alternate. Upwards movement over the last 4 years and 11 months subdivides best as a zigzag. If something is “off” about the supposed recovery then it must be a B wave because there is plenty that is off in this scenario in terms of social mood.
It is possible that cycle wave b is over and that there has been a trend change at cycle degree (bearish wave count) or intermediate wave degree (bullish alternate below). On the monthly chart there is a bearish engulfing candlestick pattern indicating a new bear market has just begun.
There is now a clear five down on the daily chart. This is indication of a trend change, at least at intermediate degree.
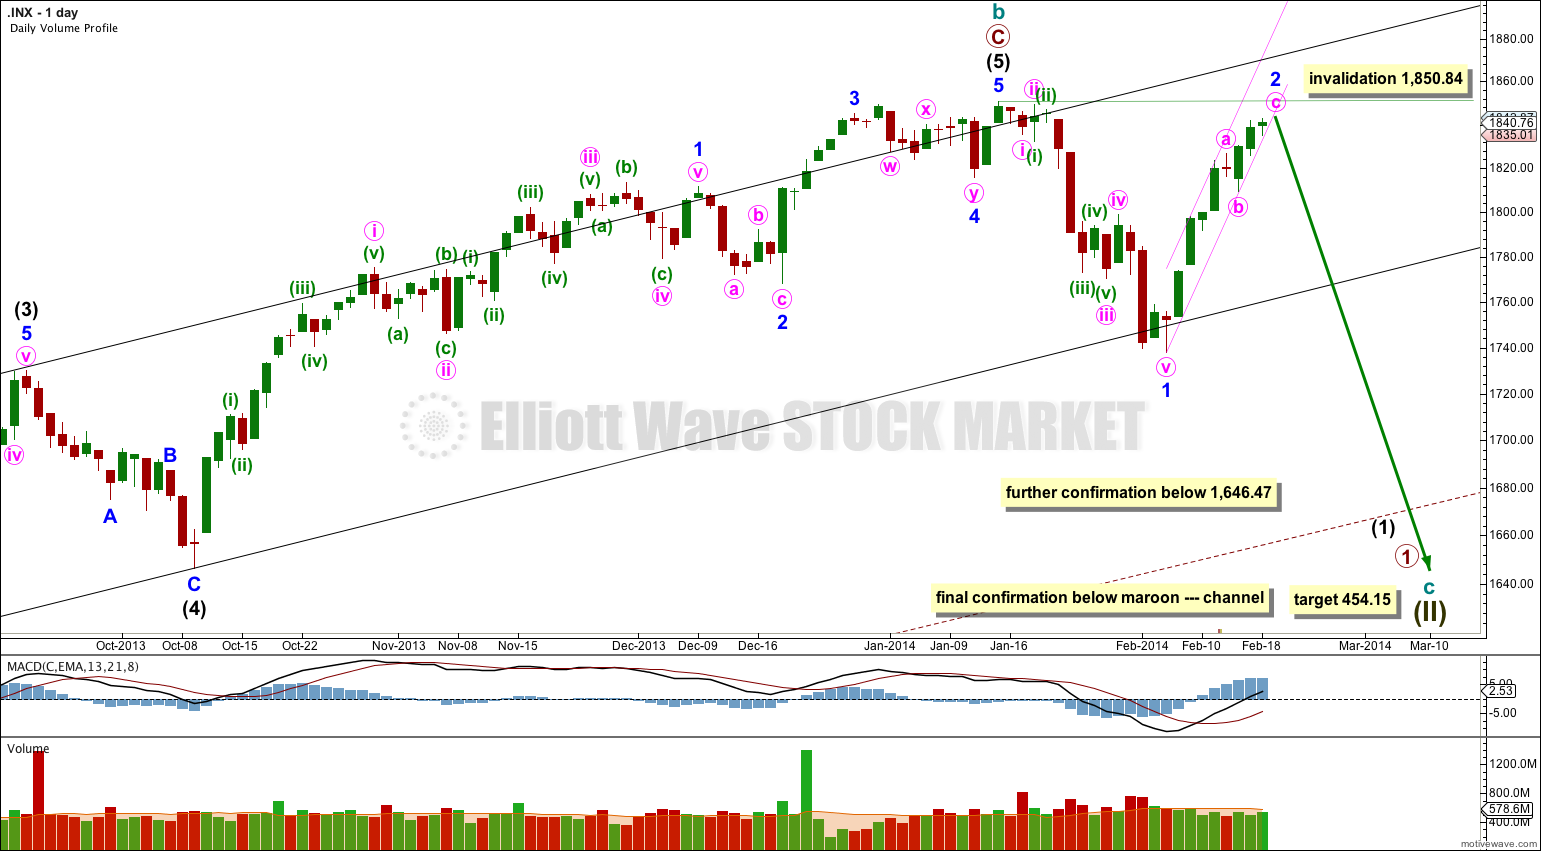
For this main wave count downwards movement must move below 1,530.09 because this super cycle wave (II) must move below the high of super cycle wave (I).
Cycle wave c should last between one to several years and should take price substantially below 666.79.
At 454.15 cycle wave c would reach 1.618 the length of cycle wave a. It should subdivide as a five wave motive structure, most likely a simple impulse, but it may also be an ending diagonal.
Movement below 1,646.47 would provide further confidence in a trend change, at least at intermediate wave degree.
I have changed the scale from arithmetic to semilogarithmic. The maroon – – – channel about the zigzag of cycle wave b is much closer with this scale, and the lower edge of this channel looks like a better fit this way.
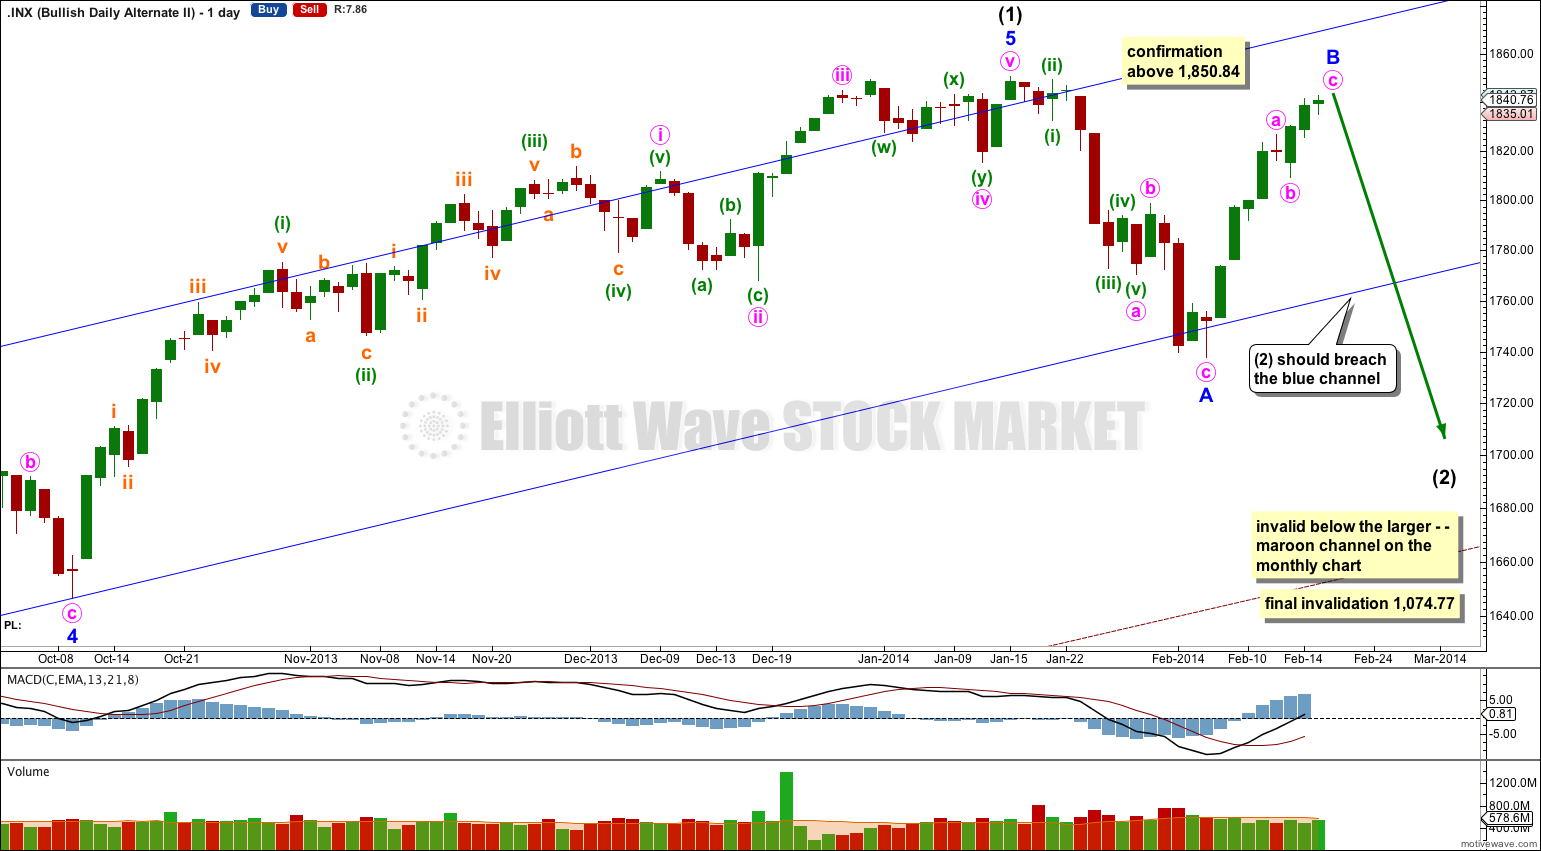
I have drawn a small channel about minor wave 2 using Elliott’s technique. Draw the first trend line from the start of minute wave a to the end of minute wave b. Place a parallel copy on the upper reaches of minute wave a. At the daily chart level it looks like this channel is providing support, but on the hourly chart it is slightly breached. I want to see a full daily candlestick below this channel and not touching the lower trend line. When we have that channel confirmation I will have some confidence in this wave count.
Within cycle wave c no second wave correction may move beyond the start of its first wave. This wave count is invalidated with any movement above 1,850.84.
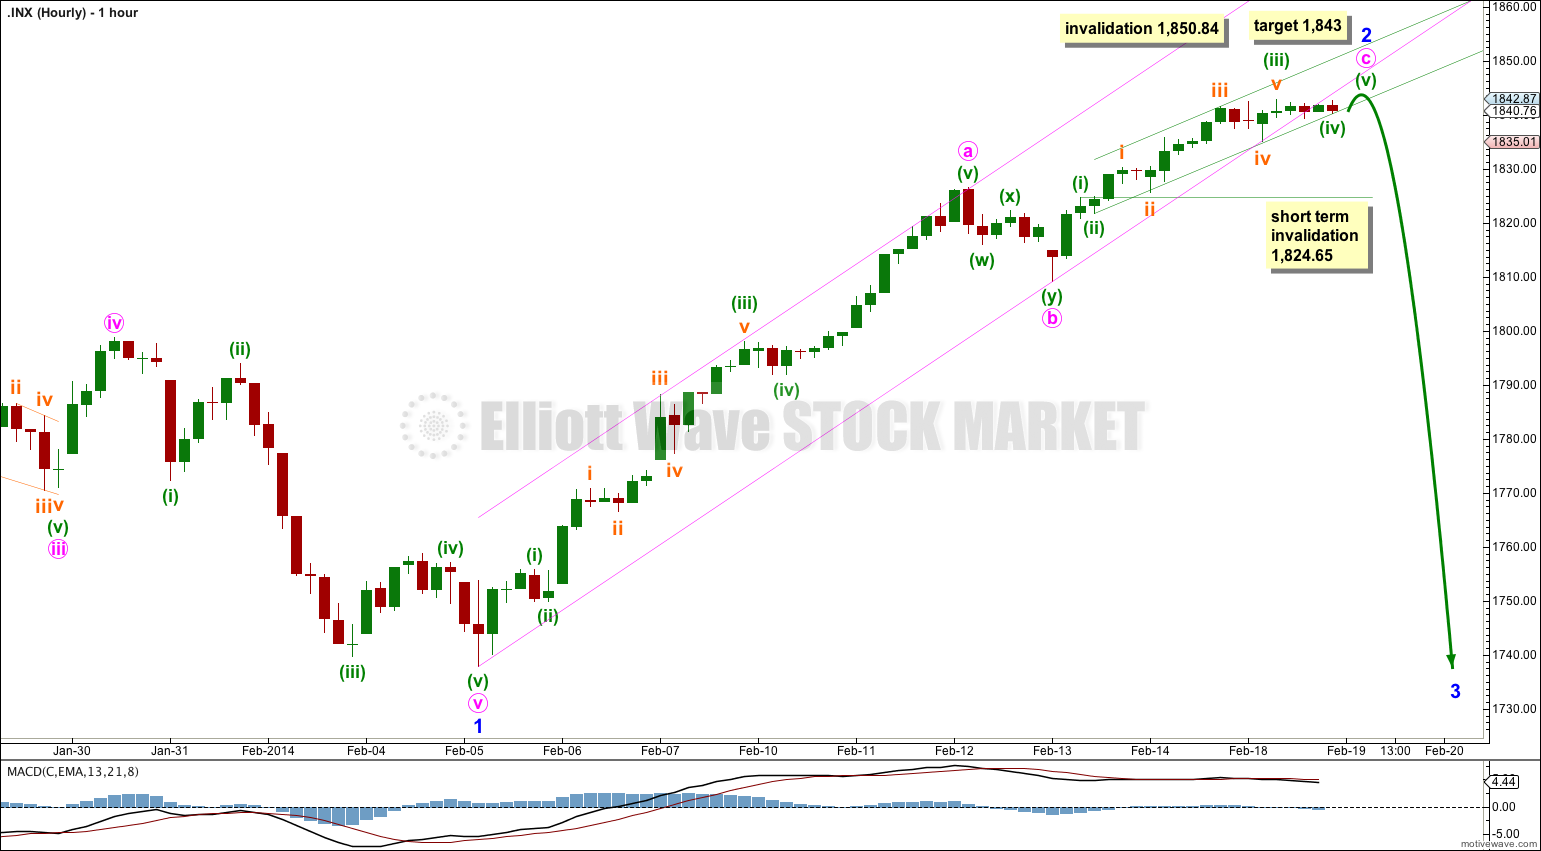
Minor wave 2 is an almost complete zigzag. So far it has lasted eight days. If it is over tomorrow then it would have lasted nine days, just one longer than a Fibonacci eight.
At 1,843 minute wave c would reach 0.382 the length of minute wave a.
Second waves can and often do correct to very deep degrees, and when they do this they convince us there has been no trend change right before a strong third wave takes off in the opposite direction.
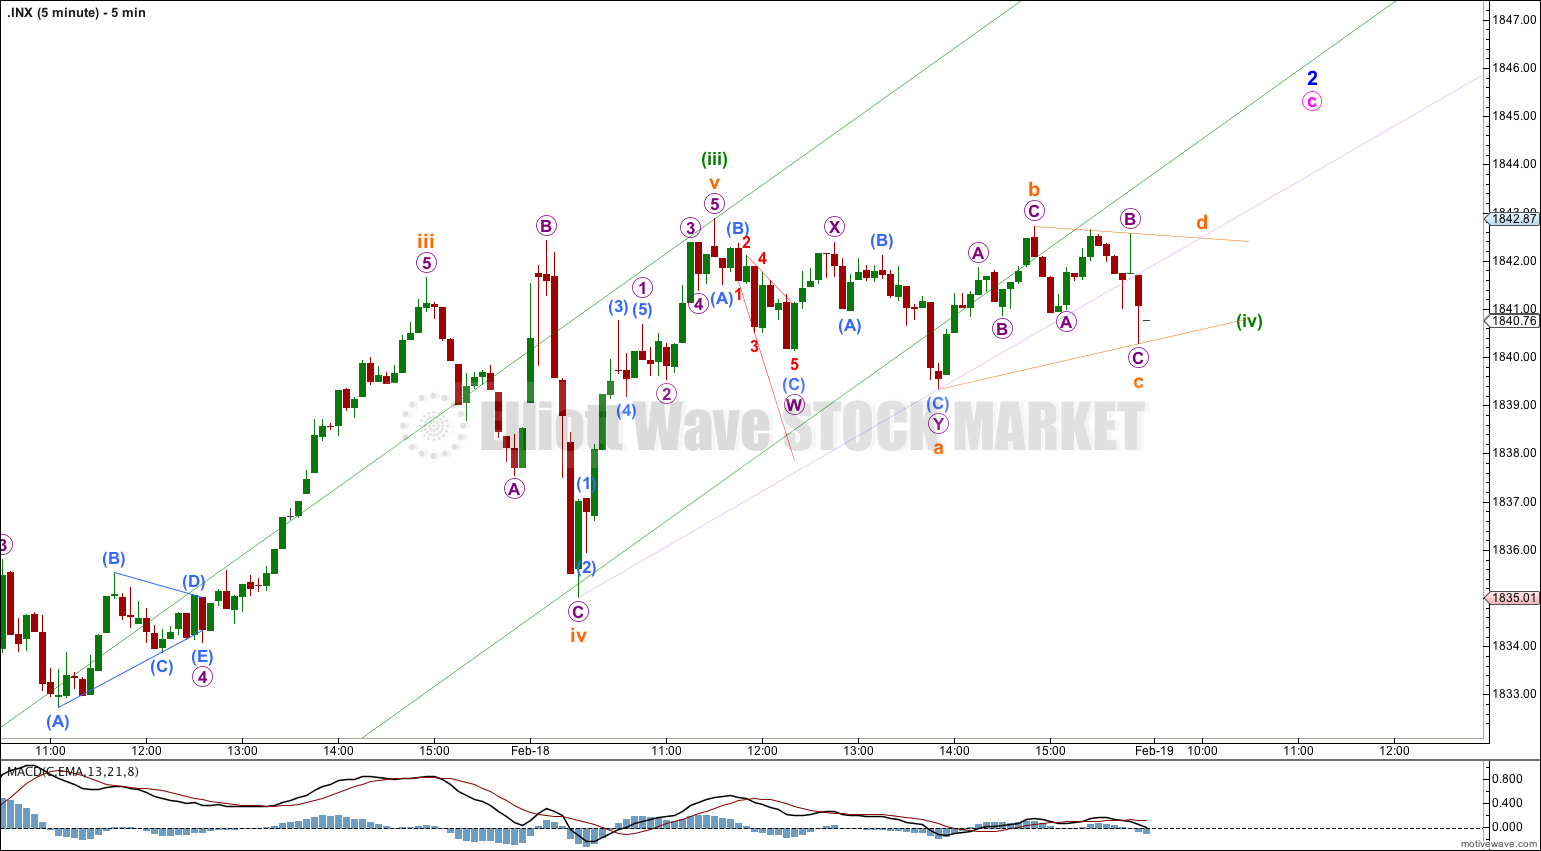
Minute wave c is continuing to show a leveling off and a very slight decrease in momentum. It looks like the sideways movement to end Tuesday’s session is a contracting triangle for a small fourth wave. It may also be a flat correction. Either way the correction looks to be incomplete.
I am expecting a little more sideways and maybe slightly lower movement to begin tomorrow’s session. Thereafter, I am expecting one final small weak upwards thrust to 1,843 (or maybe slightly above). This should be followed by overall downwards movement so that tomorrow’s session produces a red candlestick.
Within minute wave c minuette wave (iv) may not move into minuette wave (i) price territory. This wave count is invalidated in the very short term with movement below 1,824.65.
Minor wave 2 may not move beyond the start of minor wave 1. This wave count is invalidated with movement above 1,850.84.
Bullish Alternate Wave Count.
It is possible that a new cycle degree bull market began at 666.79. So far it is not yet halfway through, and I would expect it to last for a few years (at least five more years and probably longer).
At this stage this alternate bullish wave count does not diverge from the main bearish wave count, and it will not for a few to several weeks yet.
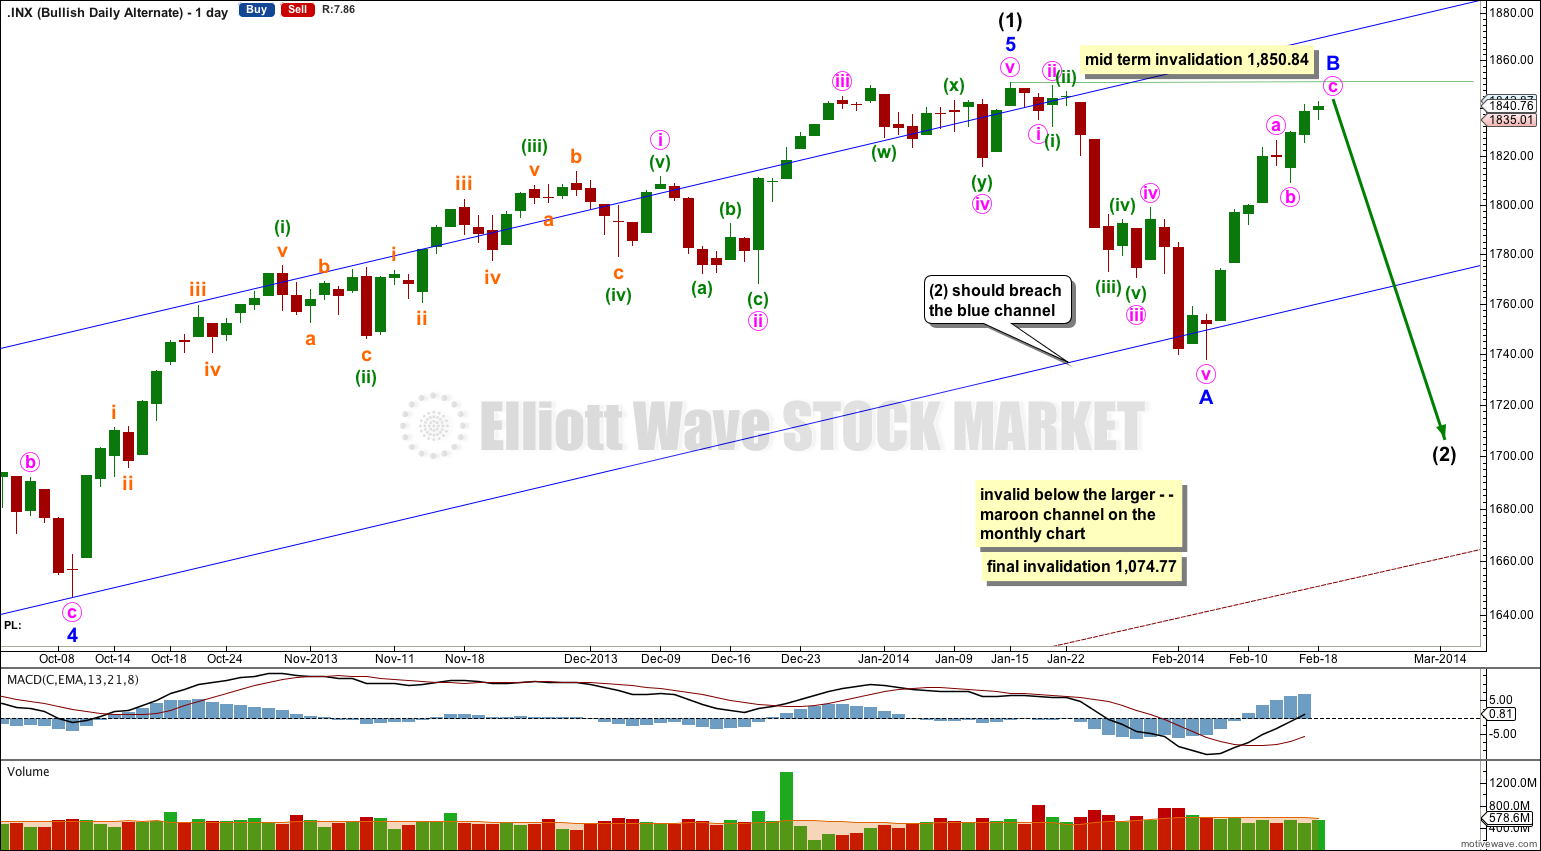
In the mid term this bullish wave count may have seen an intermediate degree trend change.
Intermediate wave (2) must subdivide as a three wave corrective structure. The first downwards movement within it must subdivide as a five and within it no second wave correction may move beyond the start of its first wave. This trend change is invalidated with any movement above 1,850.84.
Intermediate wave (2) downwards should last several weeks to a couple of months or so, and should breach the lower edge of the wide blue channel here on the daily chart.
Intermediate wave (2) should not breach support at the lower edge of the larger maroon – – – channel which is drawn the same way for both wave counts. For this alternate intermediate wave (2) should not breach the lower edge of the acceleration channel drawn about primary waves 1 and 2, one degree higher.
Second Bullish Alternate Wave Count.
Thanks to Steve, one of our members, for pointing out this idea. Sometimes I miss what should be obvious to me and need a small prod to see it.
This alternate wave count keeps the labeling within intermediate wave (1) the same as the first bullish alternate, which has the best Fibonacci ratios of all the variations I can see within that movement.
It is entirely possible that intermediate wave (2) is unfolding as a flat correction if the downwards movement labeled here minor wave A is seen as a zigzag.
Within the flat correction minor wave B may make a new high above 1,850.84. At 1,862.39 minor wave B would reach 105% the length of minor wave A and the structure would be an expanded flat. That would then expect minor wave C downwards to most likely reach 1.618 the length of minor wave A.
Because expanded flats are the most common type of flat this wave count would see a new high as reasonably likely.
If this wave count is confirmed with movement above 1,850.84 then it would be my only wave count which I would publish. With further upwards movement the main bearish wave count reduces in probability so much that it should be relegated to an outside possibility. Above 1,858.03 I would discard it completely.
Trendline Study.
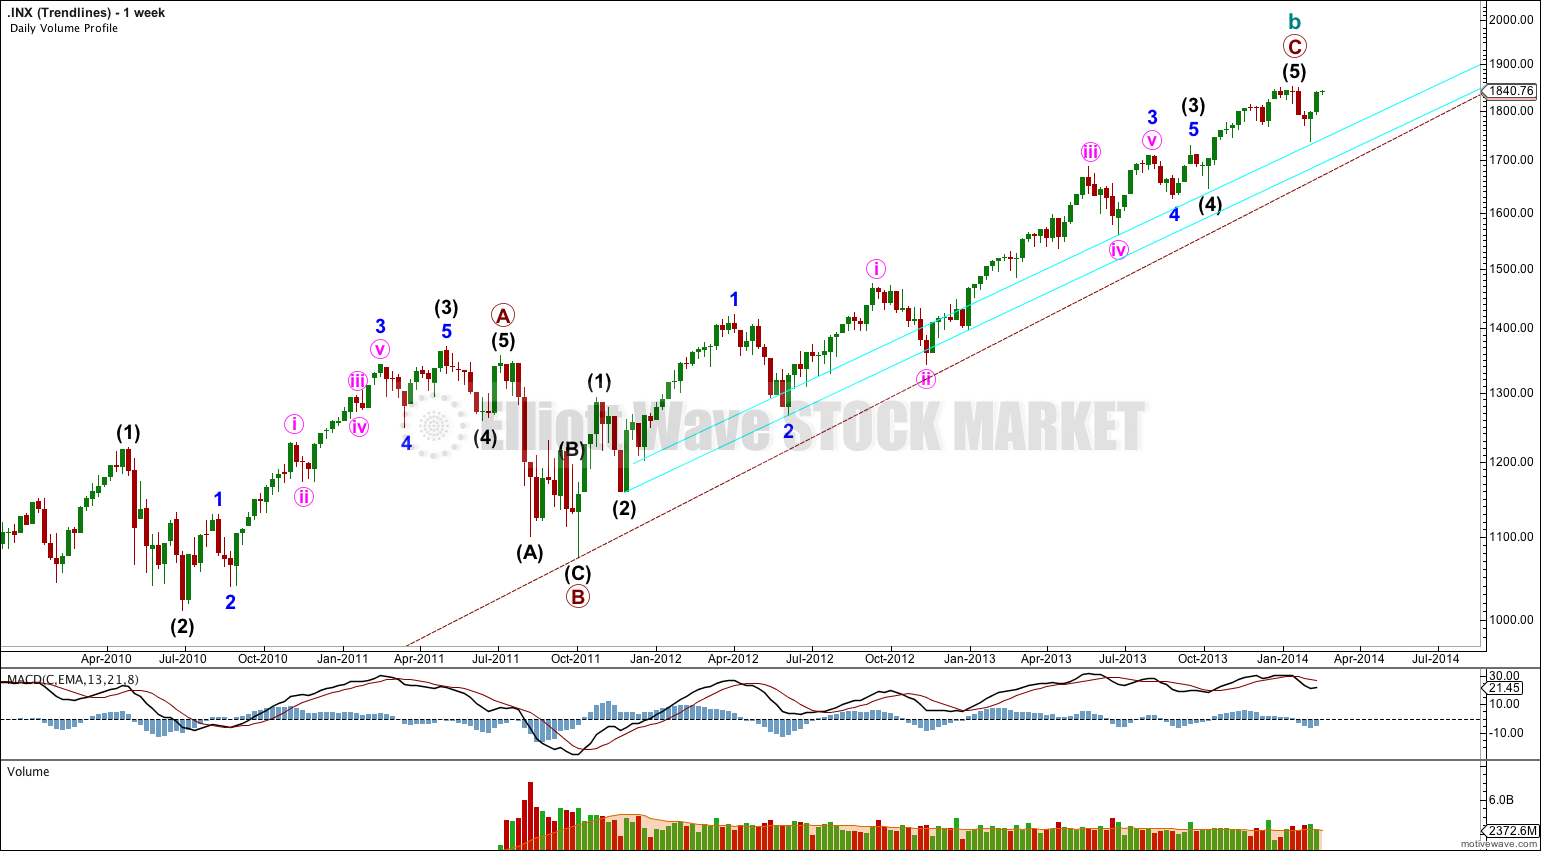
I have been playing with different trend lines on different scales. A semilogarithmic scale produces lows which sit nicely on a double trend line within cycle wave C (aqua blue lines).
The upper one of these two parallel lines is providing support for the last low at 1,737.92.
When these two parallel trend lines are clearly breached by a full daily candlestick below and not touching the lower blue line then I would have a lot of confidence that there has been a trend change most likely at cycle degree, and less likely at intermediate degree.
We may see this breach, if it is going to happen, within a few short weeks.
This is a huge trend change. Patience in looking for technical indicators would be well rewarded at this time. Until the technical indicators tell us there has been a trend change then any prediction as to the next direction is subject to the caveat that it could be wrong.
It´s getting very hard to be a bear on this market. But one thing that comfort me is that George Soros is betting big that the market will have a big decline, up to $1.3 billion dollars in a put position, up 154% from last quarter. And I don´t know if the $1.3 billon are put options or what. Here is the note: http://seekingalpha.com/article/2031021-largest-bet-against-s-and-p-500-in-history-1_3-billion?source=intbrokers_regular