
I had expected downwards movement again for Monday’s session. This is not what happened as price has moved slightly higher. The price point at 1,786.63 was not breached and so a new short term downwards trend was not confirmed.
The wave count remains the same.
Summary: Minor wave 2 is almost over. I expect a little downwards movement tomorrow to a short term target at 1,784. Thereafter, price should turn back up to complete another three wave structure which should move price mostly sideways, ending about 1,808.
Click on the charts below to enlarge.
Main Bearish Wave Count.
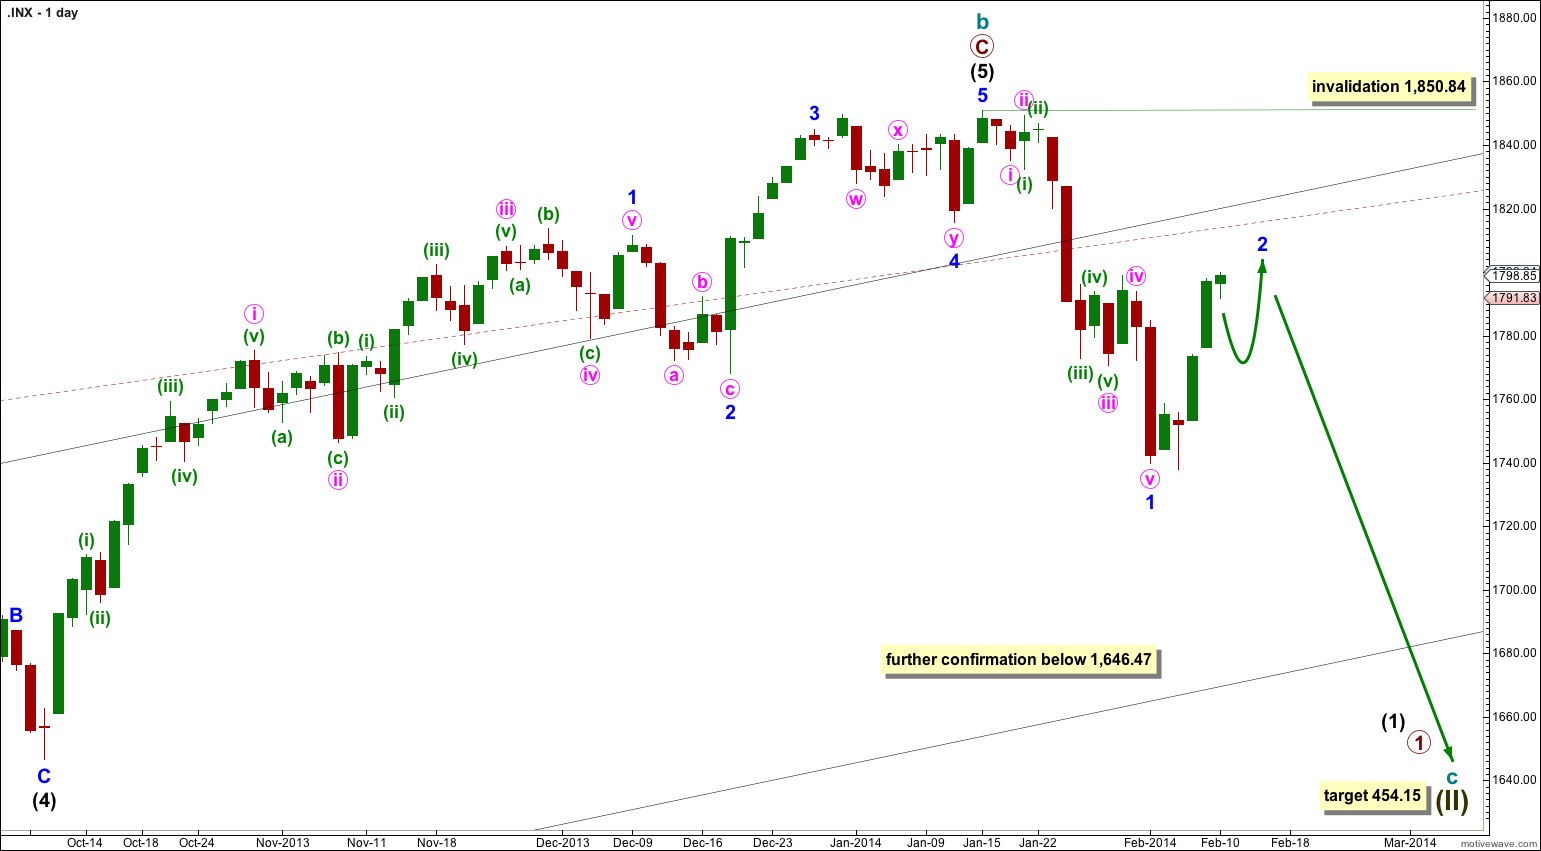
This wave count has a higher probability than the bullish alternate. Upwards movement over the last 4 years and 11 months subdivides best as a zigzag. If something is “off” about the supposed recovery then it must be a B wave because there is plenty that is off in this scenario in terms of social mood.
It is possible that cycle wave b is over and that there has been a trend change at cycle degree (bearish wave count) or intermediate wave degree (bullish alternate below). On the monthly chart there is a bearish engulfing candlestick pattern indicating a new bear market has just begun.
There is now a clear five down on the daily chart. This is indication of a trend change, at least at intermediate degree.
For this main wave count downwards movement must move below 1,530.09 because this super cycle wave (II) must move below the high of super cycle wave (I).
Cycle wave c should last between one to several years and should take price substantially below 666.79.
At 454.15 cycle wave c would reach 1.618 the length of cycle wave a. It should subdivide as a five wave motive structure, most likely a simple impulse, but it may also be an ending diagonal.
Movement below 1,646.47 would provide further confidence in a trend change, at least at intermediate wave degree.
If downwards movement breaches the maroon – – – channel on the monthly chart then I would discard the bullish alternate and this would be my only wave count.
Within cycle wave c no second wave correction may move beyond the start of its first wave. This wave count is invalidated with any movement above 1,850.84.
Main Hourly Wave Count.
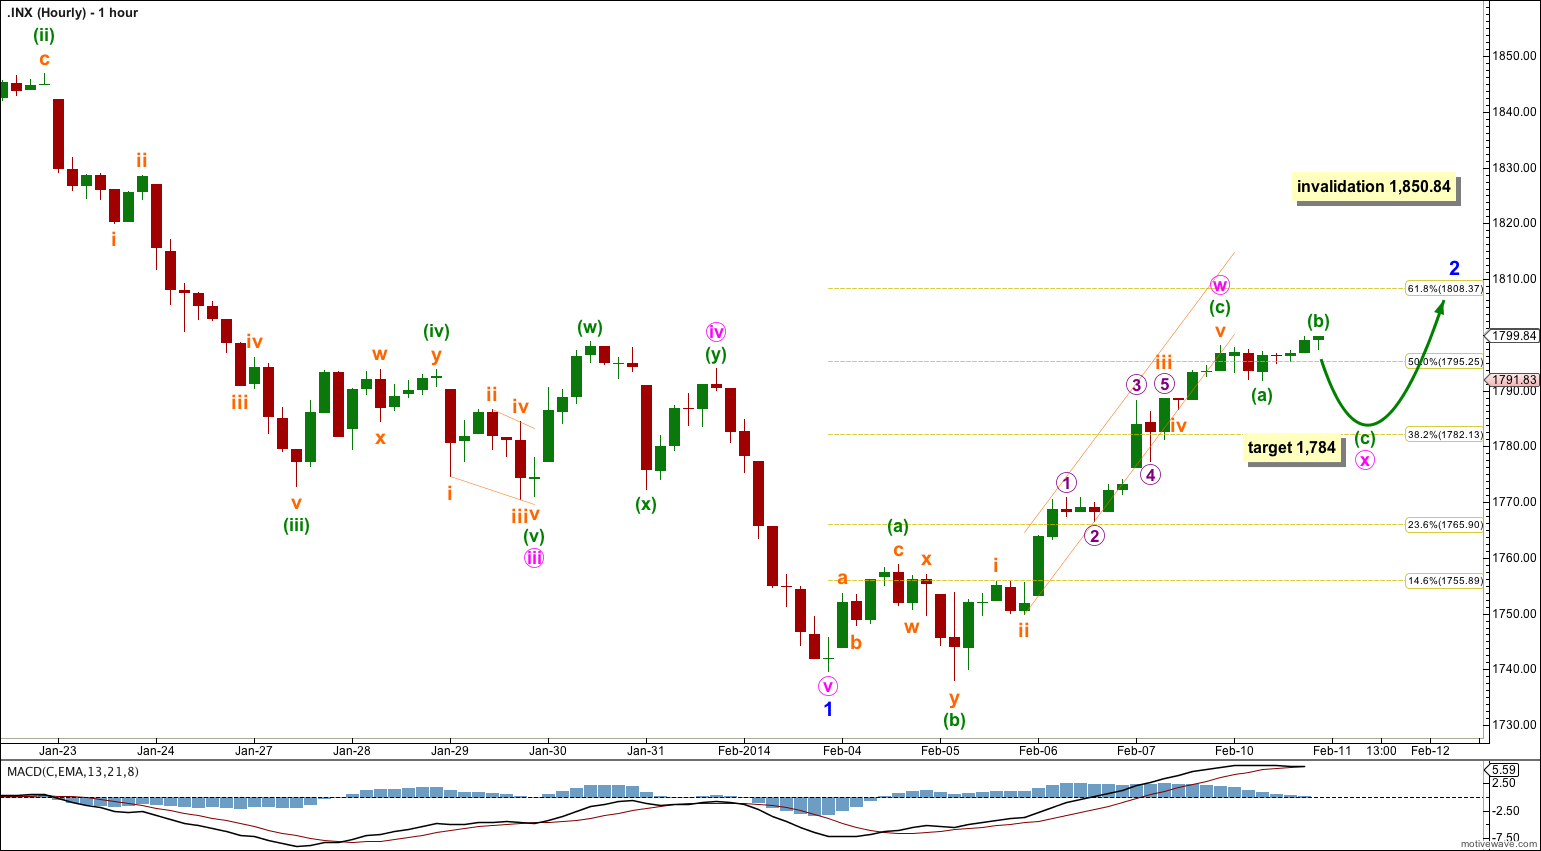
Monday’s mostly sideways movement has clearly breached the small channel containing minuette wave (c) upwards. So although the price point at 1,786.63 was not breached this sideways movement does not fit well within minuette wave (c).
Today I am relabeling minor wave 2 as a double, rather than an incomplete flat correction. If it were to continue as a flat correction then within the downwards b wave its C wave would be enormously out of proportion to its A wave. The sideways movement for Monday fits as a completed 3 down for a minuette wave (a), followed by a three up for minuette wave (b). If this is an unfolding expanded flat then at 1,784 minuette wave (c) would reach 2.618 the length of minuette wave (a). This target is well above 90% the length of minute wave w and so if the target is reached it cannot be a B wave within a larger flat correction for minor wave 2.
If minor wave 2 is a double combination or double flat then overall it should move price sideways from here. When the expanded flat of minute wave x is complete then I would expect very choppy overlapping movement for minute wave y to end about the same level as minute wave w at 1,798.03 or about the 0.618 Fibonacci ratio of minor wave 1 at 1,808.37.
Minor wave 2 may not move beyond the start of minor wave 1. This wave count is invalidated with movement above 1,850.84.
Bullish Alternate Wave Count.
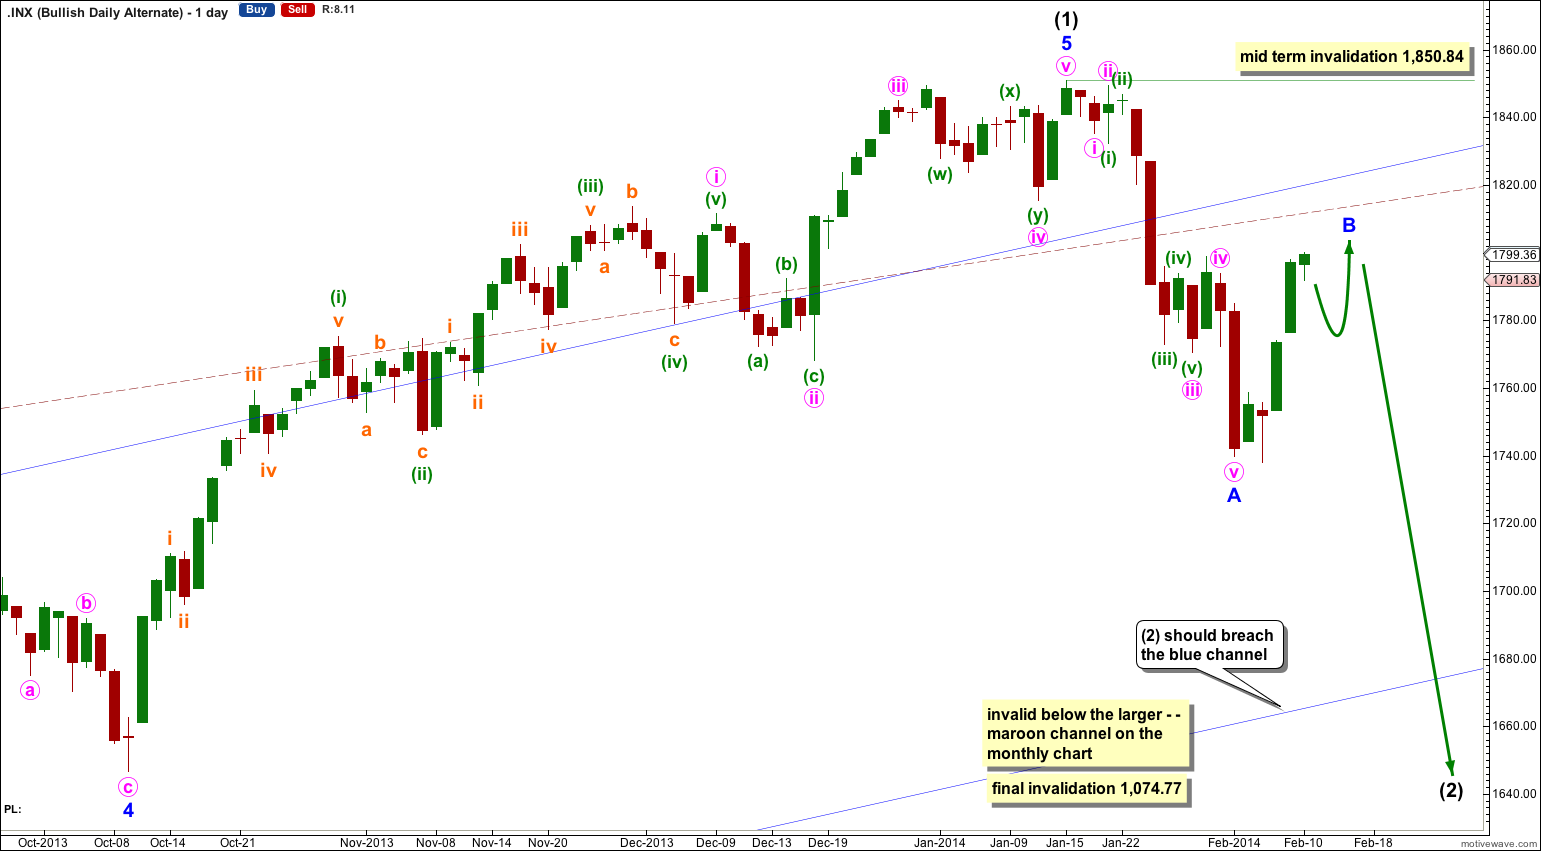
It is possible that a new cycle degree bull market began at 666.79. So far it is not yet halfway through, and I would expect it to last for a few years (at least five more years and probably longer).
At this stage this alternate bullish wave count does not diverge from the main bearish wave count, and it will not for a few to several weeks yet.
In the mid term this bullish wave count may have seen an intermediate degree trend change.
Intermediate wave (2) must subdivide as a three wave corrective structure. The first downwards movement within it must subdivide as a five and within it no second wave correction may move beyond the start of its first wave. This trend change is invalidated with any movement above 1,850.84.
Intermediate wave (2) downwards should last several weeks to a couple of months or so, and should breach the lower edge of the wide blue channel here on the daily chart.
Intermediate wave (2) should not breach support at the lower edge of the larger maroon – – – channel which is drawn the same way for both wave counts. For this alternate intermediate wave (2) should not breach the lower edge of the acceleration channel drawn about primary waves 1 and 2, one degree higher.
Well, I gues the wave count was wrong since we are almost at 1820, passing throw the 20 and the 50 DMA. Even well beyond the 61.8% Fibonacci Retracement. Maybe we are on our way to a retest of the 1850 level.
Lara,
Today’s move looks too strong to be part of a minor 2. Perhaps there is one more higher high coming that would mark the top of this entire move? Also, it looks like if we do go above 1850, MACD will be showing major divergence both on a daily and weekly basis.
Peter
For me impulse up was generated. 5th of 5th of 5th wave, the last one in this year.