
Last analysis expected some upwards movement towards a short term target at 1,791 before more downwards movement. This is not what happened. Price moved sideways and a little lower in a quiet session for Friday the 13th.
The wave counts remain the same. It is time to review the big picture on the monthly chart again.
Click on the charts below to enlarge.
Main Wave Count.
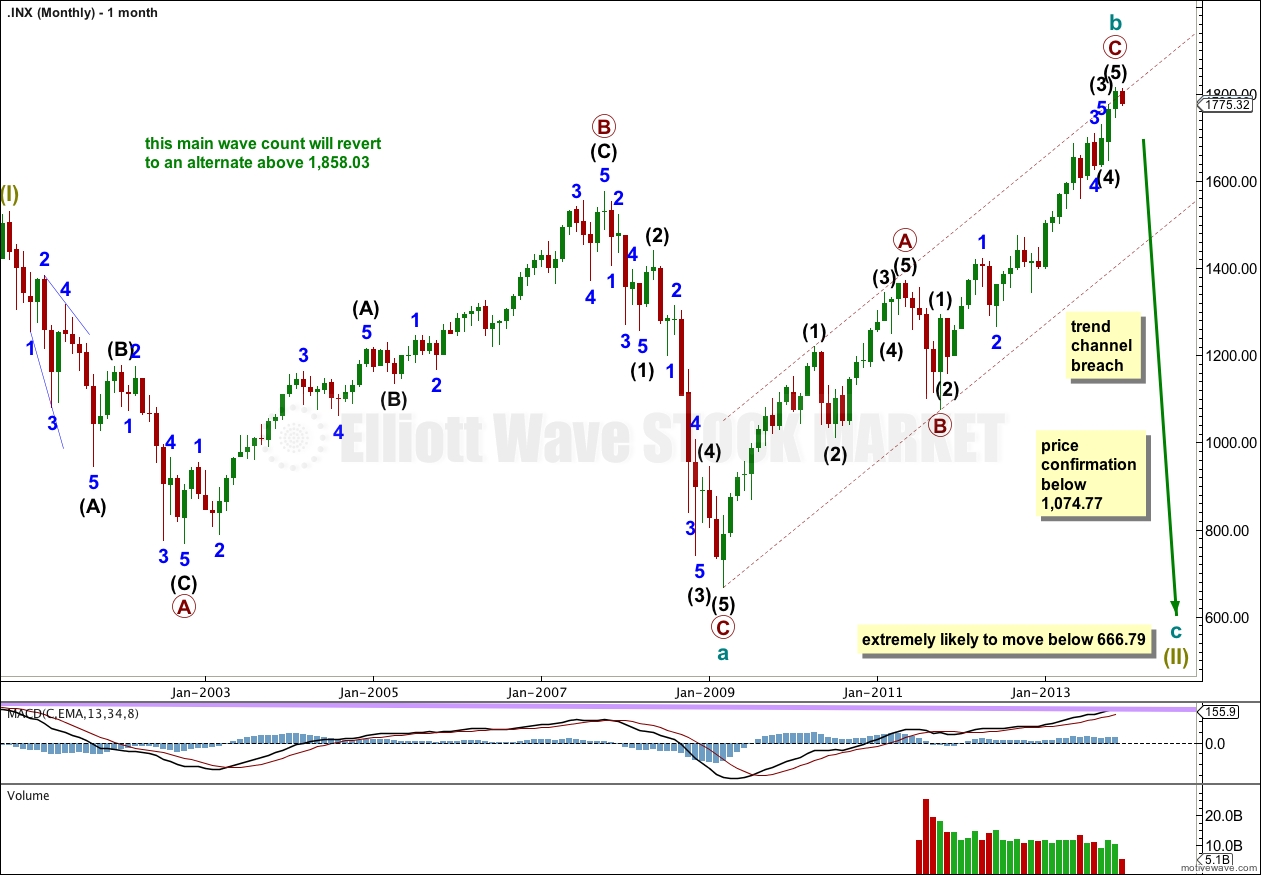
This main wave count expects that a super cycle first wave ended September, 2000 at 1,530.09 (at the end of the movement there is a slightly truncated fifth wave). This is where a big super cycle expanded flat (or double combination) may have begun.
Within the correction cycle wave a is a three wave structure, indicating the correction is either a flat or a double. Cycle wave b may be complete or close to it, and subdivides as a zigzag.
Cycle wave c, if this structure is a flat, should subdivide as a five wave structure (most likley an impulse, less likely an ending diagonal), and should take price substantially below the end of cycle wave a at 666.79. C waves within expanded flats are often 1.618 or sometimes 2.618 the length of the a wave. The deeper the B wave of an expanded flat the longer the C wave would be expected to be.
Alternatively, this corrective structure may be a double flat or double combination, in which case at cycle wave degree it would be labeled W-X-Y (instead of A-B-C). This would expect a time consuming corrective structure to unfold for about eight to nine years and end about or slightly below 666.79.
When a trend change is confirmed then I will have to chart, and publish both scenarios alongside each other, as both are equally valid. The structure of the first wave down would give some indication as to which scenario is correct, and the correct scenario should be clear before the movement ends.
This wave count has a higher probability than the bullish alternate. Upwards movement over the last 4 1/2 years subdivides best as a zigzag. If something is “off” about the supposed recovery then it must be a B wave because there is plenty that is off in this scenario in terms of social mood.
We should always assume the trend remains the same, until proven otherwise. This is a huge trend change. I will assume we are yet to see new highs while price remains above 1,646.47.
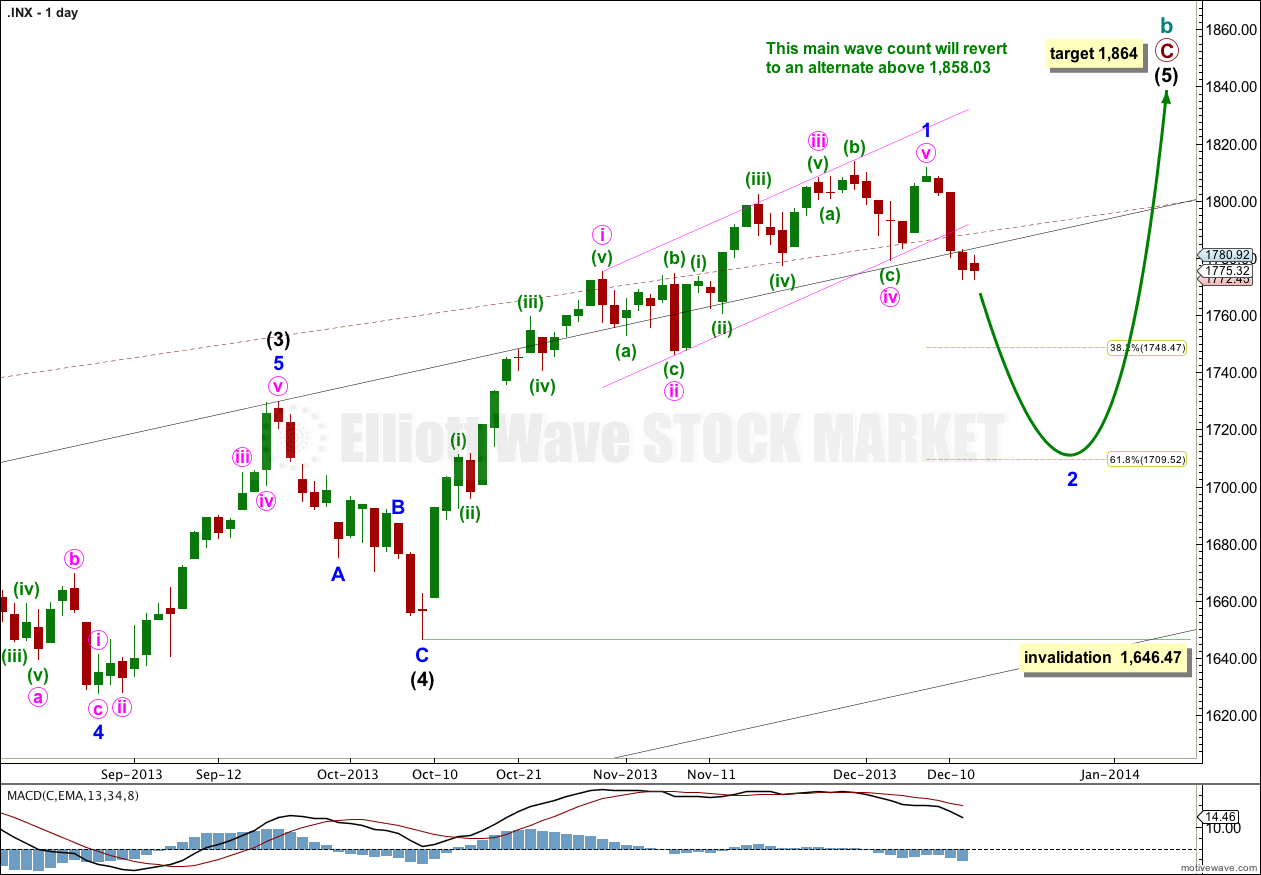
Minor wave 1 is complete because a trend channel drawn about it is very clearly breached by downwards movement. This may be minor wave 2.
Minor wave 2 may not move beyond the start of minor wave 1. This wave count is invalidated with movement below 1,646.47.
If downwards movement is a second wave correction then so far it is still incomplete.
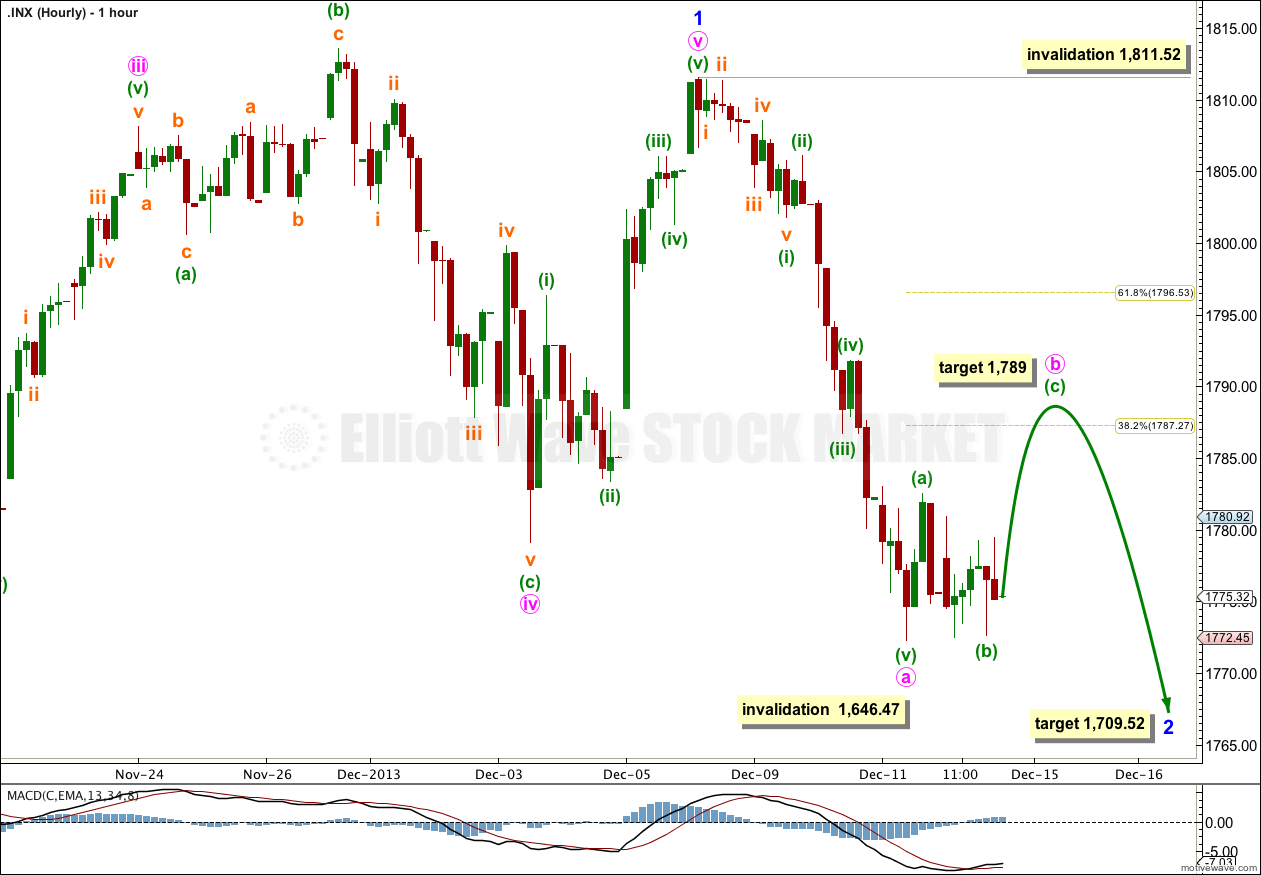
Downwards and sideways movement for Friday may have been a continuation of minuette wave (b) within the correction of minute wave b.
Within minute wave b minuette wave (c) would reach 1.618 the length of minuette wave (a) at 1,789. Minute wave b would still end within the price territory of the fourth wave of one lesser degree.
When minute wave b is a clearly complete “three” then I would expect another five wave structure downwards to new lows. At 1,709.52 minor wave 2 would reach down to the 0.618 Fibonacci ratio of minor wave 1. This target may still be a few days away.
Bearish Alternate Wave Count.
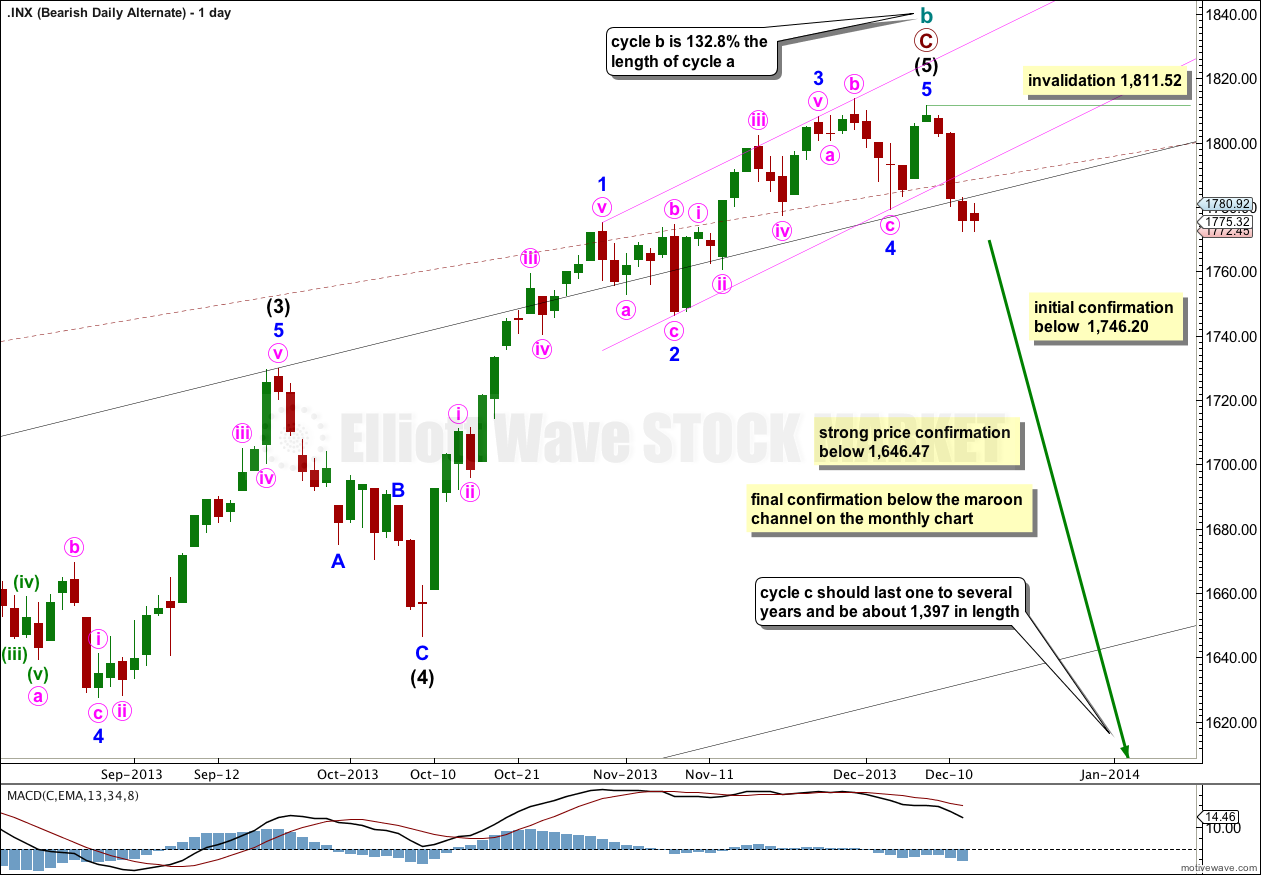
We should always assume the trend remains the same, until proven otherwise. “The trend is your friend”. This wave count is possible, but we have absolutely no confirmation of a trend change at cycle degree.
Within cycle wave b primary wave C is 47.06 longer than equality with primary wave A. Upwards movement may have found final resistance at the upper edge of the maroon channel drawn about the whole of cycle wave b from its start at 666.79.
Cycle wave b is 132.8% the length of cycle wave a, within the common length of 100% to 138% for a flat correction. Because cycle wave b is over 105% the length of cycle wave a this would be an expanded flat which normally expects a C wave to move substantially beyond the end of the A wave. Movement well below 666.79 would be expected for this wave count.
Strong price confirmation of a trend change would come with movement below 1,646.47, and with invalidation of the main wave count above. At that stage both this wave count and the bullish alternate would be correct, and this would be my main wave count.
For this bearish wave count the big maroon channel on the monthly chart needs to be breached. If that occurs then the bullish alternate would be discarded, and this would be my only wave count.
Within cycle wave c no second wave correction may move beyond the start of its first wave. This wave count is invalidated with movement above 1,811.52.
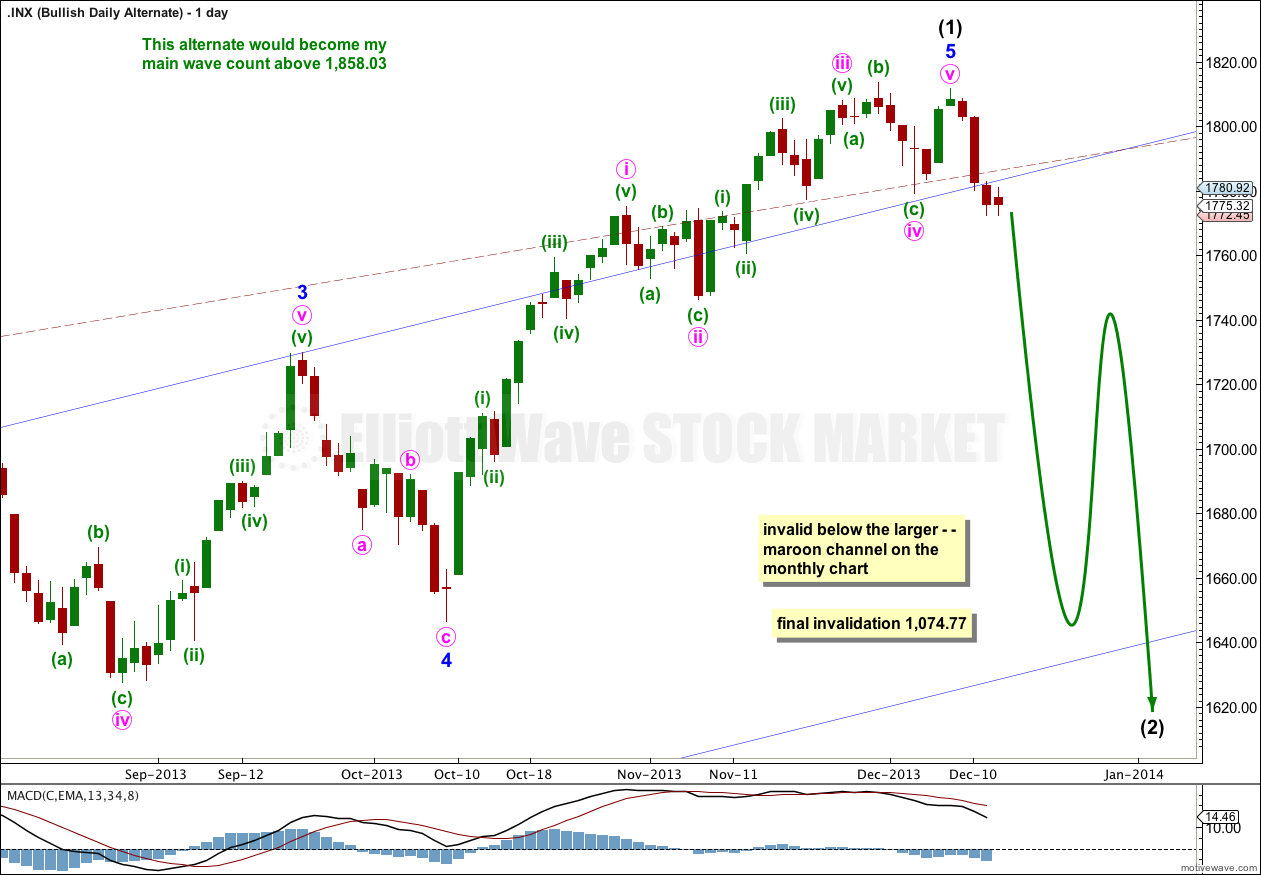
Bullish Alternate Wave Count.
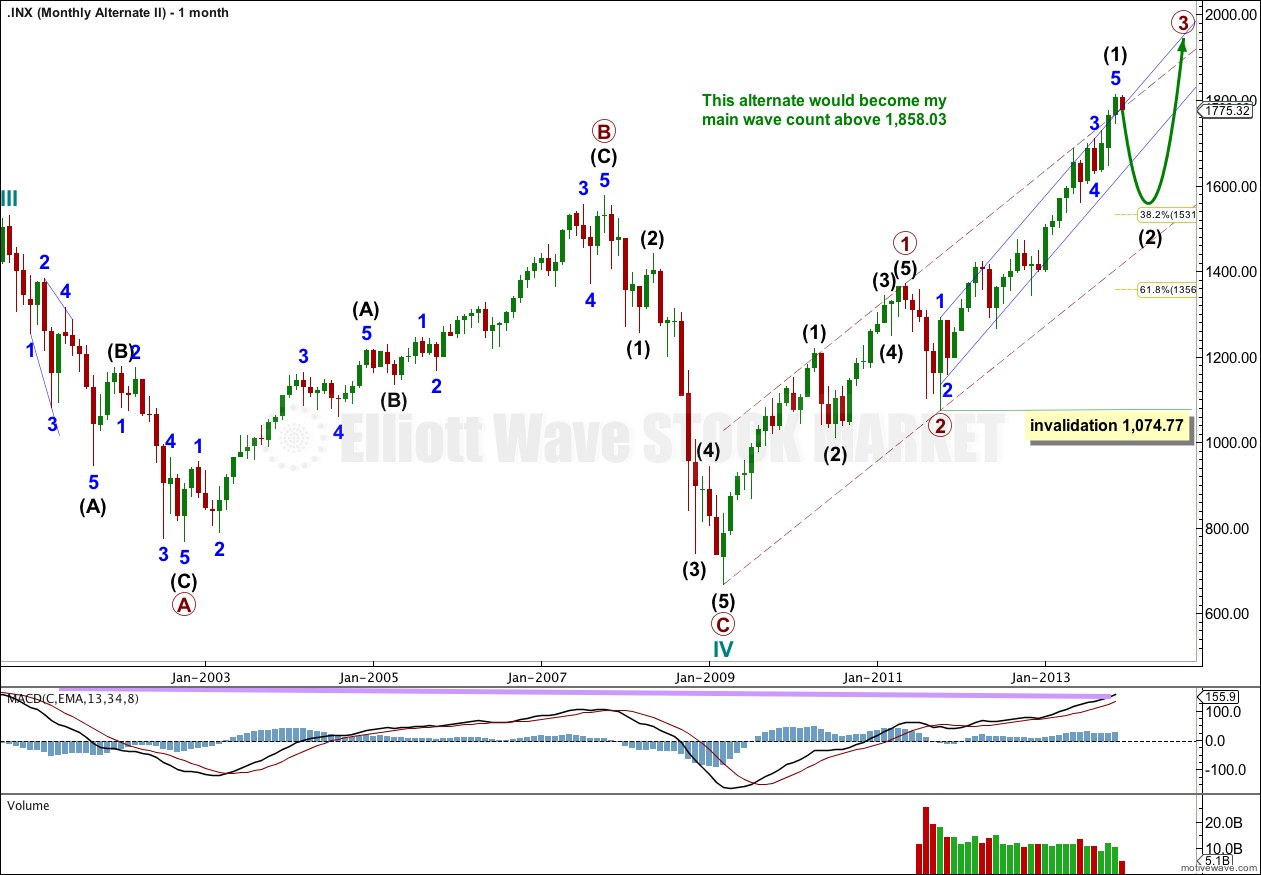
Alternatively at the monthly chart level the expanded flat correction which completed at 666.79 could be the entire correction over, and upwards movement for the last four and a half years could be the early stages of a bull market to last several more years.
If upwards movement is a new bull market then within it the third wave has not yet begun. The maroon — channel is drawn here in the same way, but when it is drawn about a first and second wave it is correctly termed an acceleration channel. Third waves should breach these channels. There has not been a sustained breach yet, so the third wave has not yet begun.
Within primary wave 3 only intermediate wave (1) may be complete. This bullish wave count does not diverge from the main wave count at this stage, and will not for several weeks yet. It too expects downwards movement as a second wave correction at intermediate degree.
Intermediate wave (2) should breach the smaller blue channel drawn about intermediate wave (1). The initial target would be about the 0.382 Fibonacci ratio of intermediate wave (1) at 1,531.
Intermediate wave (2) should not breach the maroon — acceleration channel drawn about primary waves 1 and 2 because a lower degree second wave very rarely breaches an acceleration channel drawn about a first and second wave one degree higher. If downwards movement breached this channel I would discard this wave count as very unlikely.
Intermediate wave (2) may not move beyond the start of intermediate wave (1). This wave count is invalidated with movement below 1,074.77.
It is possible that a new cycle degree bull market began at 666.79. So far it is not yet halfway through, and I would expect it to last for a few years (at least five more years and probably longer).
The current upwards impulse, labeled intermediate wave (5) for the main wave count and minor wave 5 for this alternate could now be completed. At this stage both wave counts could see a trend change. The bearish wave count expects a huge cycle degree trend change, and this alternate expects an intermediate degree trend change. If the downwards movement subdivides as a three and remains within the maroon channel then this alternate would be preferred. If it breaches the channel this alternate would be discarded.
The maroon – – – channel is an acceleration channel drawn about primary waves 1 and 2 on the monthly chart (it is drawn in exactly the same way on the main wave count, but there it is termed a corrective channel). I would not expect intermediate wave (2) to breach this channel because a lower degree (intermediate) wave should not breach an acceleration channel of a higher degree (primary) first and second wave.
1791 area looks to be right on TARGET hidden bullish divergence Wednesday turned into bullish divergence Friday (NYMO closed green SPX closed red) http://scharts.co/IMpbSs