
Last analysis expected it was extremely likely we should see upwards movement for Friday’s session, which is what happened.
I am changing the daily wave count in regards to the degree of labeling of this last upwards impulse in order for the wave count to fit with MACD.
Click on the charts below to enlarge.
Main Wave Count.
This wave count has a higher probability than the alternate. Upwards movement over the last 4 1/2 years subdivides best as a zigzag. If something is “off” about the supposed recovery then it must be a B wave because there is plenty that is off in this scenario in terms of social mood.
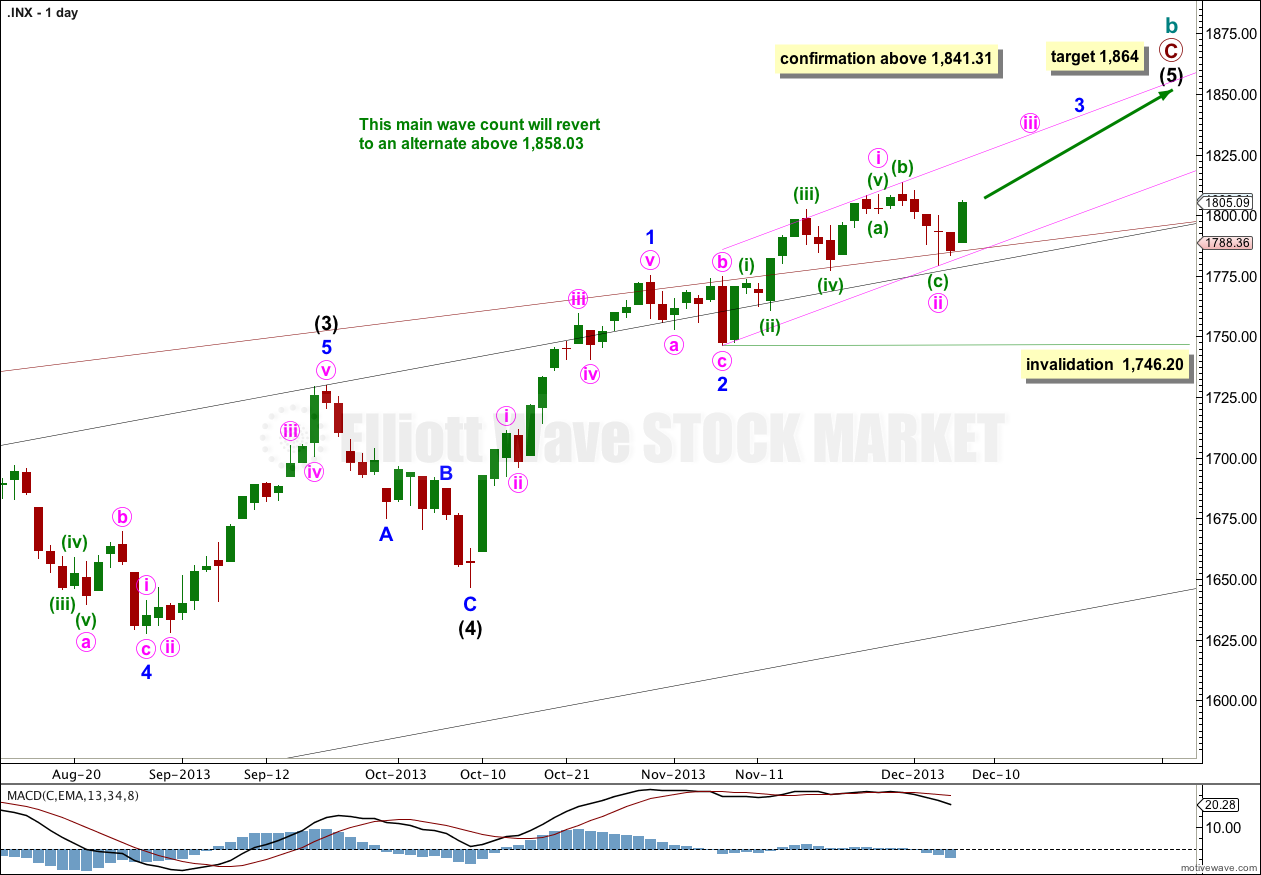
Minor wave 3 may be finding support along the upper edge of the big maroon channel from the monthly chart, if the upper trend line is pushed out to encompass all of primary wave A.
Intermediate wave (5) is incomplete, with minor waves 1 and 2 complete.
Because momentum within minor wave 3 has not yet exceeded that of minor wave 1 it is probably incomplete, and I have changed the wave count for this piece of movement.
Within minor wave 3 minute wave ii may not move beyond the start of minute wave i. This wave count is invalidated with movement below 1,746.20.
Draw an acceleration channel about minor wave 3. Draw the first trend line from the start of it to the end of minute wave ii within it. If the next upwards wave is minute wave iii within minor wave 3 then it should breach the upper edge of this channel.
Minor wave 1 lasted 15 days and is extended. Minor wave 3 may or may not be extended, because one or two actionary waves within an impulse may extend. As more of minor wave 3 unfolds I will calculate a target for it to end, which may be above 1,864 if minor wave 3 reaches equality with minor wave 1. That would be achieved at 1,875.
At 1,864 intermediate wave (5) would reach equality in length with intermediate wave (1). As more of intermediate wave (5) unfolds I will add to this target calculation at minor and eventually minute wave degrees, so it may change. For now I can only calculate the target at one wave degree.
At 1,858.03 cycle wave b would reach 138% the length of cycle wave a. At super cycle degree this wave count sees a large expanded flat unfolding. Within the expanded flat the maximum common length of cycle wave b is up to 138% the length of cycle wave a. When cycle wave b becomes longer than this then the probability that an expanded flat is unfolding decreases. At that stage I would swap over the main and alternate daily wave counts.
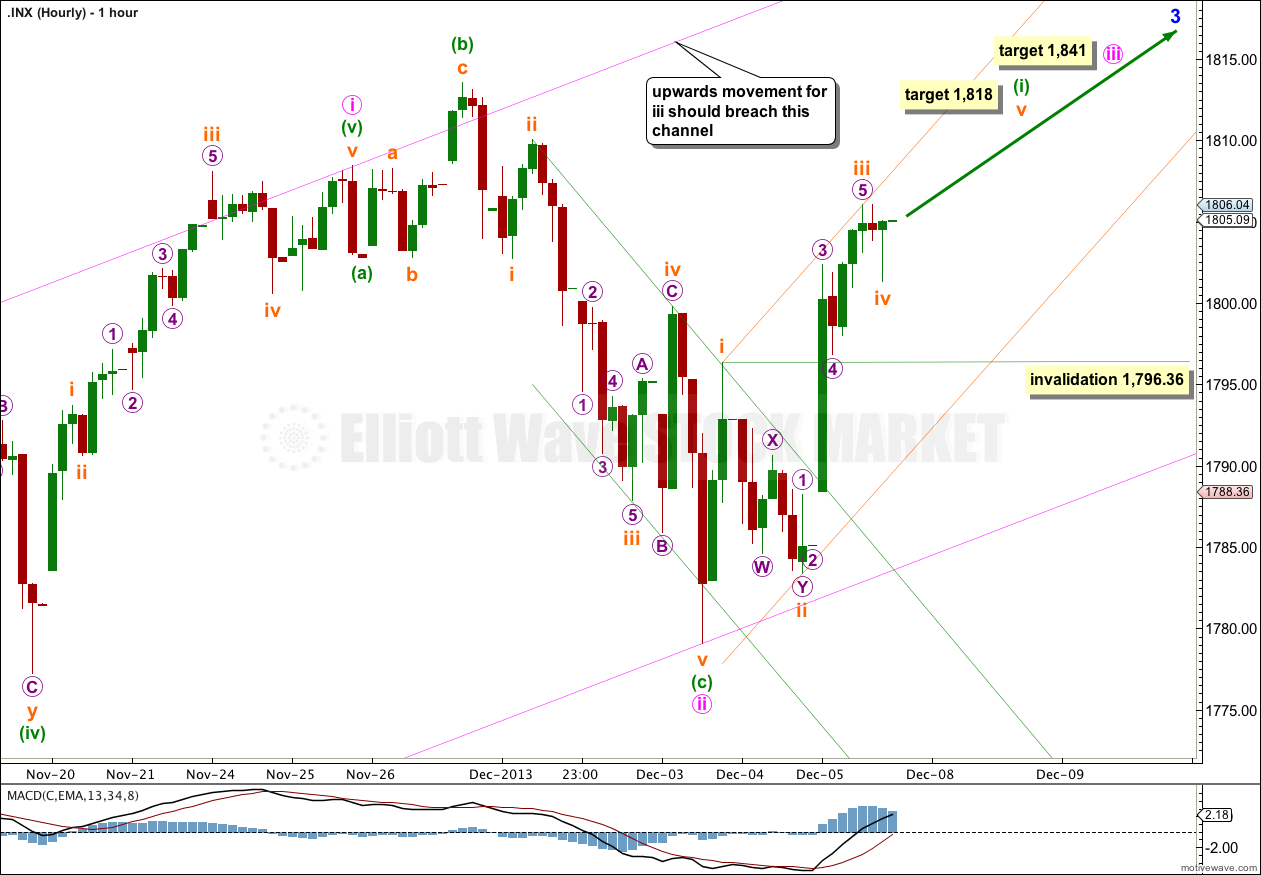
Everything within minor wave 3 has been moved down one degree.
Only minute waves i and now ii are complete.
At 1,841 minute wave iii would reach equality in length with minute wave i.
So far within minute wave iii it is likely that only minuette wave (i) is nearing completion. Within minuette wave (i) the structure is incomplete.
Within minuette wave (i) subminuette waves i and ii are complete. Subminuette wave iii is showing an increase in momentum beyond that of subminuette wave i. Subminuette wave iv may not move into subminuette wave i price territory. This wave count is invalidated in the short term with movement below 1,796.36.
If the session begins with a new high above 1,806.04 on Monday then it is possible that minuette wave (i) could be complete, and the invalidation point then must move to the start of minuette wave (i) at 1,779.09. Minuette wave (ii) may not move beyond the start of minuette wave (i).
Within minuette wave (i) there is no Fibonacci ratio between subminuette waves i and iii. This makes it more likely we should see a Fiboancci ratio between subminuette wave v and either of i or iii. The most common ratio for a fifth wave is one of equality with the first. At 1,818 subminuette wave v would reach equality with subminuette wave i.
Alternate Wave Count.
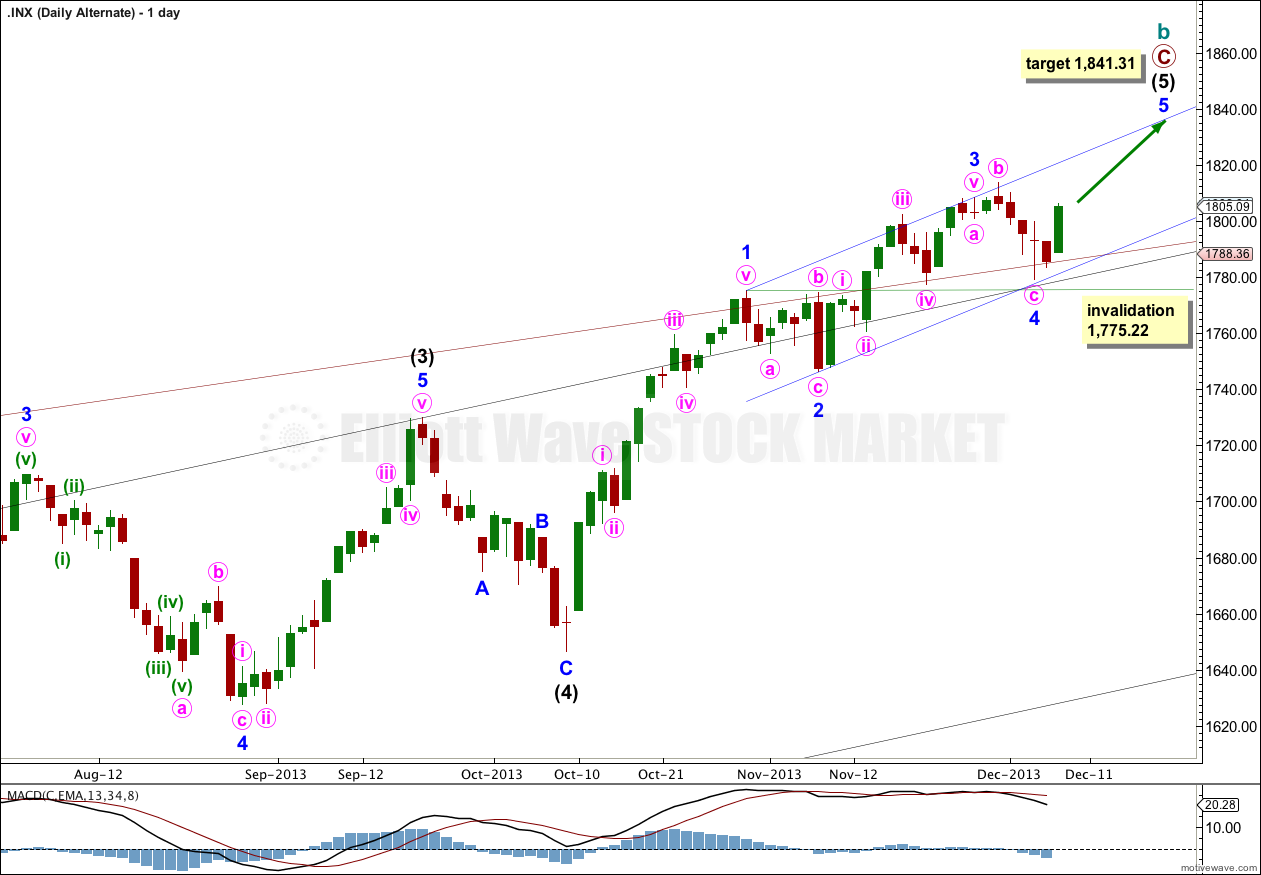
This wave count was up to now the main wave count. It sees minor wave 3 as completed, but the problem with this is it does not show an increase in momentum beyond that seen for minor wave 1. This reduces the probability of this alternate. I will discard this idea if momentum increases beyond that for minor wave 1 as at that stage it would be clear that the third wave is incomplete.
For this idea there is a maximum limit for minor wave 5. Minor wave 5 may not be longer than minor wave 3 because a third wave may never be the shortest. This wave count is invalid above 1,841.31.
Bullish Alternate Wave Count.
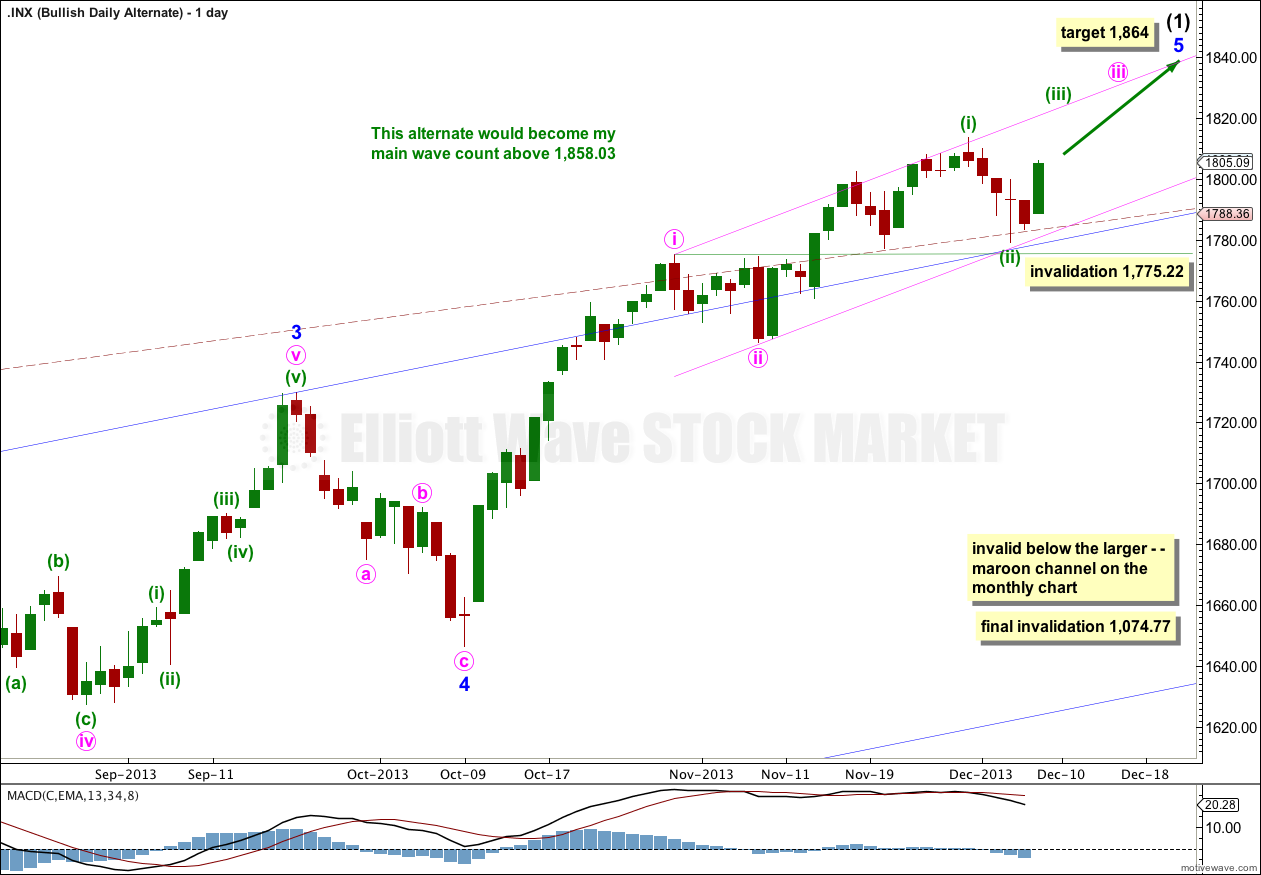
It is possible that a new cycle degree bull market began at 666.79. So far it is not yet halfway through, and I would expect it to last for a few years (at least five more years and probably longer).
At some stage then the current upwards impulse, labeled intermediate wave (5) for the main wave count and minor wave 5 for this alternate, will be completed. At that stage both wave counts would expect a trend change. The main wave count would expect a huge cycle degree trend change, and this alternate would expect an intermediate degree trend change. If the downwards movement subdivides as a three and remains within the maroon channel then this alternate would be preferred. If it breaches the channel this alternate would be discarded.
The maroon – – – channel is an acceleration channel drawn about primary waves 1 and 2 on the monthly chart (it is drawn in exactly the same way on the main wave count, but there it is termed a corrective channel). I would not expect intermediate wave (2) to breach this channel because a lower degree (intermediate) wave should not breach an acceleration channel of a higher degree (primary) first and second wave.
The daily chart shows the structure of minor wave 5. It is incomplete. Targets are the same because they are calculated using the same wave lengths as the main wave count. This bullish alternate does not diverge from the main wave count at this stage, and it will not for some weeks (or months) to come.
Hi Laura,
The fact that the MACD has not moved higher in wave 3 compared to wave 1, isn’t that because the first wave was extended in this case and not wave 3?
What you now describe as the daily alternate (not the bullish alternate), couldn’t that wave count still be the most likely one and be seen as an ending diagonal?
No. I don’t think so.
Third waves, even if they’re not extended, should still show an increase in momentum beyond the first wave.
I guess it could be, but that would be reasonably unusual.