
Yesterday’s analysis expected price to break out of a small zone, and provide confirmation of one of the hourly wave counts. It did not do that, and price moved mostly sideways within a narrow range.
It should break out of this zone tomorrow and provide some clarity.
I am swapping the hourly wave counts over today because of the look on the daily chart.
Click on the charts below to enlarge.
This wave count has a higher probability than the alternate. Upwards movement over the last 4 1/2 years subdivides best as a zigzag. If something is “off” about the supposed recovery then it must be a B wave because there is plenty that is off in this scenario in terms of social mood.
Downwards corrections may now find support along the upper edge of the big maroon channel from the monthly chart, if the upper trend line is pushed out to encompass all of primary wave A.
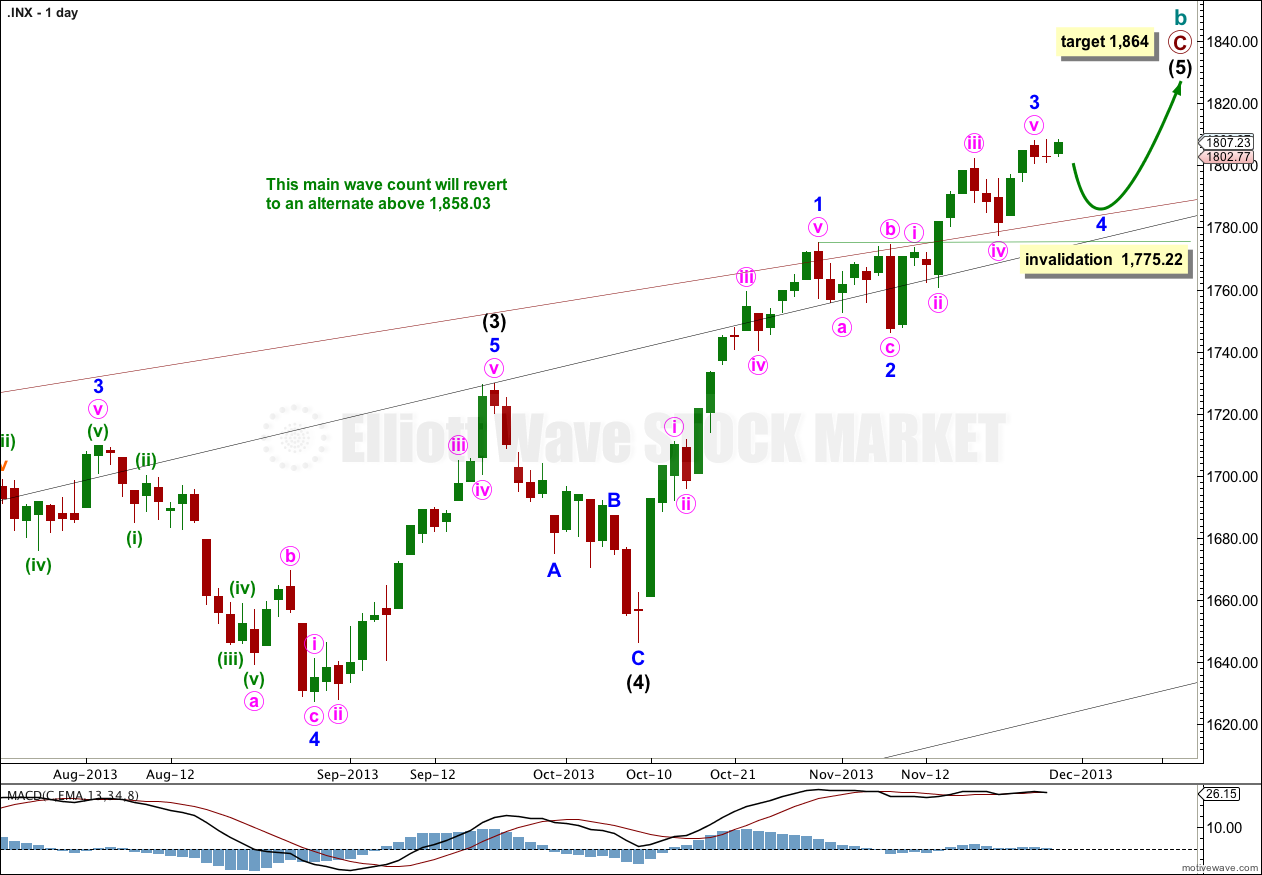
Intermediate wave (5) is incomplete, with minor waves 1 and 2 and now most likely 3 completed.
At 1,864 intermediate wave (5) would reach equality in length with intermediate wave (1). This is the most common ratio between first and fifth waves so this target has a good probability. When minor wave 4 within intermediate wave (5) is complete I will add to this calculation at a second wave degree, so it may change or widen to a small zone.
Minor wave 4 may not move into minor wave 1 price territory. This wave count is invalidated with movement below 1,775.22.
I would expect minor wave 4 to find support at the upper edge of the big maroon channel copied over from the monthly chart.
Because we have a couple of red candlesticks on the daily chart it looks most likely that minor wave 3 is over. If it were to continue from here with a final fifth wave then on the daily chart it would have a three wave look. This is unlikely.
The parallel channel about minute wave v of minor wave 3 is very clearly breached now with downwards (and sideways) movement. This is an indication that minute wave v is now over.
Minor wave 2 was a shallow 22.5% zigzag correction, and within it minute wave c was close to 1.618 the length of minute wave a.
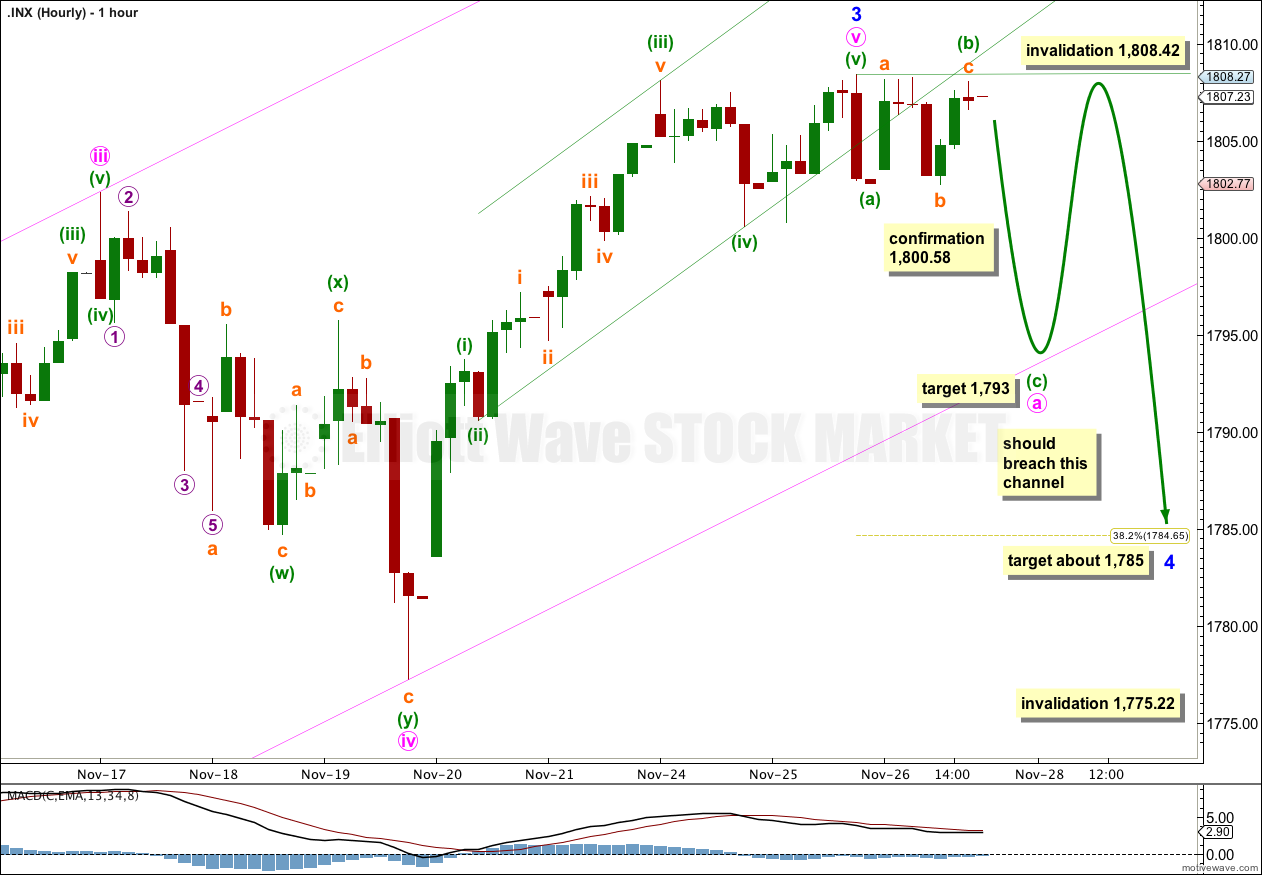
Given the guideline of alternation I would expect minor wave 4 to be deeper than the 0.236 Fibonacci ratio, and to be any corrective structure other than a zigzag.
Minor wave 4 is most likely to be a flat correction. Within the flat minute wave a must subdivide as a three wave structure, and it may be completing as a zigzag. At 1,793 minuette wave (c) within minute wave a would reach 2.618 the length of minuette wave (a). This would see minute wave a find support at the lower edge of the channel containing minor wave 3.
There are several other structural possibilities for minor wave 4, some of which include the possibility of new highs above 1,808.42 within the next few days. At this stage on the five minute chart it looks like a zigzag or impulse is unfolding downwards, because the first wave down labeled minuette wave (a) is a sheer drop which subdivides best as an impulse on the one minute chart.
When the first three down is completed then the upper invalidation point at 1,808.42 must be removed. Minute wave b may make a new price extreme beyond the start of minute wave a at 1,808.42 if minor wave 4 is an expanded flat, regular flat, running triangle or combination.
Overall I will expect choppy, overlapping movement for about one to two weeks. As more structure within minor wave 4 unfolds I will have a clearer idea of when and where it may end. The wave count on the hourly chart will probably change over the next few days.
Minor wave 4 may not move into minor wave 1 price territory. This wave count is invalidated with movement below 1,775.22.
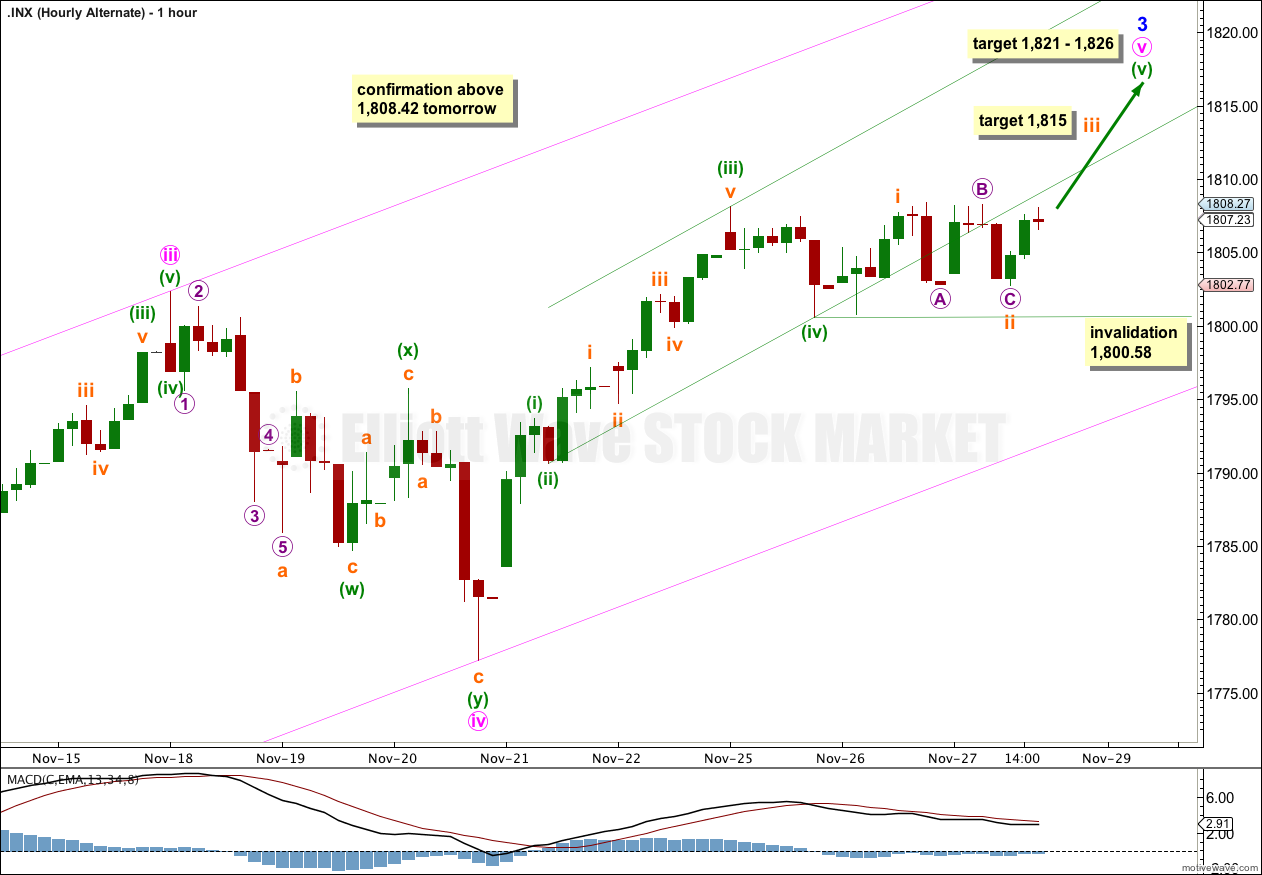
Alternatively, it is still possible that minor wave 3 is incomplete. For this alternate we need to see strong upwards movement tomorrow for it to make sense. It must be confirmed tomorrow with movement above 1,808.42.
At 1,826 minor wave 3 would reach 0.618 the length of minor wave 1. Minor wave 1 is extended, so minor waves 3 and 5 may not be.
At 1,821 minute wave v would reach equality in length with minute wave iii.
Within minute wave (v) subminuette wave ii may not move beyond the start of subminuette wave i. This wave count is invalidated with movement below 1,800.58.
Bullish Alternate Wave Count.
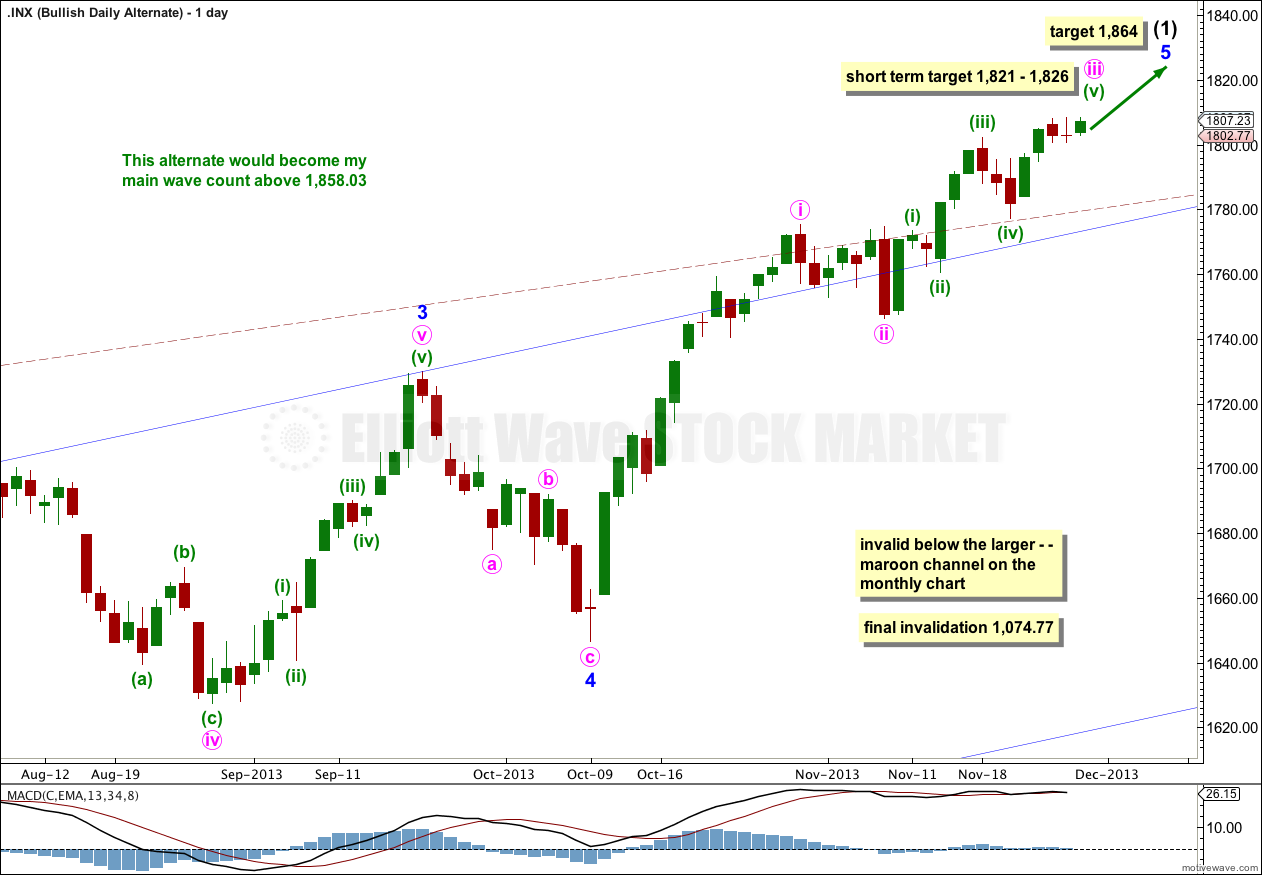
It is possible that a new cycle degree bull market began at 666.79. So far it is not yet halfway through, and I would expect it to last for a few years (at least five more years and maybe longer).
At some stage then the current upwards impulse, labeled intermediate wave (5) for the main wave count and minor wave 5 for this alternate, will be completed. At that stage both wave counts would expect a trend change. The main wave count would expect a huge cycle degree trend change, and this alternate would expect an intermediate degree trend change. If the downwards movement subdivides as a three and remains within the maroon channel then this alternate would be preferred. If it breaches the channel this alternate would be discarded.
The maroon – – – channel is an acceleration channel drawn about primary waves 1 and 2 on the monthly chart (it is drawn in exactly the same way on the main wave count, but there it is termed a corrective channel). I would not expect intermediate wave (2) to breach this channel because a lower degree (intermediate) wave should not breach an acceleration channel of a higher degree (primary) first and second wave.
The daily chart shows the structure of minor wave 5. It is incomplete. Targets are the same because they are calculated using the same wave lengths as the main wave count. This bullish alternate does not diverge from the main wave count at this stage, and it will not for some weeks (or months) to come.
Lara,
You mentioned ‘tomorrow’ several times in today’s analysis. Tomorrow is Thanksgiving Day in the US and think the markets are closed. Did you mean Friday or do you have some other trading data you use?
Happy Thanksgiving from America,
Rodney
Oops… yes, I would then mean Friday.
We don’t have Thanksgiving here so I’m not with the vibe of it.
Happy Thanksgiving!