
During Friday the analysis expected to see more upwards movement with an increase in momentum. This is exactly what happened.
The targets remain the same. The wave count remains the same.
I will review monthly charts in this end of week analysis.
Click on the charts below to enlarge.
Main Wave Count.
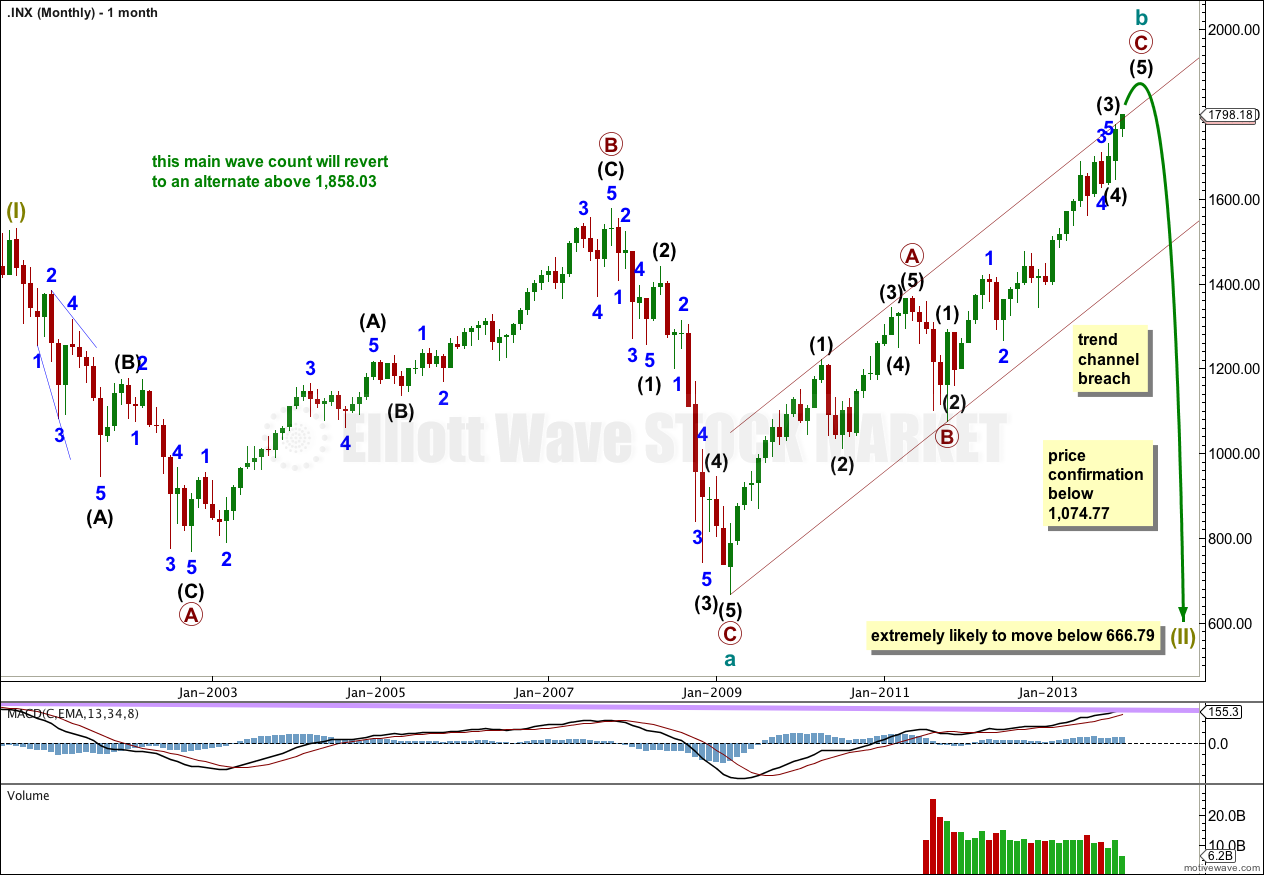
A large super cycle flat (or double combination) may be unfolding.
Within this huge flat correction cycle wave a was a three wave structure, itself a flat. Cycle wave b may be a zigzag which is incomplete.
At 1,858.03 cycle wave b would reach 138% the length of cycle wave a. The maximum common length for a B wave within a flat is 138% the length of the A wave. Above this point this wave count would reduce in probability and it would be more likely that a longer term bull market is underway (alternate wave count).
For the S&P 500 Elliott wave structures are more typical. For the DJIA its Elliott wave structures and ratios are not as typical. For this reason I am using the S&P 500’s wave lengths and structures, rather than the DJIA’s, to guide me as to which of the wave counts, bullish or bearish, is most likely.
For this main wave count primary wave C now overshoots the upper edge of the channel about cycle wave b. This is okay as sometimes C waves do this. If in the future this channel is clearly breached by downwards movement then I would have confidence that there has been a trend change at cycle degree. At that stage I would look at the two possibilities of a flat and a combination or double flat for super cycle wave (II).
At this stage there remains some technical divergence between MACD and price from the September 2000 high to now. If this divergence disappears this wave count would significantly reduce in probability and I would probably then prefer the alternate.
This wave count has a higher probability than the alternate. Upwards movement over the last 4 1/2 years subdivides best as a zigzag. If something is “off” about the supposed recovery then it must be a B wave because there is plenty that is off in this scenario in terms of social mood.
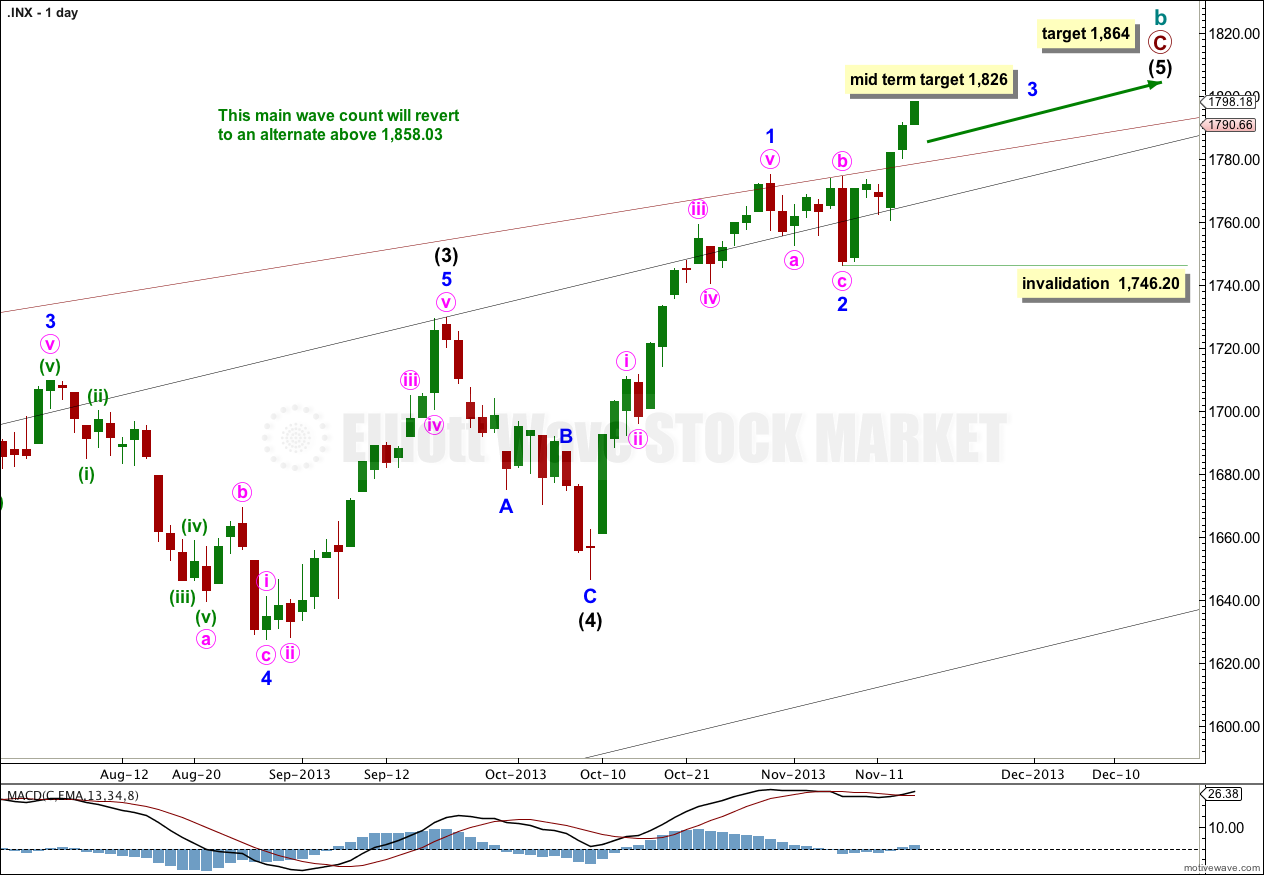
Downwards corrections may now find support along the upper edge of the big maroon channel from the monthly chart, if the upper trend line is pushed out to encompass all of primary wave A.
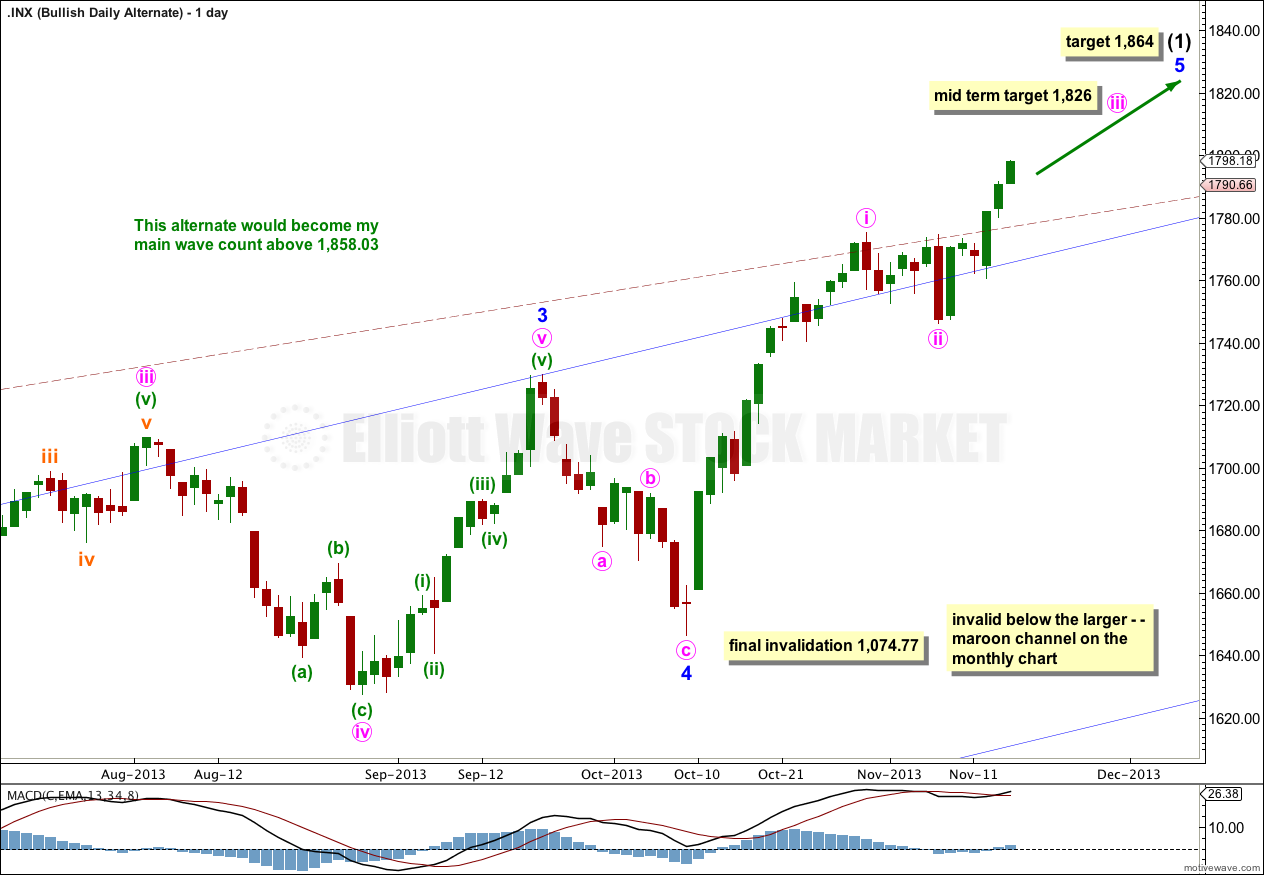
Intermediate wave (5) may be incomplete with just minor waves 1 and now probably 2 within it completed.
At 1,826 minor wave 3 would reach 0.618 the length of minor wave 1. Minor wave 1 is extended, so minor waves 3 and 5 may not be.
At 1,864 intermediate wave (5) would reach equality in length with intermediate wave (1). This is the most common ratio between first and fifth waves so this target has a good probability.
Within minor wave 3 minute wave ii may not move beyond the start of minute wave i. This wave count is invalidated with movement below 1,746.20.
Price is now above the acceleration channel drawn about minute waves i and ii. This is what I expected and indicates that a third wave is unfolding upwards.
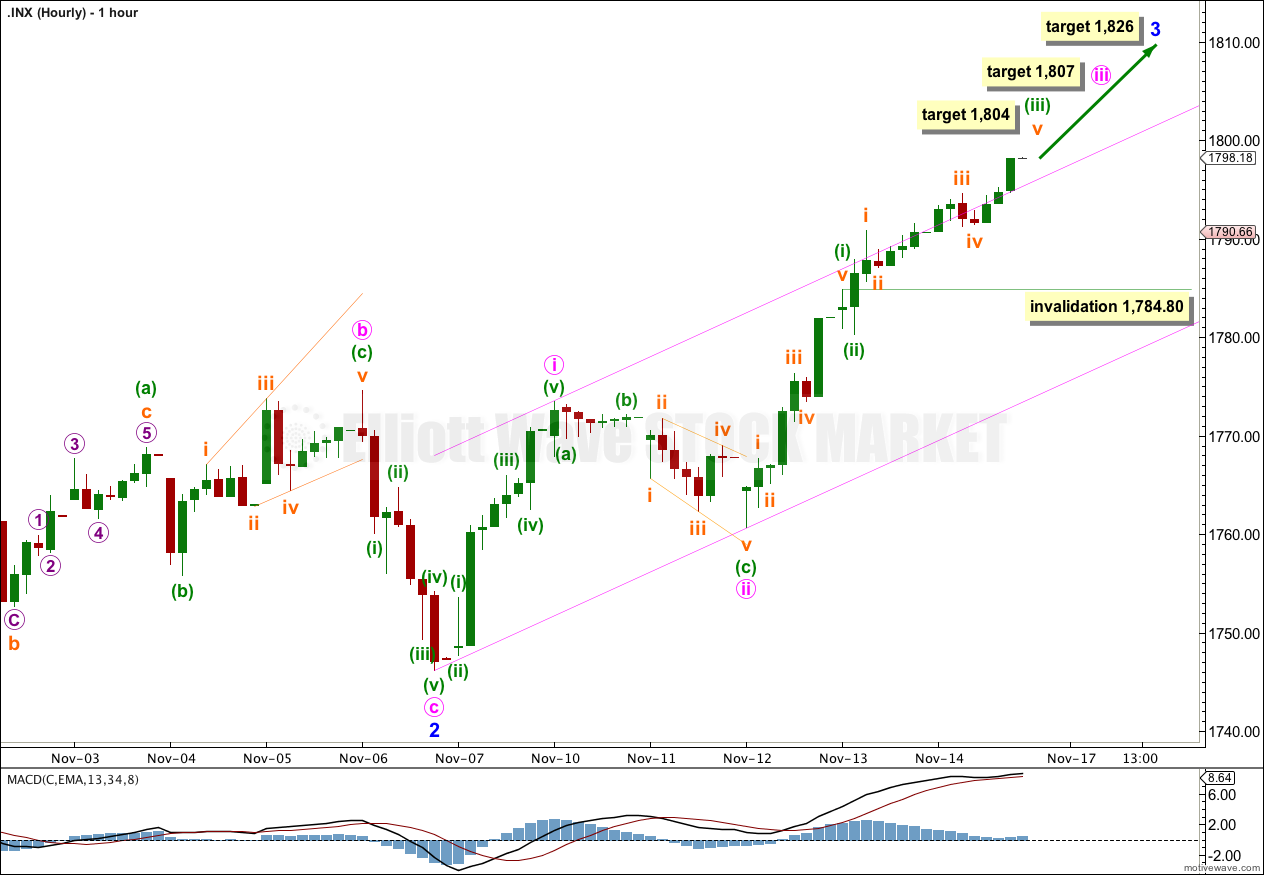
Within minor wave 3 minute waves i and ii are complete. Minute wave iii is still incomplete. At 1,807 it would reach 1.618 the length of minute wave i.
Within minute wave iii minuette waves (i) and (ii) are complete. Minuette wave (iii) looks incomplete on the five minute chart, and I would expect Monday to begin with some upwards movement. At 1,804 minuette wave (iii) would reach equality in length with minuette wave (i).
When minuette wave (iii) is over then the following downwards correction for minuette wave (iv) may not move into minuette wave (i) price territory. This wave count is invalidated with movement below 1,784.80.
Alternate Wave Count.
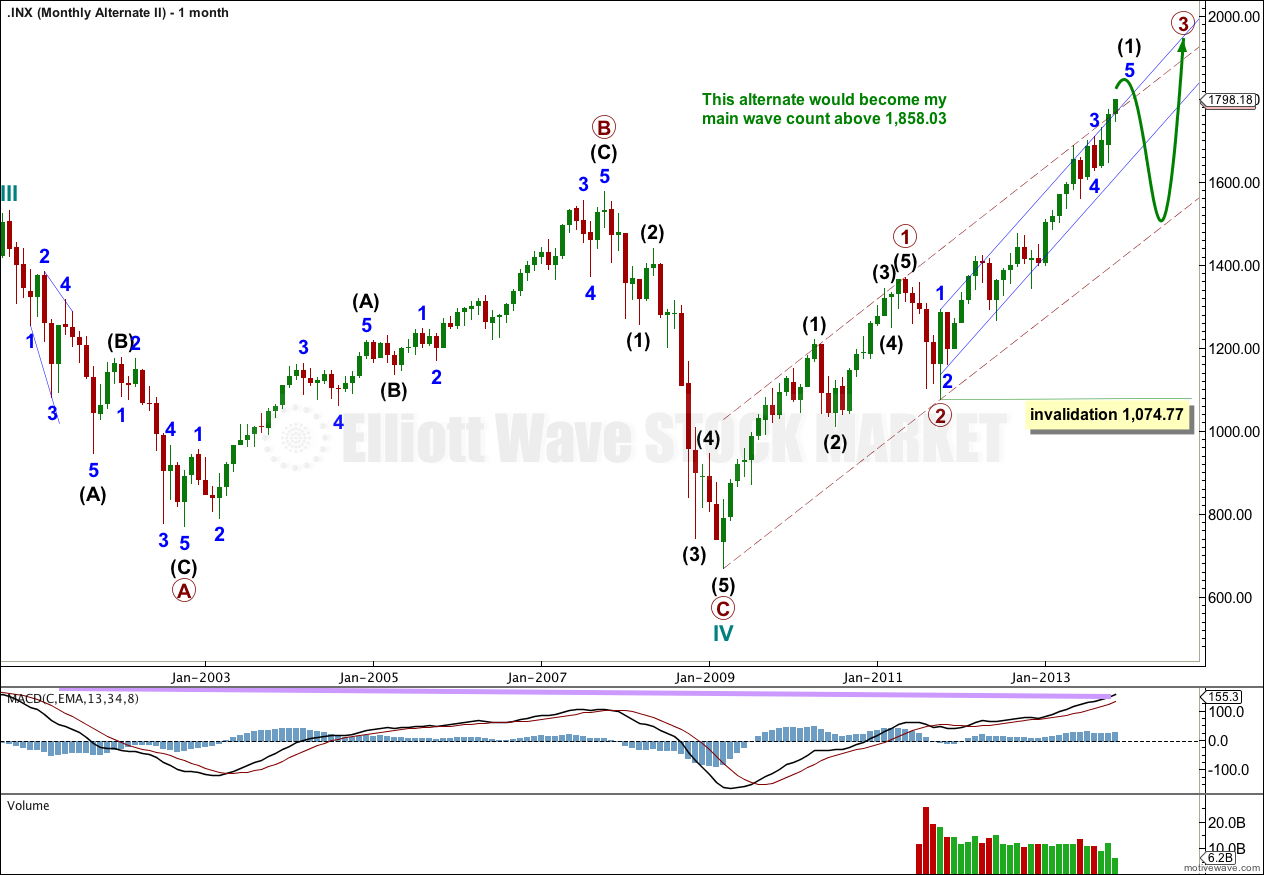
At the monthly chart level I am taking this wave count very seriously now. If upwards movement continues to breach the wide maroon channel, and if technical divergence between price and MACD from the high at September 2000 disappears, this wave count would increase in probability.
It is possible that a new cycle degree bull market began at 666.79. So far it is not yet halfway through so I would expect it to last for a few years yet, at least five more years and maybe longer.
At some stage then the current upwards impulse, labeled intermediate wave (5) for the main wave count and minor wave 5 for this alternate, will be completed. At that stage both wave counts would expect a trend change. The main wave count would expect a huge cycle degree trend change, and this alternate would expect an intermediate degree trend change. If the downwards movement subdivides as a three and remains within the maroon channel then this alternate would be preferred. If it breaches the channel this alternate would be discarded.
The maroon – – – channel is an acceleration channel. I would not expect intermediate wave (2) to breach this channel. If downwards movement breaches the channel I would discard this wave count.
The daily chart shows the structure of minor wave 5. It is incomplete. Targets are the same because they are calculated using the same wave lengths as the main wave count. This bullish alternate does not diverge from the main wave count at this stage, and it will not for some weeks to come.
Hi Lara-
Just curious if you could tell me how you calculated 1858.03 as 1.382% of a. Another EW site has 1891.35. It’s weird because I’m not sure how either one of those values are calculated as I thought 1922 was the 138.2% extension of the decline from 1576-667.
I have the movement beginning at 1,530.01, September 2000. The prior movement ended in a truncated fifth wave; the last upwards wave subdivides as a five not a three (I’ve checked this on a daily chart).
That may be the cause of the difference.
With this start then cycle a is from 1,530.01 to 666.79; 863.22 points in length.
138% of 863.22 = 1,191.24 points. From 666.79 this is 1,858.03.