
Yesterday’s analysis expected more upwards movement to increase in momentum after a second wave correction which is what has happened.
The wave count remains the same.
Click on the charts below to enlarge.
Main Wave Count.
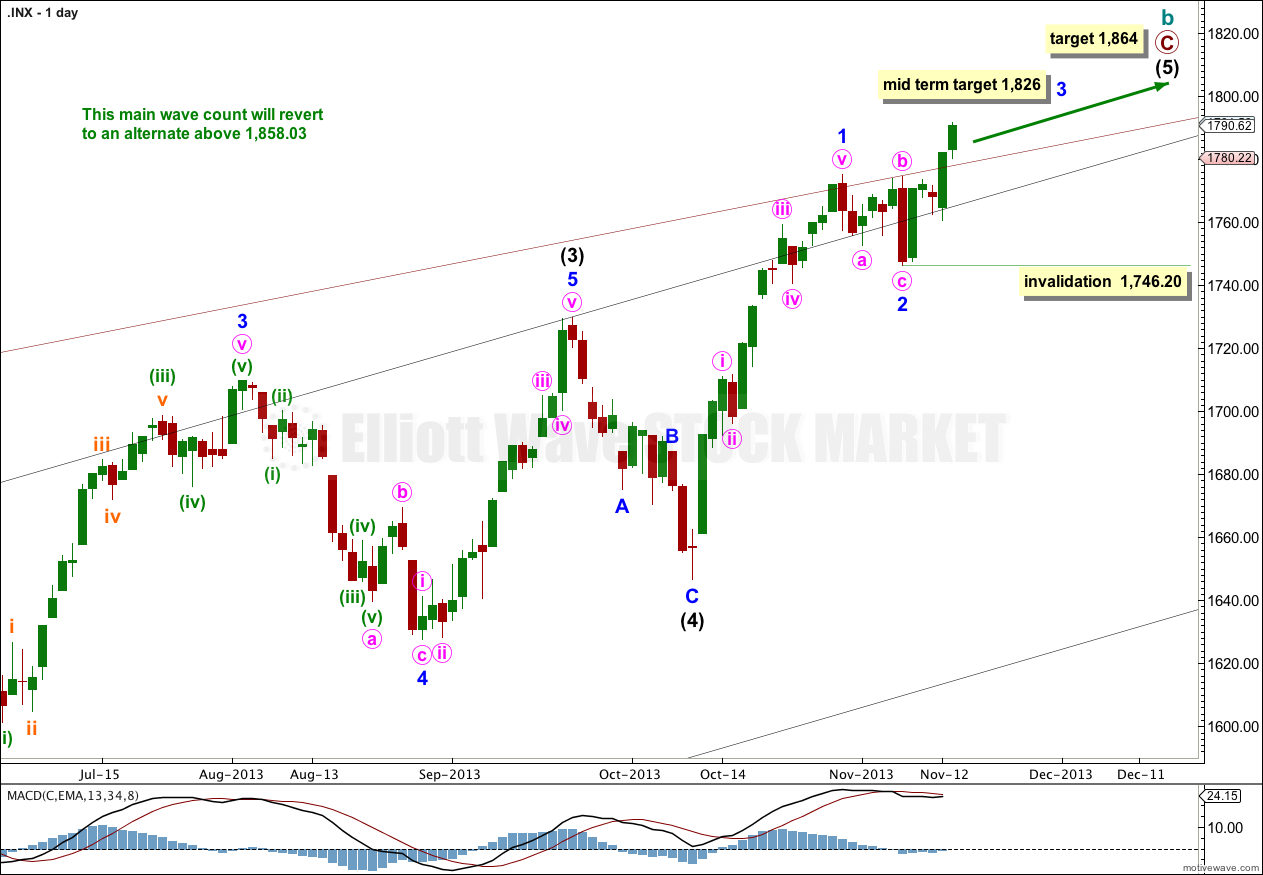
This wave count has a higher probability than the alternate. Upwards movement over the last 4 1/2 years subdivides best as a zigzag. If something is “off” about the supposed recovery then it must be a B wave because there is plenty that is off in this scenario in terms of social mood.
Downwards corrections may now find support along the upper edge of the big maroon channel from the monthly chart, if the upper trend line is pushed out to encompass all of primary wave A.
At 1,858.03 cycle wave b would reach 138% the length of cycle wave a. This wave count sees a super cycle expanded flat unfolding, and the maximum common length for a B wave within a flat is 138% the length of the A wave. Above this point this wave count would reduce in probability and it would be more likely that a longer term bull market is underway.
Intermediate wave (5) may be incomplete with just minor waves 1 and now probably 2 within it completed.
At 1,826 minor wave 3 would reach 0.618 the length of minor wave 1. Minor wave 1 is extended, so minor waves 3 and 5 may not be.
At 1,864 intermediate wave (5) would reach equality in length with intermediate wave (1). This is the most common ratio between first and fifth waves so this target has a good probability.
Within minor wave 3 minute wave ii may move beyond the start of minute wave i. This wave count is invalidated with movement below 1,746.20.
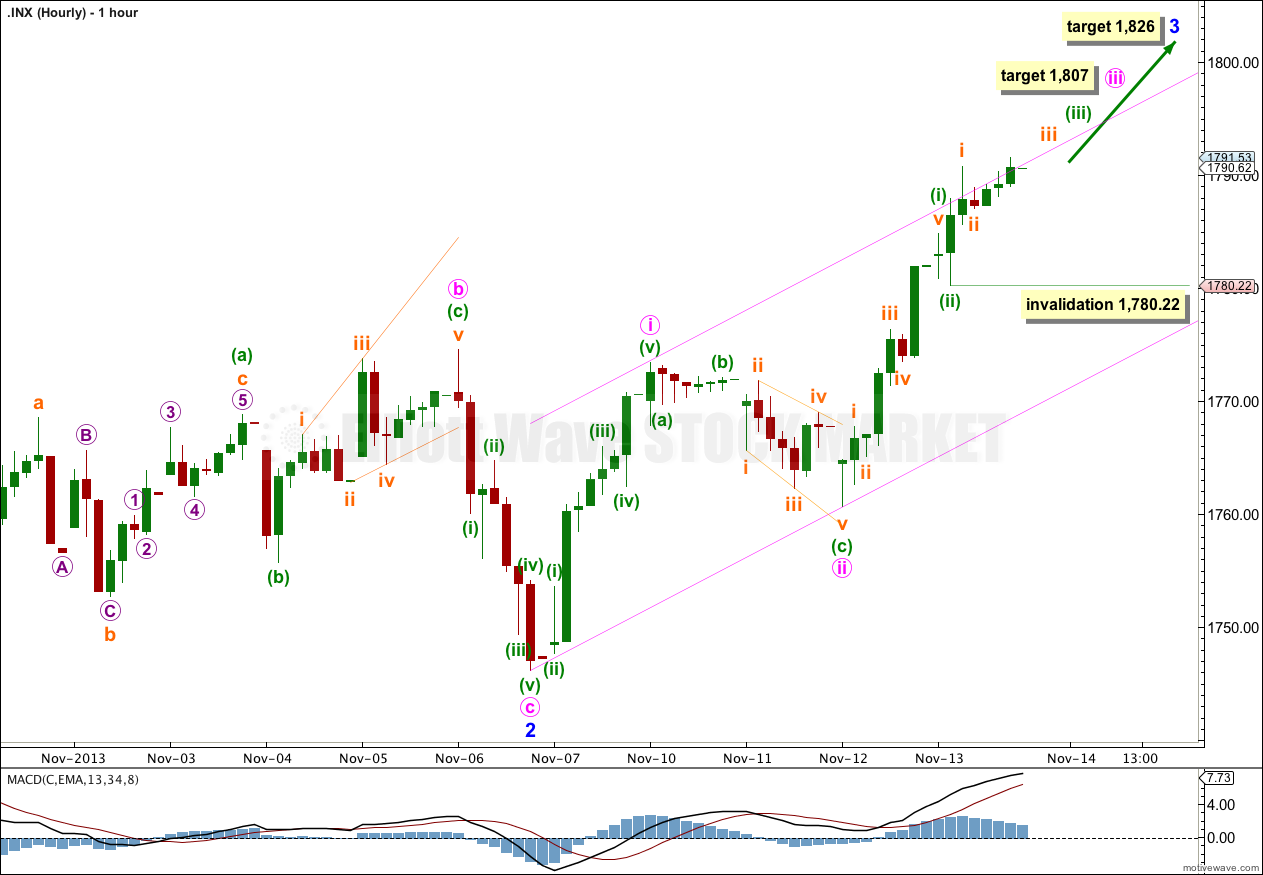
The second wave correction I was looking for probably happened early in Thursday’s session. Minuette wave (ii) may have completed as a shallow zigzag correction after the fifth wave within minuette wave (i) moved a little higher.
Ratios within minuette wave (i) are: subminuette wave iii is 0.22 points short of 1.618 the length of subminuette wave i, and now subminuette wave v is just 0.06 points longer than equality with subminuette wave iii.
Within minuette wave (iii) we may now have seen subminuette wave i completed; on the five minute chart it subdivides perfectly as a small five wave impulse.
The short / mid term target for minute wave iii at this stage will remain the same. Minute wave iii would reach 1.618 the length of minute wave i at 1,807. Minute wave iii should breach the acceleration channel to the upside.
On the five minute chart the structure within the start of subminuette wave iii within minuette wave (iii) has many overlaps. This may be a series of first and second waves which would indicate a further increase in upwards momentum tomorrow, and maybe also Monday.
Within minuette wave (iii) no second wave correction may move beyond the start of its first wave. This wave count is invalidated with movement below 1,780.22.
Alternate Bullish Wave Count.
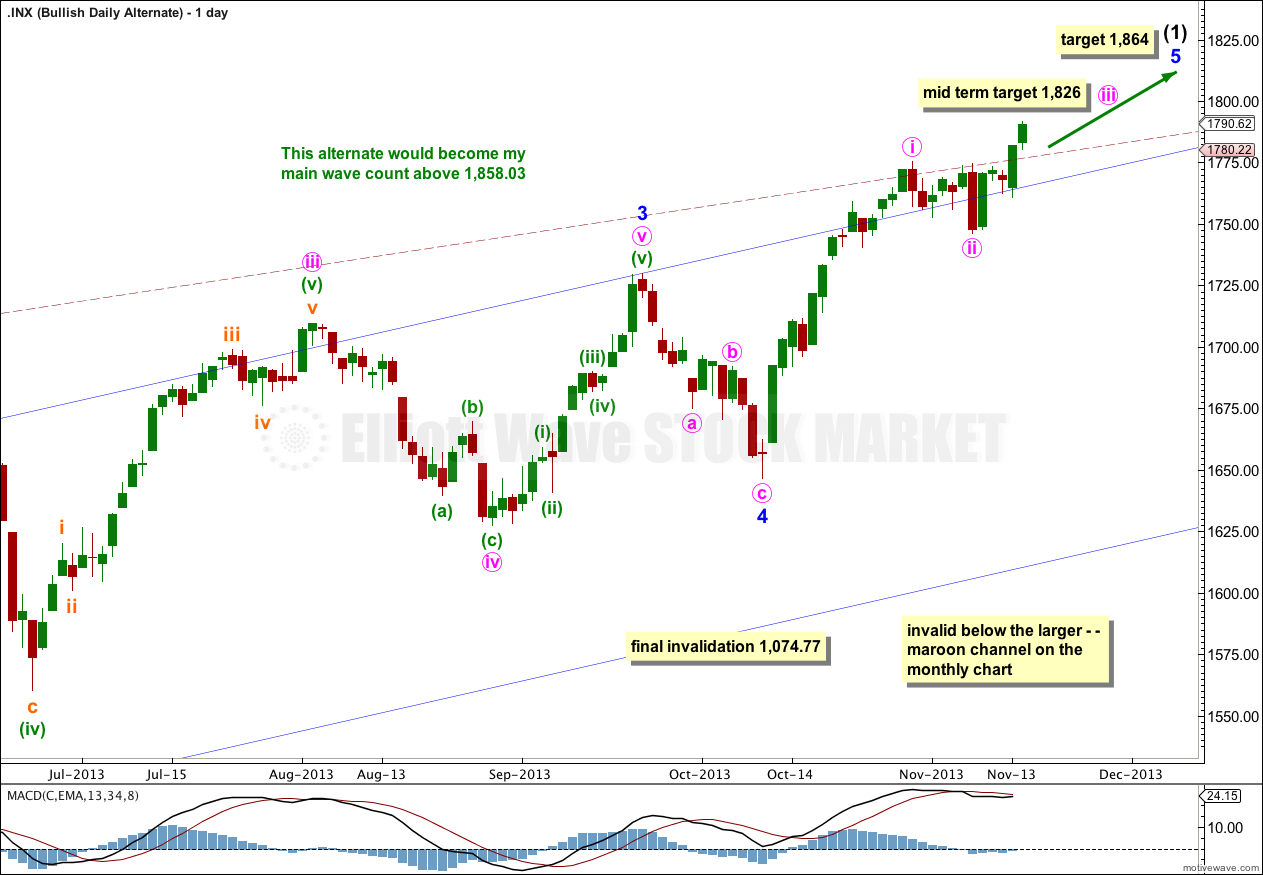
It is possible that we are and have been in a new bull market for a cycle degree fifth wave for the last four and a half years. Cycle waves should last from one to several years (as a rough guideline).
At this stage this bullish alternate does not diverge from the main wave count. The end of intermediate wave (1) is calculated using the same wave lengths and ratios.
When intermediate wave (1) could again be considered complete then this alternate would also expect downwards movement. At that stage the direction expected would be the same as the main wave count, but this alternate would expect a corrective structure downwards where the main wave count would expect an impulse downwards.
This bullish alternate expects that only a first wave within a primary degree third wave is coming closer to an end. When the second wave at intermediate wave degree is completed this alternate would expect a very strong and sustained rise with a good increase in upwards momentum. That strong rise is still probably months away.
Dear Lara,
When you write :
the maximum common length for a B wave within a flat is 138% the length of the A wave
What do you mean by the ‘common’ length? Is there an ‘uncommon’ length that is allowable by Elliott wave rules?
Thanks in advance for your answer. One note of appreciation,; It is a great benefit of this website to have this ‘Comment’ section’. Not only do we have the ability to communicate with other subscribers, but we also have the privilege of your responses to our questions. This is not ‘common’. 🙂
Thanks,
Rodney
There is a guideline which states the common length of a B wave within a flat is 100% to 138%. Unfortunately there is no maximum limit to the length of a B wave within a flat.
There is another guideline which states B waves are rarely over twice the length of A waves within flats. I have seen flats with B waves longer than this though. It is rare. Once a B wave is longer than twice the length of the A wave I would either discard the wave count or have it only as a very unlikely alternate.
Most thorough analysis I have read to date. Unlike the clue-less folk at another other well-known site, you have the intelligence and humility to recognize that not every wave count is necessarily bearish! In fact ,I never made any good trades until I started doing the exact opposite of what these perpetually wrong perma-bears have been claiming the last three years,