
Last analysis expected a little more upwards movement for Tuesday before a second wave correction began.
The second wave correction had already begun, and price did not move higher.
I have again an alternate which looks at the possibility of a trend change at cycle degree.
Click on the charts below to enlarge.
Main Wave Count.
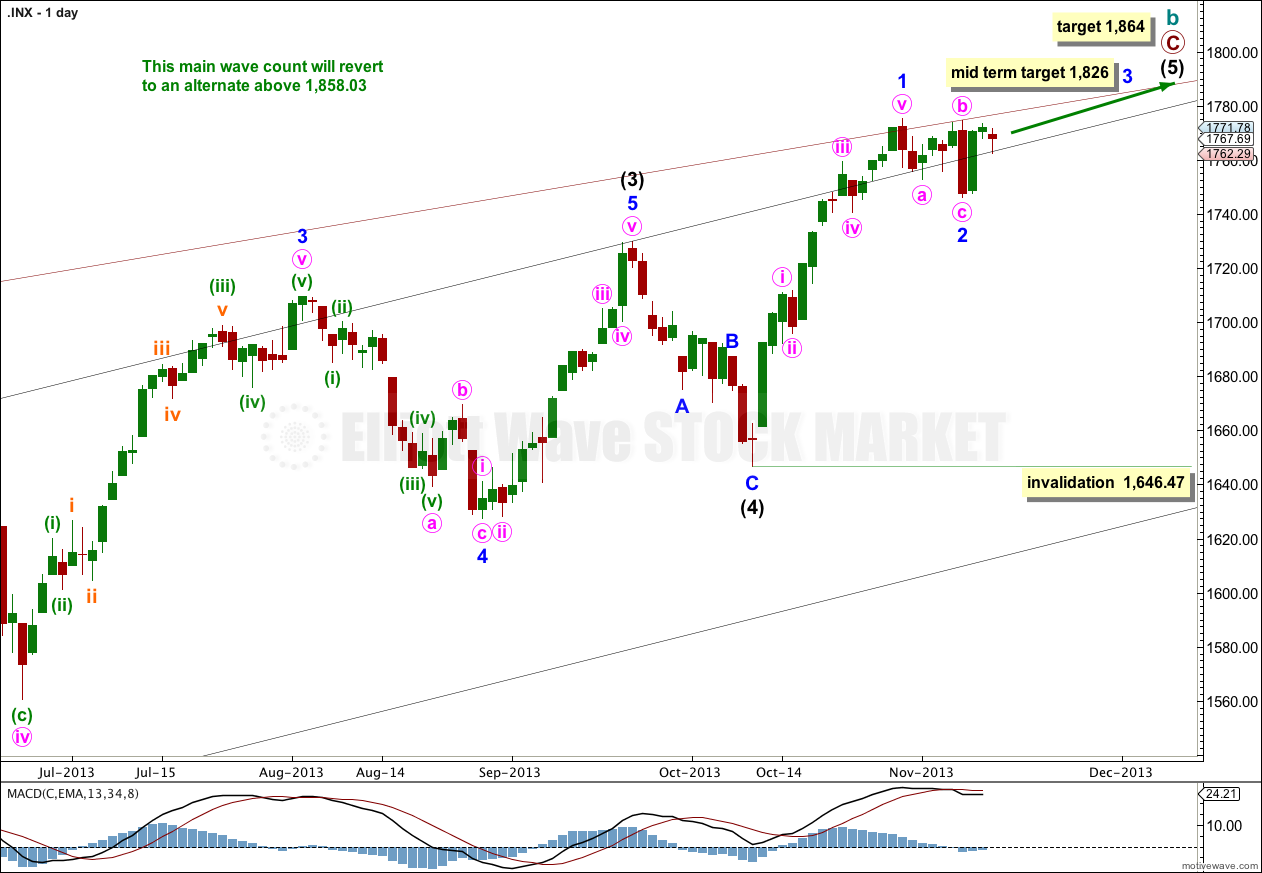
This wave count has a higher probability than the alternate. Upwards movement over the last 4 1/2 years subdivides best as a zigzag. If something is “off” about the supposed recovery then it must be a B wave because there is plenty that is off in this scenario in terms of social mood.
Price may continue to find resistance along the upper edge of the big maroon channel from the monthly chart, if the upper trend line is pushed out to encompass all of primary wave A.
At 1,858.03 cycle wave b would reach 138% the length of cycle wave a. This wave count sees a super cycle expanded flat unfolding, and the maximum common length for a B wave within a flat is 138% the length of the A wave. Above this point this wave count would reduce in probability and it would be more likely that a longer term bull market is underway.
Intermediate wave (5) may be incomplete with just minor waves 1 and now probably 2 within it completed. Movement above 1,775.22 would confirm this wave count.
At 1,826 minor wave 3 would reach 0.618 the length of minor wave 1. Minor wave 1 is extended, so minor waves 3 and 5 may not be.
At 1,864 intermediate wave (5) would reach equality in length with intermediate wave (1). This is the most common ratio between first and fifth waves so this target has a good probability.
Within intermediate wave (5) minor wave 2 may move beyond the start of minor wave 1. This wave count is invalidated with movement below 1,646.47.
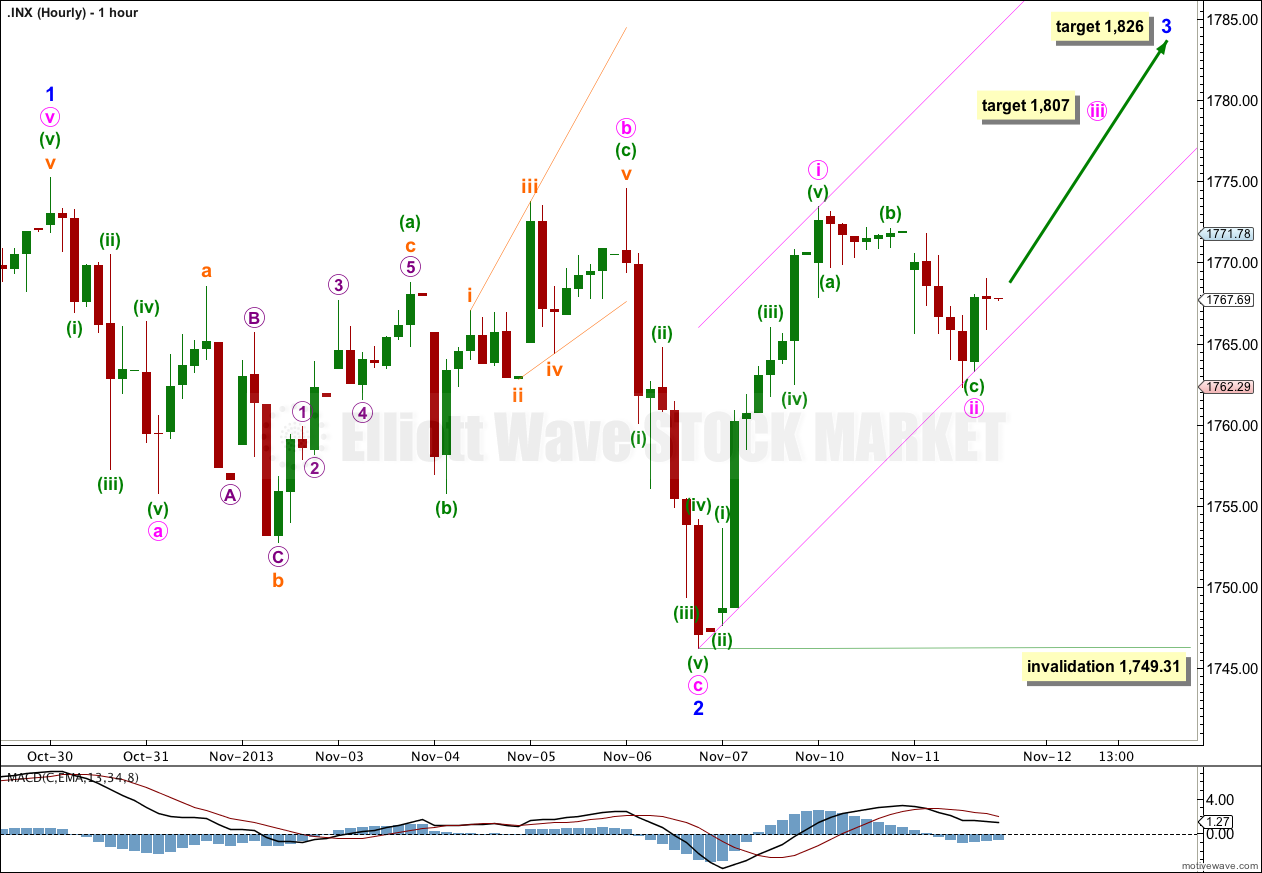
Minute wave i may have been already completed, and the triangle may have been minuette wave (b) within minute wave ii. On the five minute chart minute wave ii subdivides nicely into a zigzag, albeit with a couple of truncations involved. Movement above 1,769.69 tomorrow would give me a little confidence in this wave count. At that stage the downwards movement labeled minute wave ii could not be an impulse unfolding downwards because price would be within wave one territory.
For this main wave count it would be most likely that minute wave ii is a completed zigzag because it is in proportion to minute wave i: minute wave i lasted 10 hours, and so far minute wave ii has lasted 13 hours.
This main wave count expects an increase in upwards momentum over the next few days.
Minute wave iii would reach 1.618 the length of minute wave i at 1,807. Minute wave iii should breach the acceleration channel to the upside.
If minute wave ii moves lower it may not move beyond the start of minute wave i below 1,749.31.
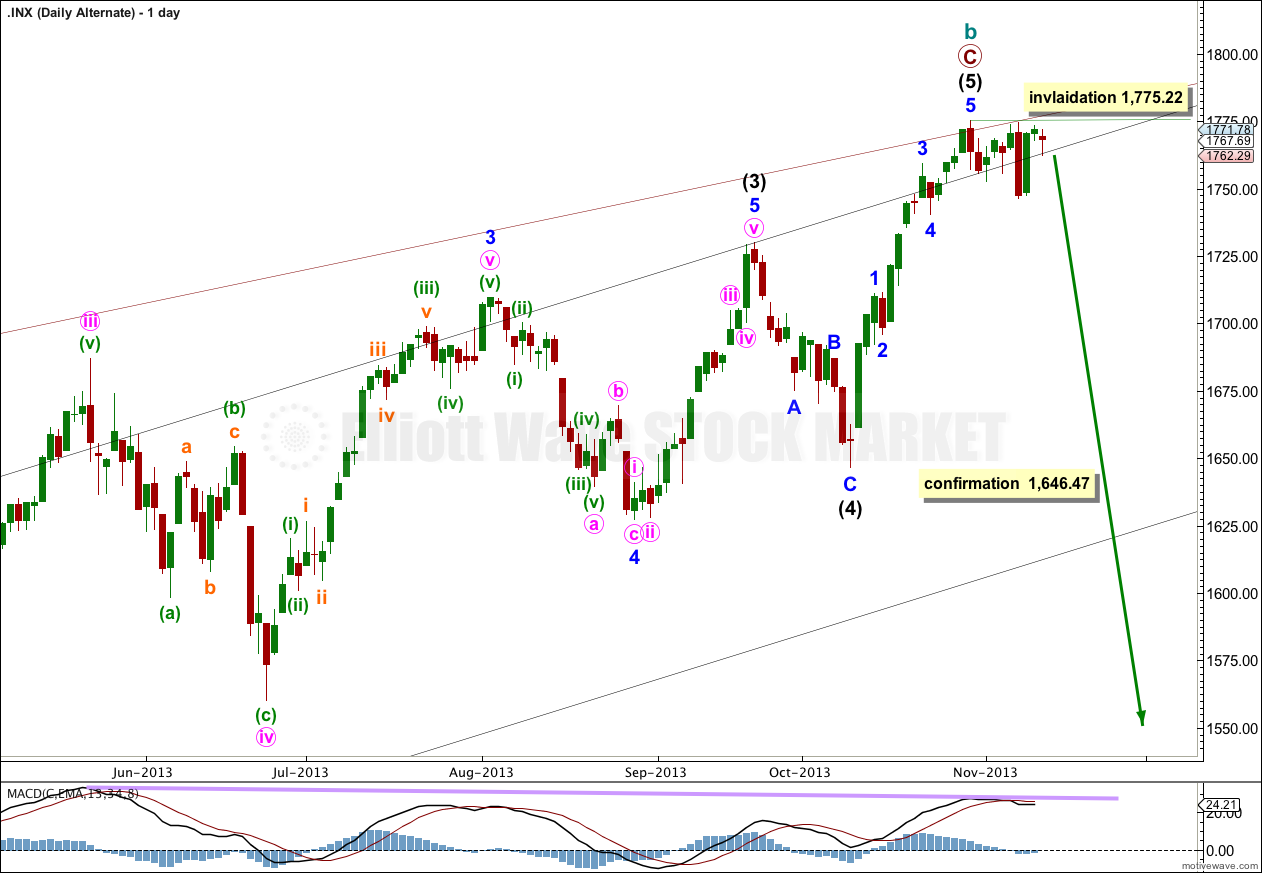
If the DJIA has had a truncated fifth wave then it is also possible that both markets have recently turned.
If the S&P 500 has turned then we may have a series of first and second waves to the downside. Movement above 1,775.22 would invalidate this idea. Movement below 1,746.20 would make me more seriously consider it.
If we have had a trend change then we should see movement below 1,746.20 very soon as a third wave gathers momentum to the downside.
Alternate Bullish Wave Count.
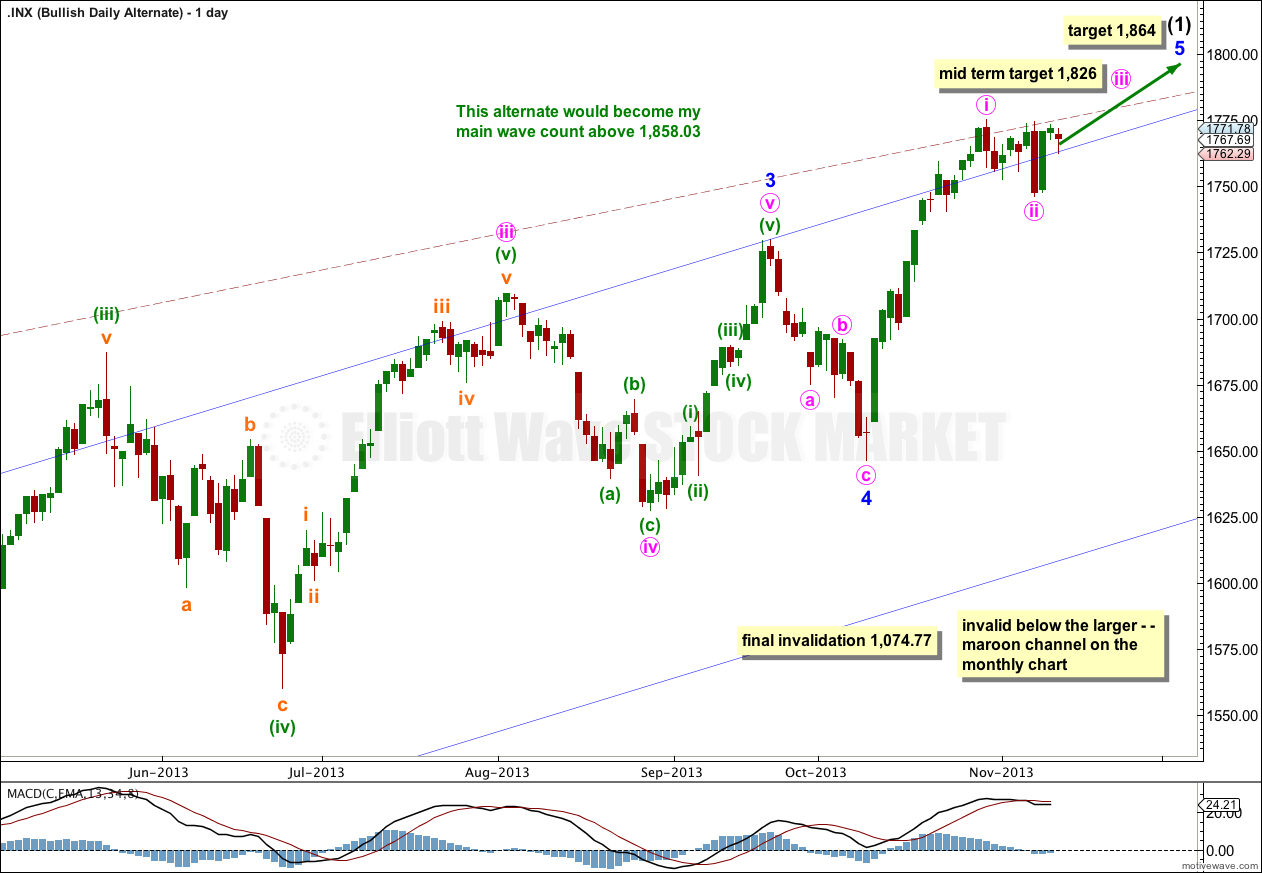
It is possible that we are and have been in a new bull market for a cycle degree fifth wave. Cycle waves should last from one to several years (as a rough guideline).
At this stage this bullish alternate does not diverge from the main wave count. The end of intermediate wave (1) is calculated using the same wave lengths and ratios.
When intermediate wave (1) could again be considered complete then this alternate would also expect downwards movement. At that stage the direction expected would be the same as the main wave count, but this alternate would expect a corrective structure downwards where the main wave count would expect an impulse downwards.
Hi Lara,
Many thanks for all your detailed analysis.
Is it possible that minuette wave (c) of minute wave (ii) down completed today as an ending diagonal ?
Tyke
Yes, that’s what I have it in the next analysis of 13th November.
It needed one final bit down to complete it though.