
Movement above 1,755.72 has clarified the situation, confirming the main wave count and invalidating the alternate. The S&P 500 has not had a big trend change and I will expect new highs.
I will continue to publish the bullish alternate wave count alongside the main wave count. As price continues higher the probability of the bullish alternate increases. At 1,858.03 I will swap the two over.
Click on the charts below to enlarge.
Main Wave Count.
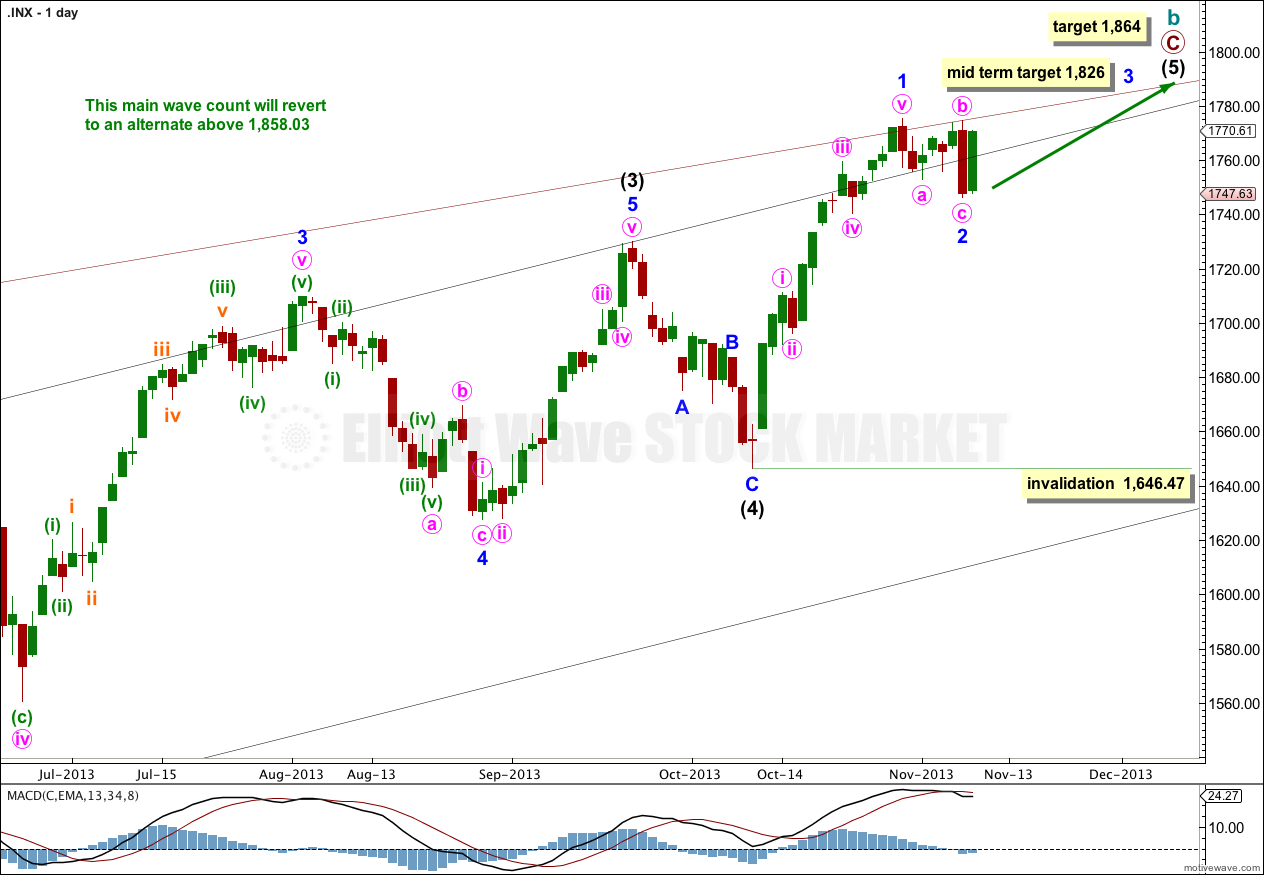
This wave count has a higher probability than the alternate. Upwards movement over the last 4 1/2 years subdivides best as a zigzag. If something is “off” about the supposed recovery then it must be a B wave because there is plenty that is off in this scenario in terms of social mood.
Price may continue to find resistance along the upper edge of the big maroon channel from the monthly chart, if the upper trend line is pushed out to encompass all of primary wave A.
At 1,858.03 cycle wave b would reach 138% the length of cycle wave a. This wave count sees a super cycle expanded flat unfolding, and the maximum common length for a B wave within a flat is 138% the length of the A wave. Above this point this wave count would reduce in probability and it would be more likely that a longer term bull market is underway.
Intermediate wave (5) is incomplete with just minor waves 1 and now probably 2 within it completed. Today I have two hourly charts for you. The first expects minor wave 2 is over, and the second looks at the possibility it may only be halfway through.
At 1,826 minor wave 3 would reach 0.618 the length of minor wave 1. Minor wave 1 is extended, so minor waves 3 and 5 may not be.
At 1,864 intermediate wave (5) would reach equality in length with intermediate wave (1). This is the most common ratio between first and fifth waves so this target has a good probability.
Within intermediate wave (5) minor wave 2 may move beyond the start of minor wave 1. This wave count is invalidated with movement below 1,646.47.
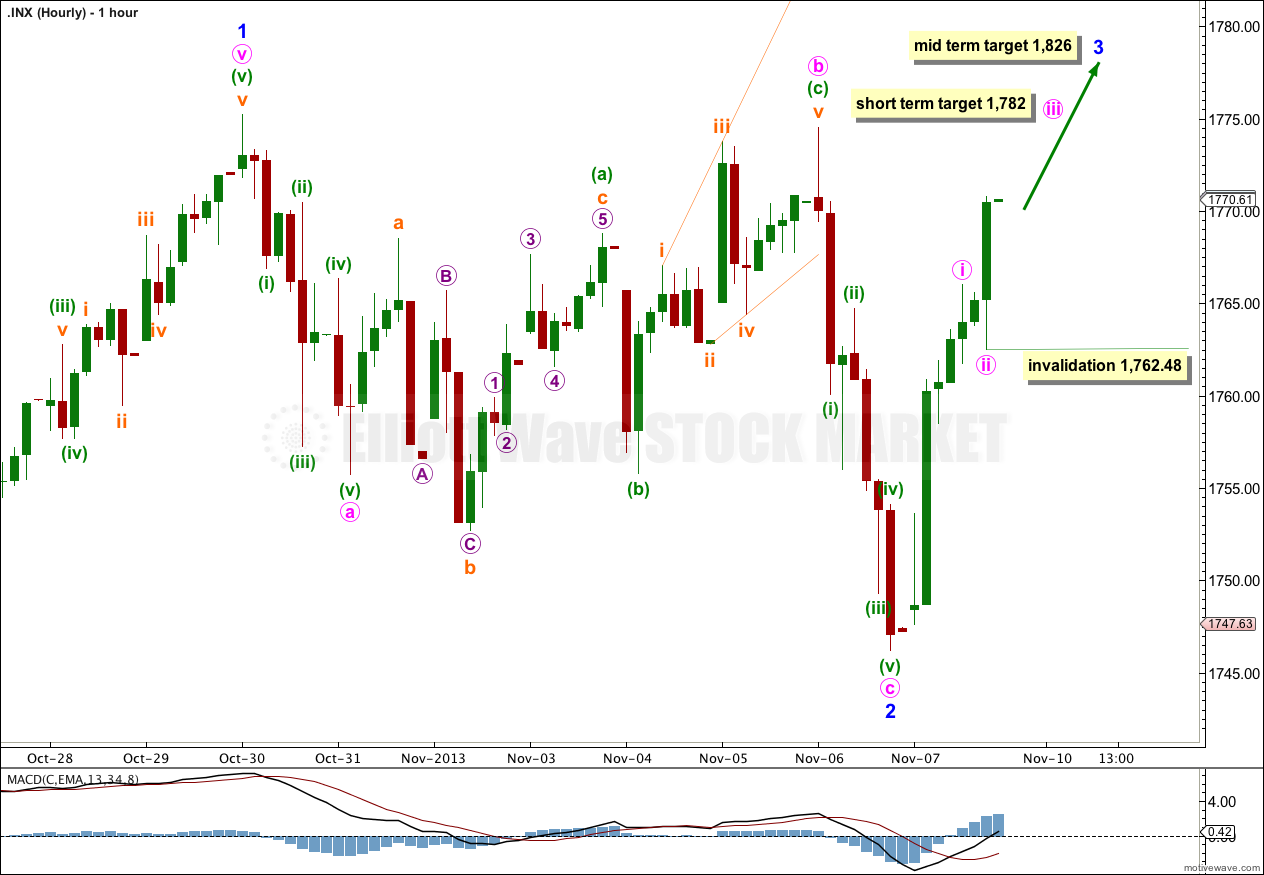
If minor wave 2 is completed then its duration was almost exactly 0.236 the duration of minor wave 1. Because this is quite brief I will also consider the next chart below which looks at the possibility that minor wave 2 is not over.
If minor wave 2 is complete than next week should see an increase in upwards momentum as the middle of a third wave unfolds. At 1,782 minute wave iii would reach equality with minute wave i. I am using the ratio of equality for this target because minute wave ii was so shallow.
Within minute wave iii no second wave correction may move beyond the start of the first wave. This wave count is invalidated with movement below 1,762.48.
When minute wave iii is completed then the invalidation point must move up to the high of minute wave i at 1,766. The following fourth wave correction may not move back into first wave price territory. At that point this first hourly chart will diverge with the second chart below, and movement below 1,766 would invalidate this first chart and confirm the second.
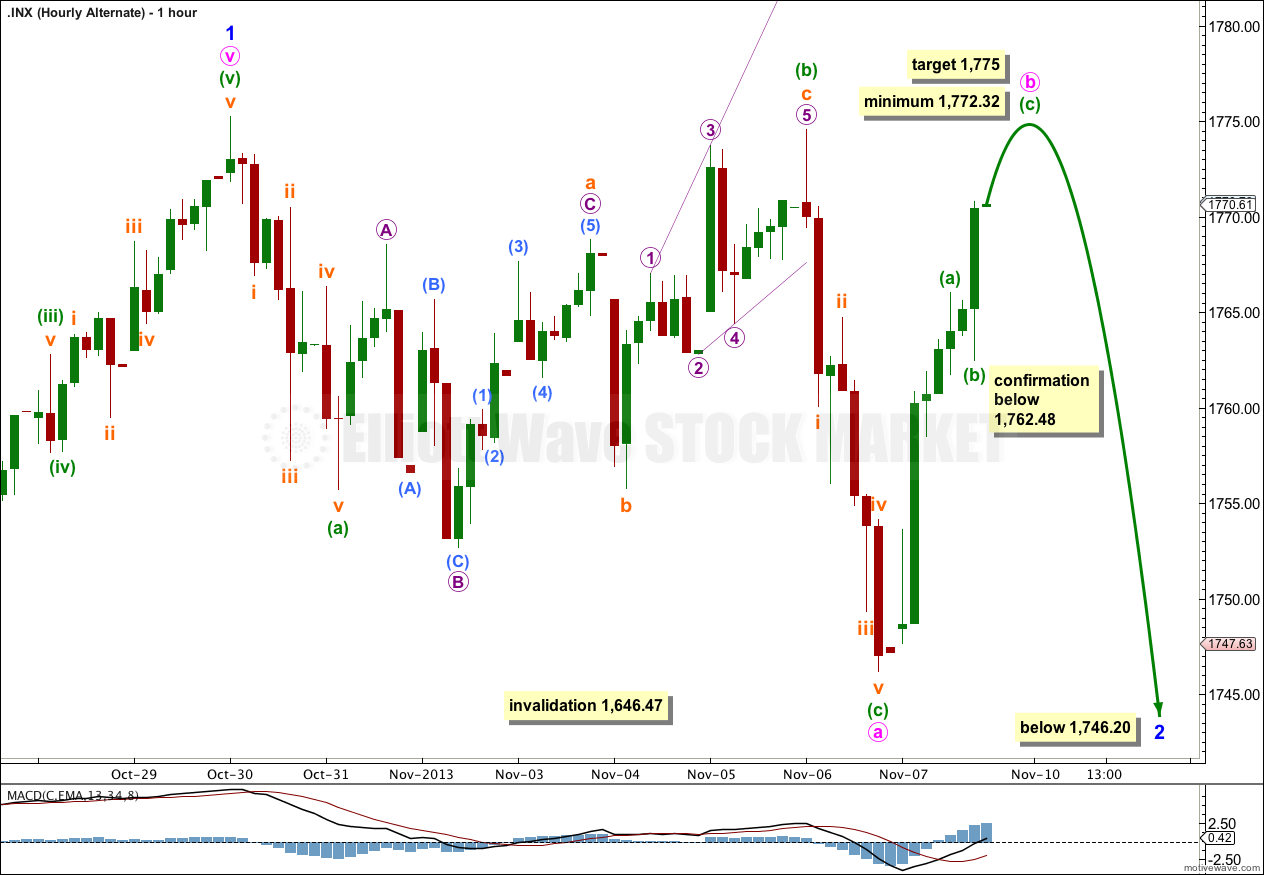
By simply moving the degree of labeling within minor wave 2 all down one degree it is possible that it is incomplete, and that within it only minute wave a is complete. Minor wave 2 may be unfolding as a more time consuming flat correction, or maybe a double combination (zigzag – X – second corrective structure).
If minor wave 2 is continuing as a flat then within it minute wave b must reach at least 90% the length of minute wave a at 1,772.32. At 1,775 minuette wave (c) would reach 0.618 the length of minuette wave (a).
If minor wave 2 is continuing as a combination then within it the upwards zigzag for minute wave X does not have to be a minimum of 90% the length of the first corrective structure minute wave W. If upwards movement fails to reach 1,772.32 and turns lower to breach 1,762.48 then a combination would be unfolding. That would expect sideways movement for a few days.
Thereafter, if price turns and moves below 1,762.48, this second hourly chart would be confirmed and the first chart invalidated.
If minor wave 2 is an incomplete flat then within it minute wave c would be extremely likely to make a new low below the end of minute wave a at 1,746.20 to avoid a truncation and a very rare running flat.
Minor wave 2 may not move beyond the start of minor wave 1. This wave count is invalidated with movement below 1,646.47.
Alternate Wave Count.
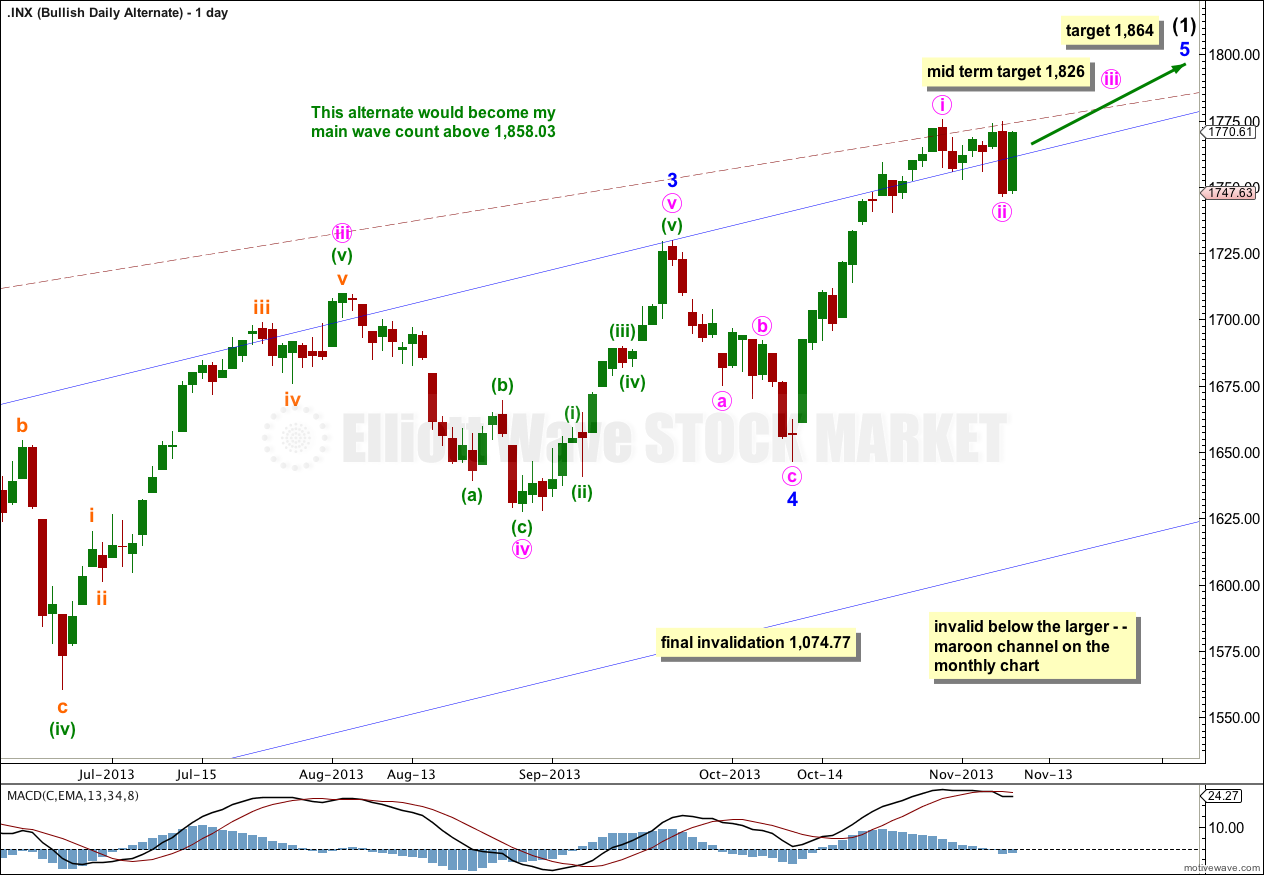
It is possible that we are and have been in a new bull market for a cycle degree fifth wave. Cycle waves should last from one to several years (as a rough guideline).
At this stage this bullish alternate does not diverge from the main wave count. The end of intermediate wave (1) is calculated using the same wave lengths and ratios.
When intermediate wave (1) could again be considered complete then this alternate would also expect downwards movement. At that stage the direction expected would be the same as the main wave count, but this alternate would expect a corrective structure downwards where the main wave count would expect an impulse downwards.
Hi Lara-
Does the fact the VIX cannot seem to make a lower low increase the probability we are in a cycle wave B as well? We have really not come close to breaking the 11.05 print in March. I think we hit the high 11’s once in early Aug, but it immediately headed up as the market corrected from 1710. Does the fact the low print during this rally has also been well above the 2003-2007 low of 9.39 also increase the probability of a cycle wave B?
I’m sorry, I can’t make a comment on that. I don’t use the VIX. I use momentum, volume (a little), trend channels and Elliott wave.
Although I would expect an increase in volatility about a big trend change, so if volatility continues to be high then maybe that could be an indication of an upcoming trend change.