
Yesterday’s analysis expected downwards movement which is exactly what happened. This is the point at which the two hourly wave counts for the main daily wave count diverge. The next two to three days should illustrate which wave count has a higher probability.
Click on the charts below to enlarge.
Main Wave Count.
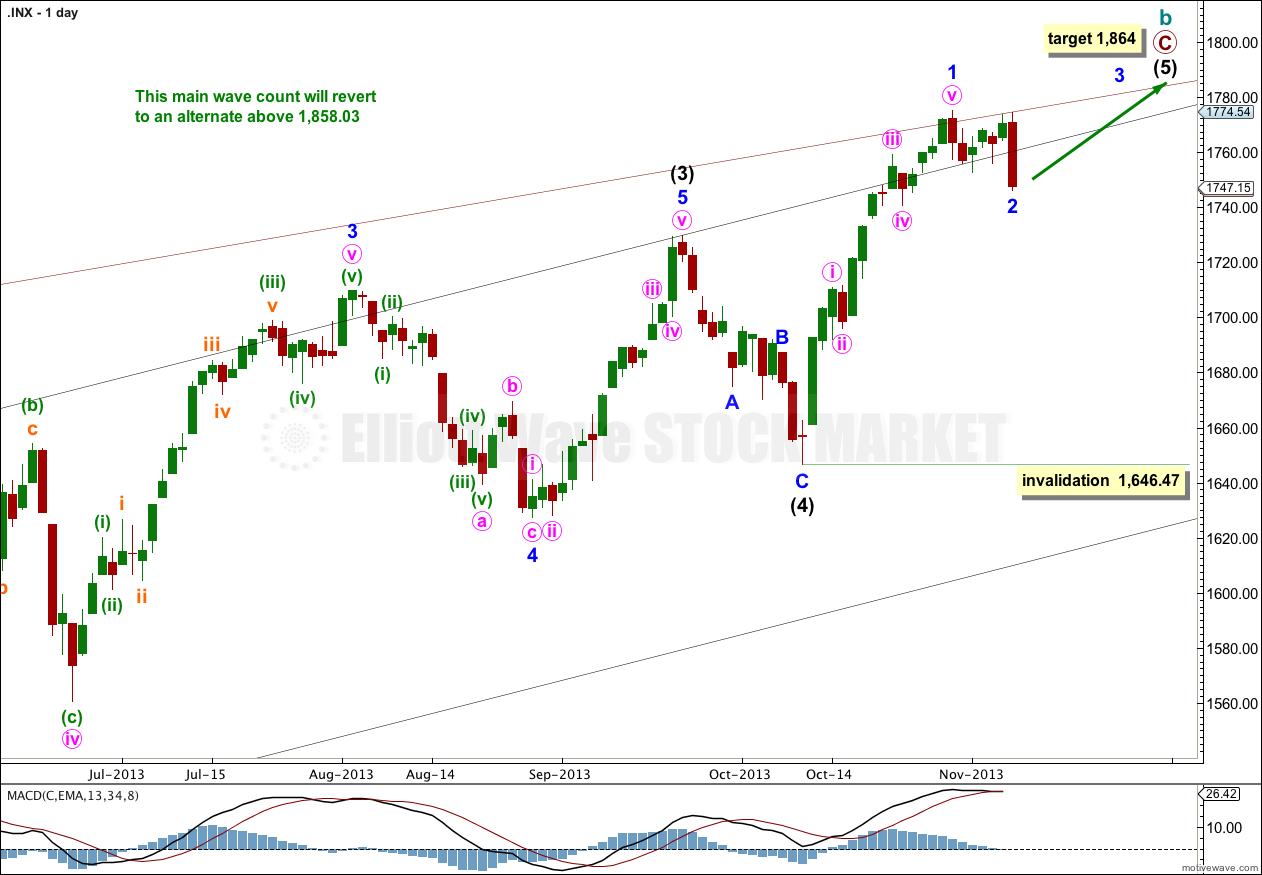
This wave count has a higher probability than the alternate. Upwards movement over the last 4 1/2 years subdivides best as a zigzag. If something is “off” about the supposed recovery then it must be a B wave because there is plenty that is off in this scenario in terms of social mood.
Price may have found resistance along the upper edge of the big maroon channel from the monthly chart, if the upper trend line is pushed out to encompass all of primary wave A.
At 1,858.03 cycle wave b would reach 138% the length of cycle wave a. This wave count sees a super cycle expanded flat unfolding, and the maximum common length for a B wave within a flat is 138% the length of the A wave. Above this point this wave count would reduce in probability and it would be more likely that a longer term bull market is underway.
Intermediate wave (5) is either incomplete with just minor wave 1 within it completed (as per the first hourly chart below) or, if we move the degree of labeling within it up one degree, intermediate wave (5) and in turn cycle wave b may now be completed.
However, we should always assume the trend remains the same until proven otherwise. I now have four conditions to be satisfied in looking for a trend change. As each condition is satisfied my confidence in this trend change would increase.
At 1,864 intermediate wave (5) would reach equality in length with intermediate wave (1). This is the most common ratio between first and fifth waves so this target has a good probability.
Within intermediate wave (5) no second wave correction may move beyond the start of the first wave. This wave count is invalidated with movement below 1,646.47.
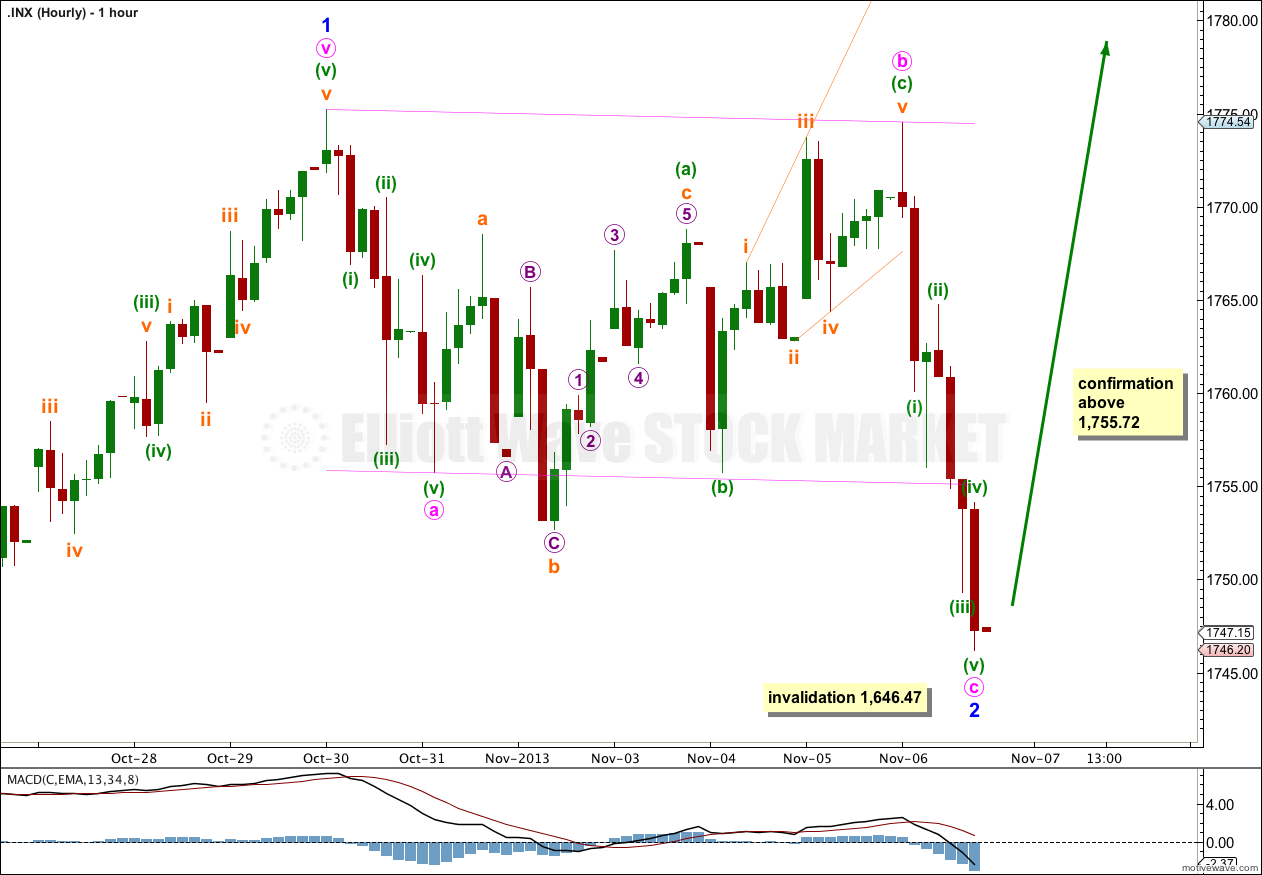
Downwards movement may have been the end, or almost the end, of minor wave 2. There is no Fibonacci ratio between minute waves a and c.
Ratios within minute wave c are: minuette wave (iii) is 0.97 points longer than equality with minuette wave (i), and minuette wave (v) has no Fibonacci ratio to minuette waves (i) or (iii).
Thursday began with a little more upwards movement. This can only have been an extension of the correction here labeled minute wave b. Minute wave b completed as a single regular flat correction; within it minuette wave (a) subdivides as a three, minuette wave (b) is a 99.7% correction of minuette wave (a), and minuette wave (c) has no Fibonacci ratio to minuette wave (a).
There is not enough upwards movement at the end of Thursday’s session to confirm that the fifth wave within minuette wave (v) will not continue to extend lower.
For this main hourly wave count I would have confidence in the target on the daily chart now with movement above 1,755.72. At that stage the alternate below would be invalidated.
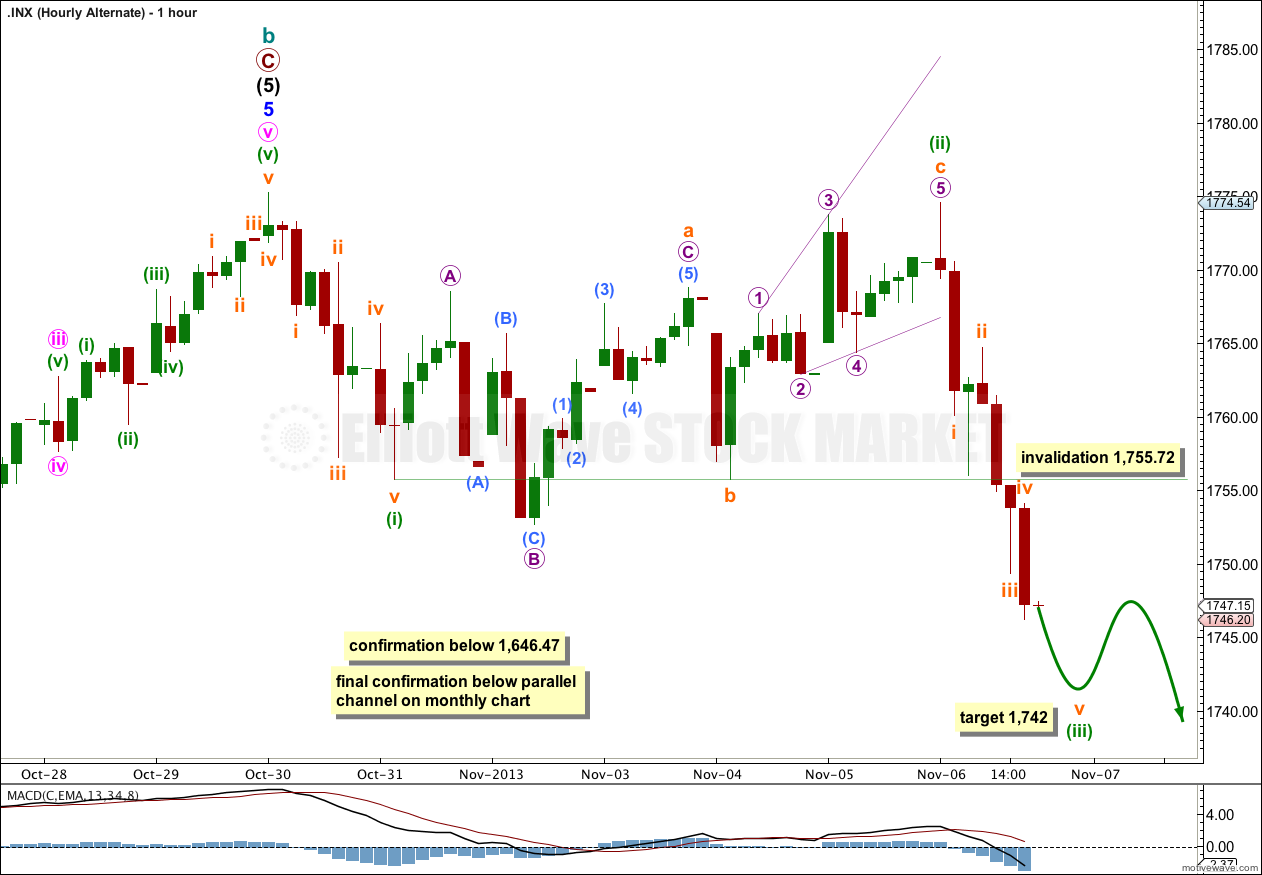
We should always assume that the trend remains the same until proven otherwise. The trend is your friend. At this stage we have absolutely no confirmation of a trend change at cycle degree.
This hourly wave count sees a huge trend change. The new downwards trend for cycle wave c should last from one to several years and should take price substantially below 666.79.
In looking for confirmation and confidence in this wave count I will look for the following (in order):
1. Movement below 1,646.47.
2. A clear breach of the black channel on the daily chart containing primary wave C.
3. A clear breach of the larger maroon channel on the monthly chart containing cycle wave b (this would provide enough confidence for me to discard the bullish alternate).
4. Final price confirmation with movement below 1,074.77.
At this stage this idea diverges from the first bullish hourly chart. A-B-C and 1-2-3 are the same, but after that an impulse downwards should have a fourth wave which may not move into first wave price territory. The bullish hourly chart now requires movement above 1,755.72 to confirm it, as at that stage this bearish hourly chart would be invalidated.
The target for minuette wave (iii) remains the same. At 1,742 it would reach 1.618 the length of minuette wave (i).
Alternate Bullish Wave Count.
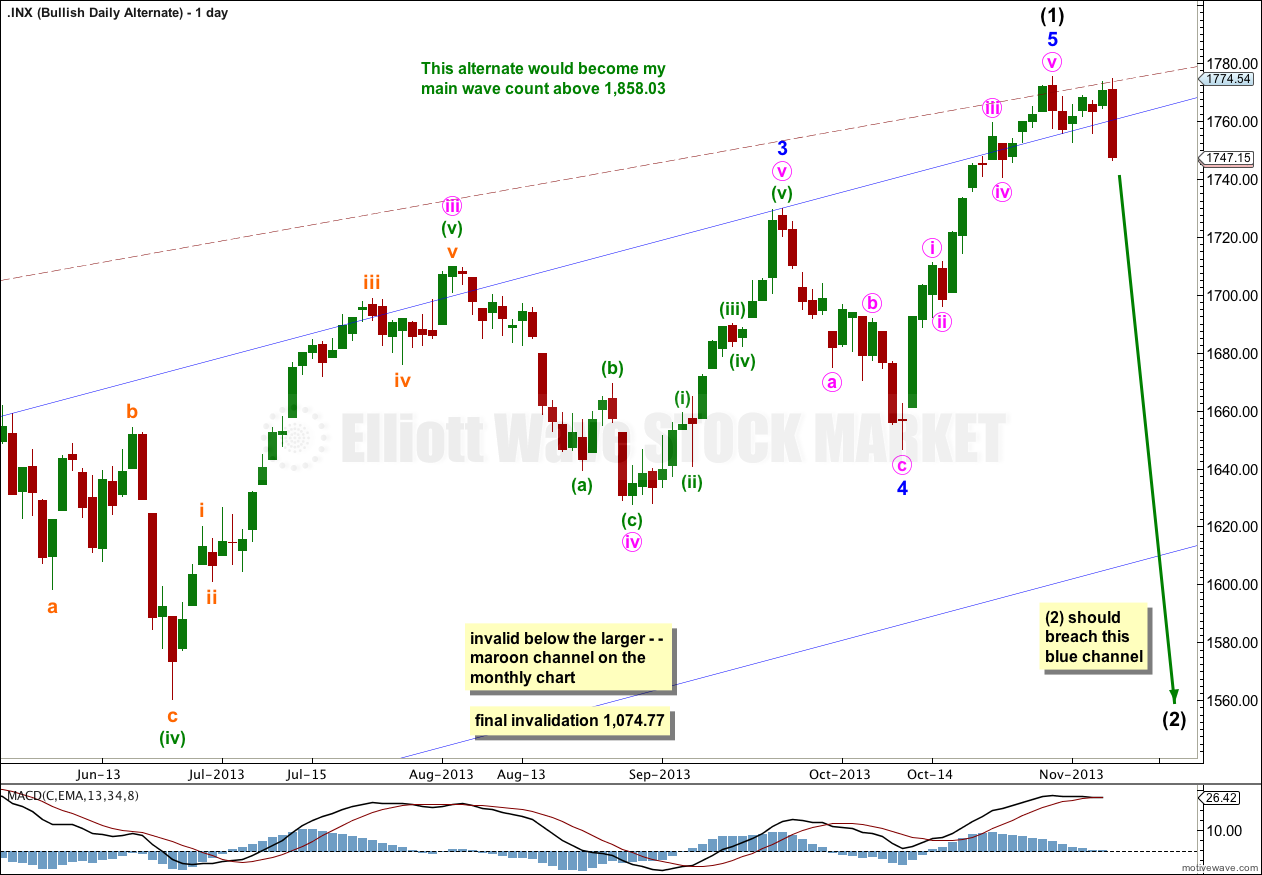
It is possible that we are and have been in a new bull market for a cycle degree fifth wave. Cycle waves should last from one to several years (as a rough guideline).
For this alternate downwards movement may have now begun for intermediate wave (2). This downwards movement must subdivide as a corrective structure, most likely a zigzag. Intermediate wave (2) should last weeks, so in the mid term this bullish alternate does not diverge with the second bearish hourly chart for the main wave count.
Intermediate wave (2) may not move beyond the start of intermediate wave (1). This wave count is invalidated with movement below 1,074.77.
If intermediate wave (2) breaches the parallel channel on the monthly chart then a lower degree second wave would breach an acceleration channel about a first wave one degree higher. This would give the wave count a strange look and reduce its probability significantly. At that stage I would probably discard it.
TEXTBOOK .. pre-crash bubble right on time … SPY 190 and into 200 http://www.zerohedge.com/news/2013-11-08/anatomy-pre-crash-bubble