
Yesterday’s analysis expected some upwards movement from the S&P 500 to begin the new week, to a short term target at 1,773. Price did move higher as expected, reaching up to 1,768.78, 4.22 points short of the short term target.
The wave count remains the same.
Click on the charts below to enlarge.
Main Wave Count.
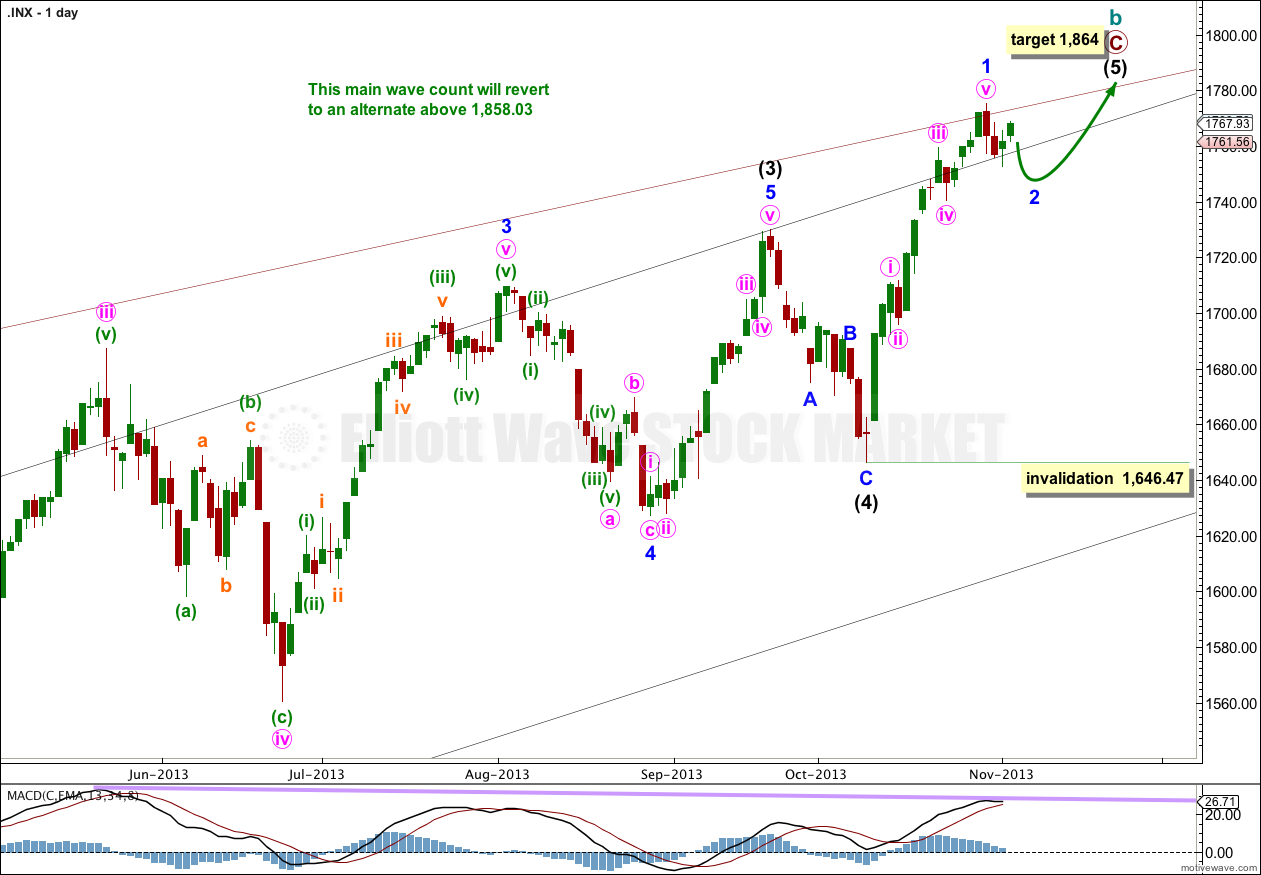
This wave count has a higher probability than the alternate. Upwards movement over the last 4 1/2 years subdivides best as a zigzag. Importantly, it does not show typical features of a third wave having just passed the strongest middle portion (which the alternate says must have recently happened). If something is “off” about the supposed recovery then it must be a B wave because there is plenty that is off in this scenario in terms of social mood.
Price may have found resistance along the upper edge of the big maroon channel from the monthly chart, if the upper trend line is pushed out to encompass all of primary wave A.
At 1,858.03 cycle wave b would reach 138% the length of cycle wave a. This wave count sees a super cycle expanded flat unfolding, and the maximum common length for a B wave within a flat is 138% the length of the A wave. Above this point this wave count would reduce in probability and it would be more likely that a longer term bull market is underway.
Intermediate wave (5) is either incomplete with just minor wave 1 within it completed (as per the first hourly chart below) or, if we move the degree of labeling within it up one degree, intermediate wave (5) and in turn cycle wave b may now be completed.
However, we should always assume the trend remains the same until proven otherwise. I now have four conditions to be satisfied in looking for a trend change. As each condition is satisfied my confidence in this trend change would increase.
At 1,864 intermediate wave (5) would reach equality in length with intermediate wave (1). This is the most common ratio between first and fifth waves so this target has a good probability.
Within intermediate wave (5) no second wave correction may move beyond the start of the first wave. This wave count is invalidated with movement below 1,646.47.
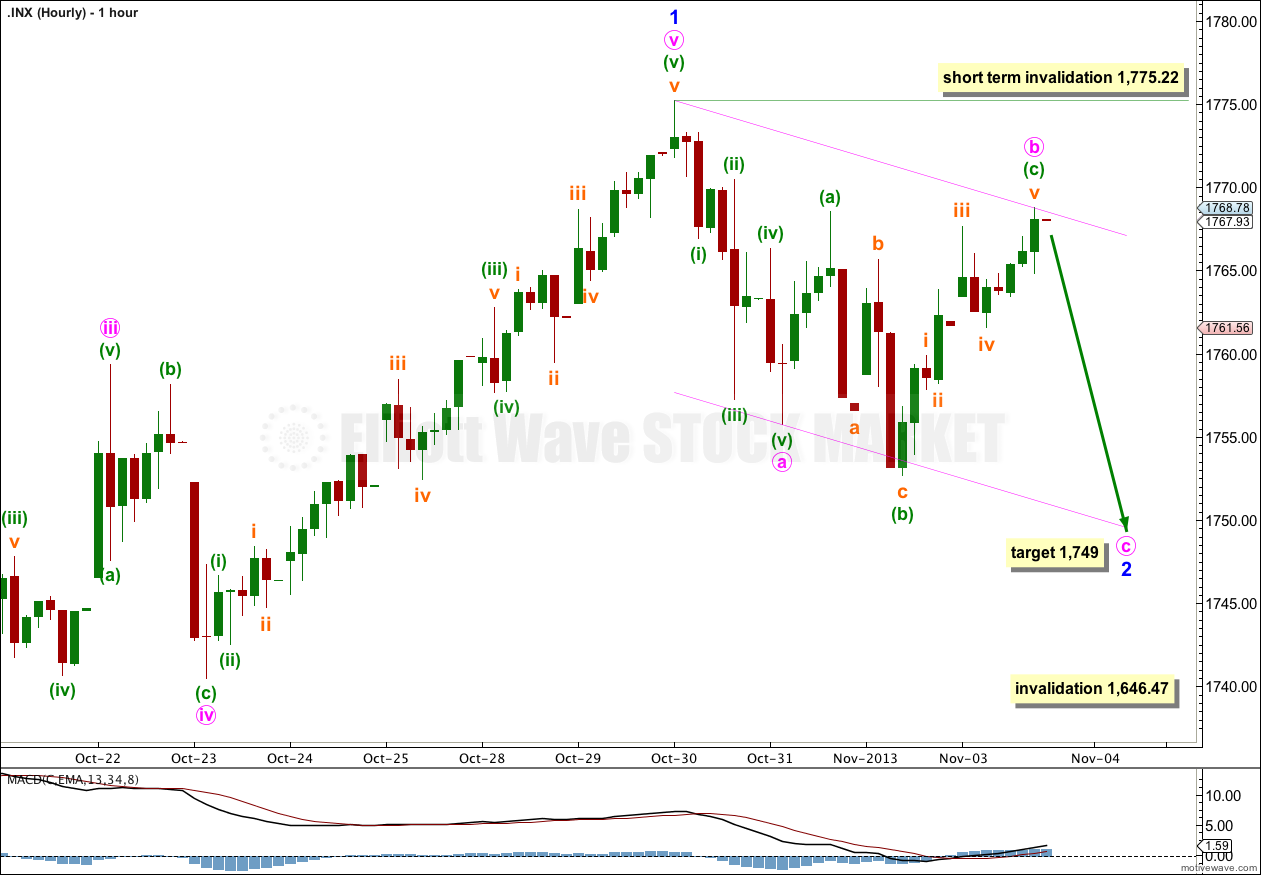
If intermediate wave (5) is incomplete then within it minor wave 1 only is complete, and minor wave 2 downwards is incomplete. Minor wave 2 may be unfolding as a zigzag.
Within the zigzag minute wave b is an expanded flat correction, and there is no Fibonacci ratio between minuette waves (a) and (c).
Ratios within minuette wave (c) are: subminuette wave iii has no Fibonacci ratio to subminuette wave i, and subminuette wave v is just 0.04 points longer than equality with subminuette wave i. It is likely that with this ratio minuette wave (c) is over here.
Tomorrow I would expect downwards movement. For this wave count at 1,749 minute wave c would reach equality in length with minute wave a. I would expect minute wave c to find support at the lower edge of the parallel channel containing minor wave 2.
Minor wave 2 may not move beyond the start of minor wave 1. This wave count is invalidated with movement below 1,646.47.
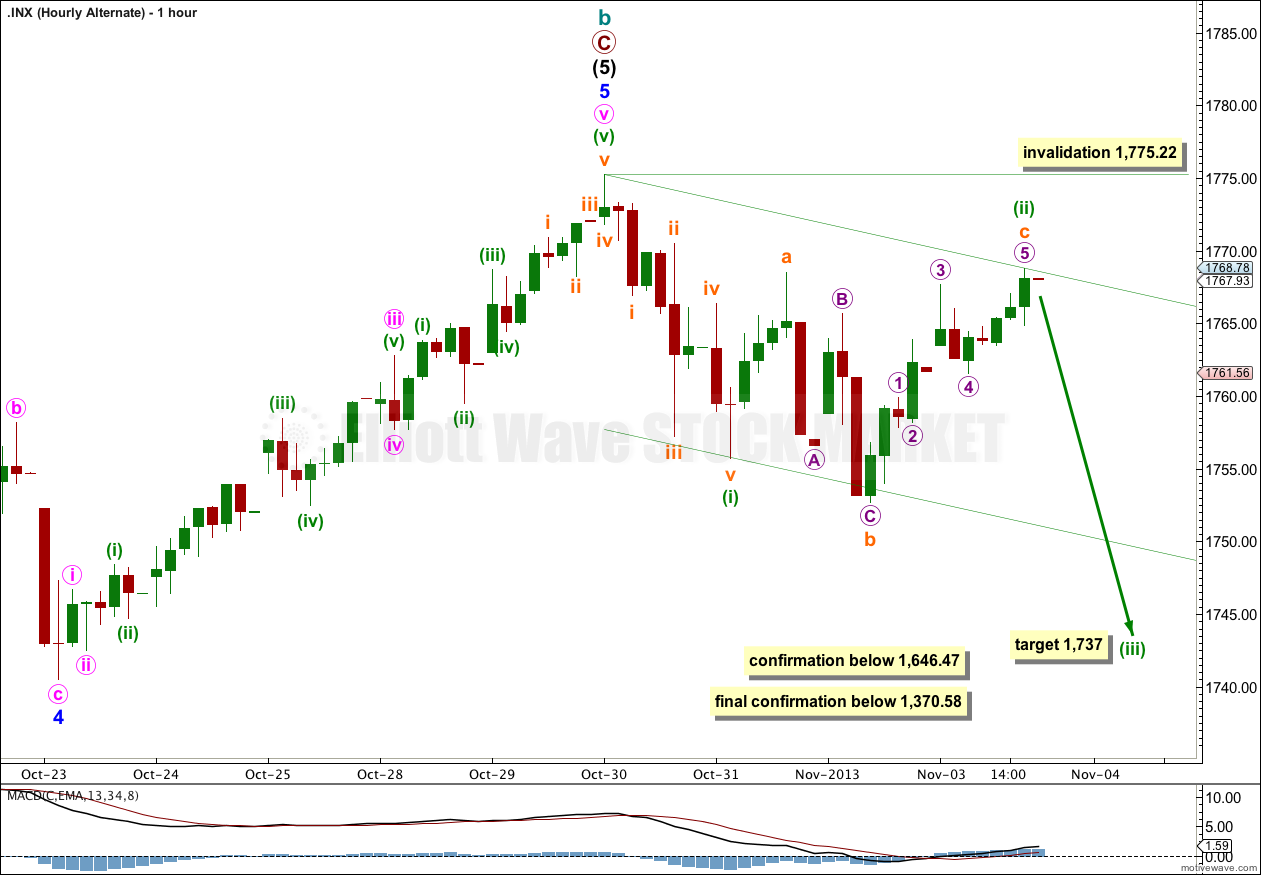
If we simply move the degree of labeling within intermediate wave (5) all up one degree it is possible that this entire wave of cycle wave b is completed. This is an enormous trend change. This wave count has an excellent fit, excellent Fibonacci ratios and a very good look overall. But at this early stage we do not have confirmation of a trend change of this magnitude. The next downwards trend for cycle wave c should last from one to several years and take price substantially below 666.79.
In looking for confirmation and confidence in this wave count I will look for the following (in order):
1. Movement below 1,646.47.
2. A clear breach of the black channel on the daily chart containing primary wave C.
3. A clear breach of the larger maroon channel on the monthly chart containing cycle wave b.
4. Final price confirmation with movement below 1,370.58.
As each condition is satisfied my confidence in this trend change would increase. Below 1,370.58 this would be my only wave count at cycle degree.
A-B-C and 1-2-3 have exactly the same subdivisions. If this next wave down is a third wave I would expect it to breach the acceleration channel drawn here, and to show an increase in downward momentum. At 1,737 minuette wave (iii) would reach 1.618 the length of minuette wave (i).
Alternate Wave Count.
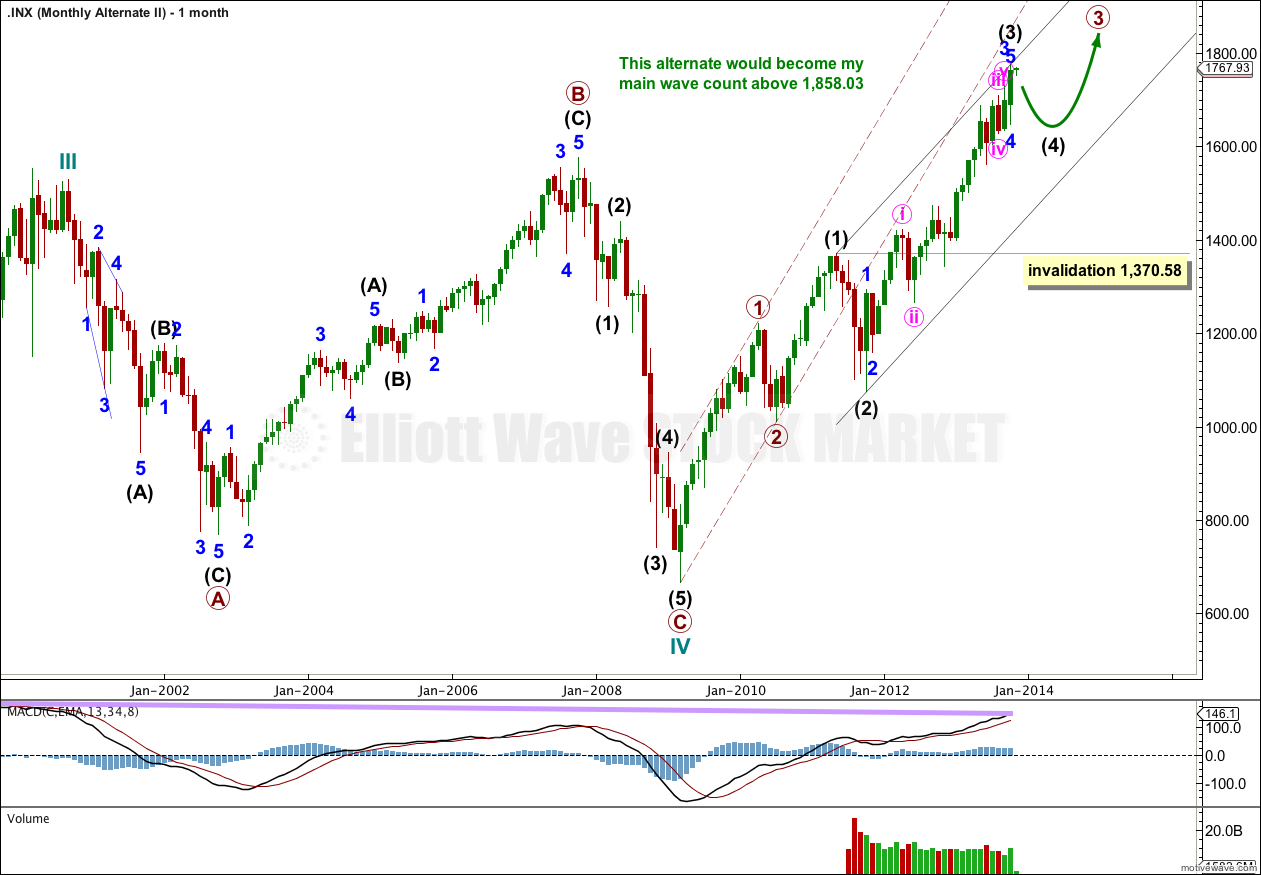
I am publishing the monthly chart for this alternate today with some new channels.
A big problem with this wave count is intermediate wave (2) within primary wave 3. It breaches the lower edge of the channel drawn from the start of primary wave 1 to the end of primary wave 2. A second wave of a lower degree should not breach that trend line.
The angle of slope for primary wave 3 is shallower than primary wave 1. Third waves are more commonly steeper (not always though).
Normally third waves breach the acceleration channel drawn about a first wave. This one does not.
These are further significant problems with this alternate wave count.
It is possible that we are and have been in a new bull market for a cycle degree fifth wave. Cycle waves should last from one to several years (as a rough guideline).
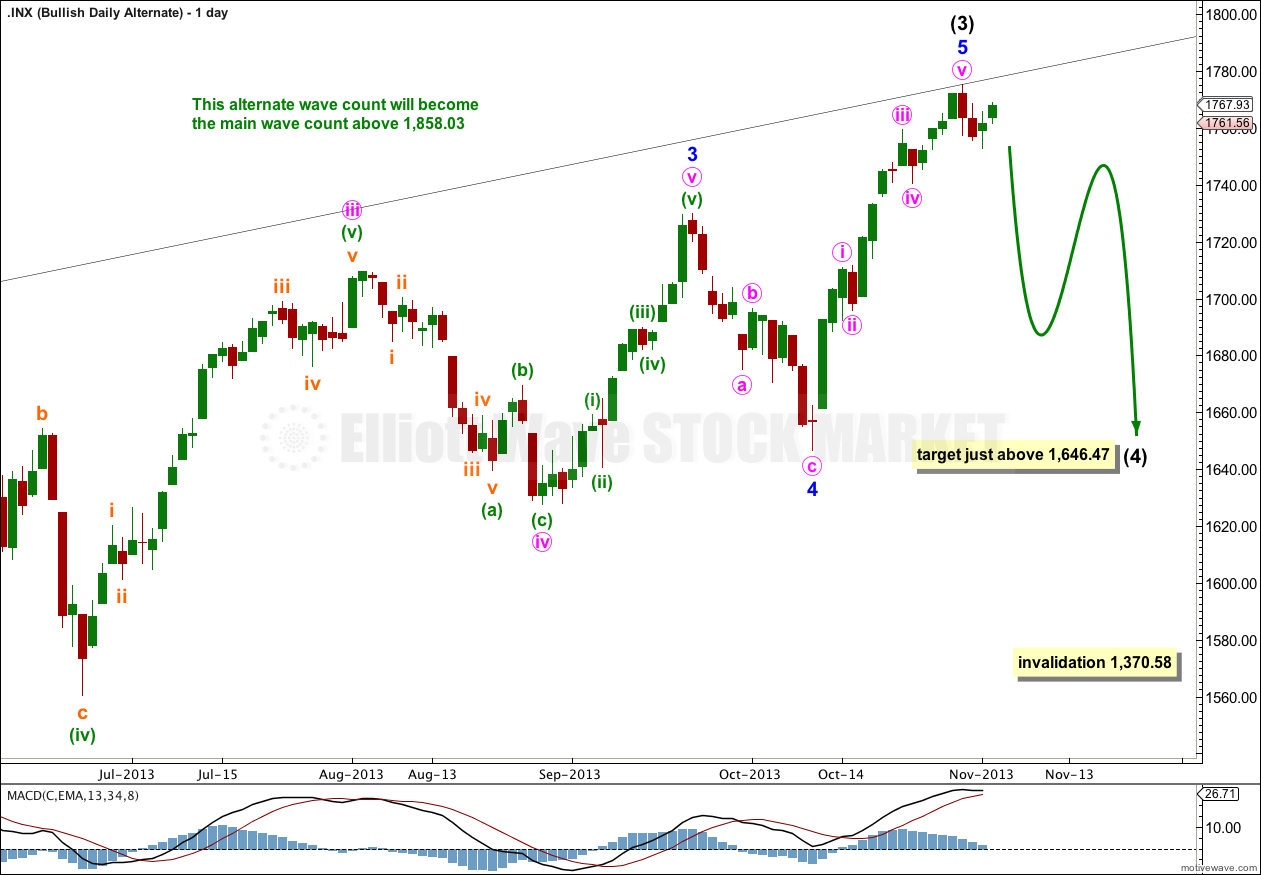
For this alternate downwards movement may have now begun for intermediate wave (4). This downwards movement must subdivide as a corrective structure, most likely a flat, combination or a triangle.
Intermediate wave (4) may not move into intermediate wave (1) price territory. This wave count would be invalidated with movement below 1,370.58
Lara,
If your main wave count is correct, do you feel that wave 1 blue may have been an extended wave. Otherwise, how can we end at less than the typical 138% ratio that you ahve discussed.
Thanks,
Peter
You’re right, it most likely would be an extended first wave.
It may have a third wave 0.618 it’s length, and a fifth wave shorter.
Especially if minor wave 2 is very shallow, I would expect a third wave not longer than the first.