
At this stage the wave counts diverge. Downwards movement fits both the main and alternate wave counts, but is not enough to provide any confidence in a trend change… yet.
Click on the charts below to enlarge.
This wave count has a higher probability than the alternate. Upwards movement over the last 4 1/2 years subdivides best as a zigzag. Importantly, it does not show typical features of a third wave having just passed the strongest middle portion (which the alternate says must have recently happened). If something is “off” about the supposed recovery then it must be a B wave because there is plenty that is off in this scenario in terms of social mood.
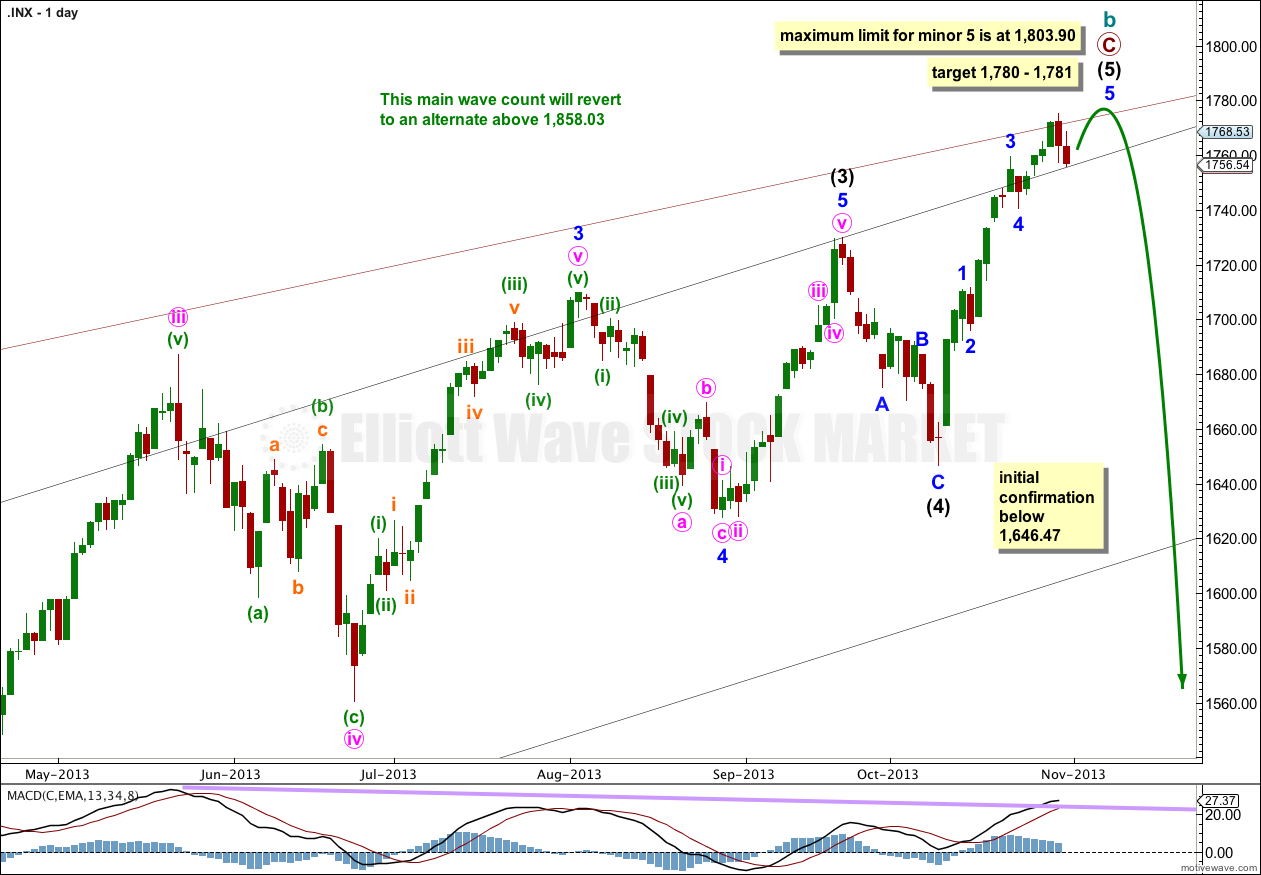
Price has again sat along the upper edge of the big maroon channel from the monthly chart, if the upper trend line is pushed out to encompass all of primary wave A. It may have found resistance in this area.
At 1,858.03 cycle wave b would reach 138% the length of cycle wave a. This wave count sees a super cycle expanded flat unfolding, and the maximum common length for a B wave within a flat is 138% the length of the A wave. Above this point this wave count would reduce in probability and it would be more likely that a longer term bull market is underway.
Intermediate wave (4) lasted 14 days, just one more than a Fibonacci 13.
The next Fibonacci duration for intermediate wave (5) to end would be in a total of 21 days on 7th November. Please note: this is a rough guideline only. Within this wave count there are few Fibonacci time relationships at primary or intermediate degree. Sometimes this happens, but not often enough to be reliable.
October is a common month for big trend changes with the S&P 500. It is also possible that intermediate wave (5) may end within the next two sessions.
At 1,781 intermediate wave (5) would reach 0.236 the length of intermediate wave (3). At 1,780 minor wave 5 within intermediate wave (5) would reach 0.618 the length of minor wave 3.
Within intermediate wave (5) no second wave correction may move beyond the start of the first wave. This wave count is invalidated with movement below 1,646.47.
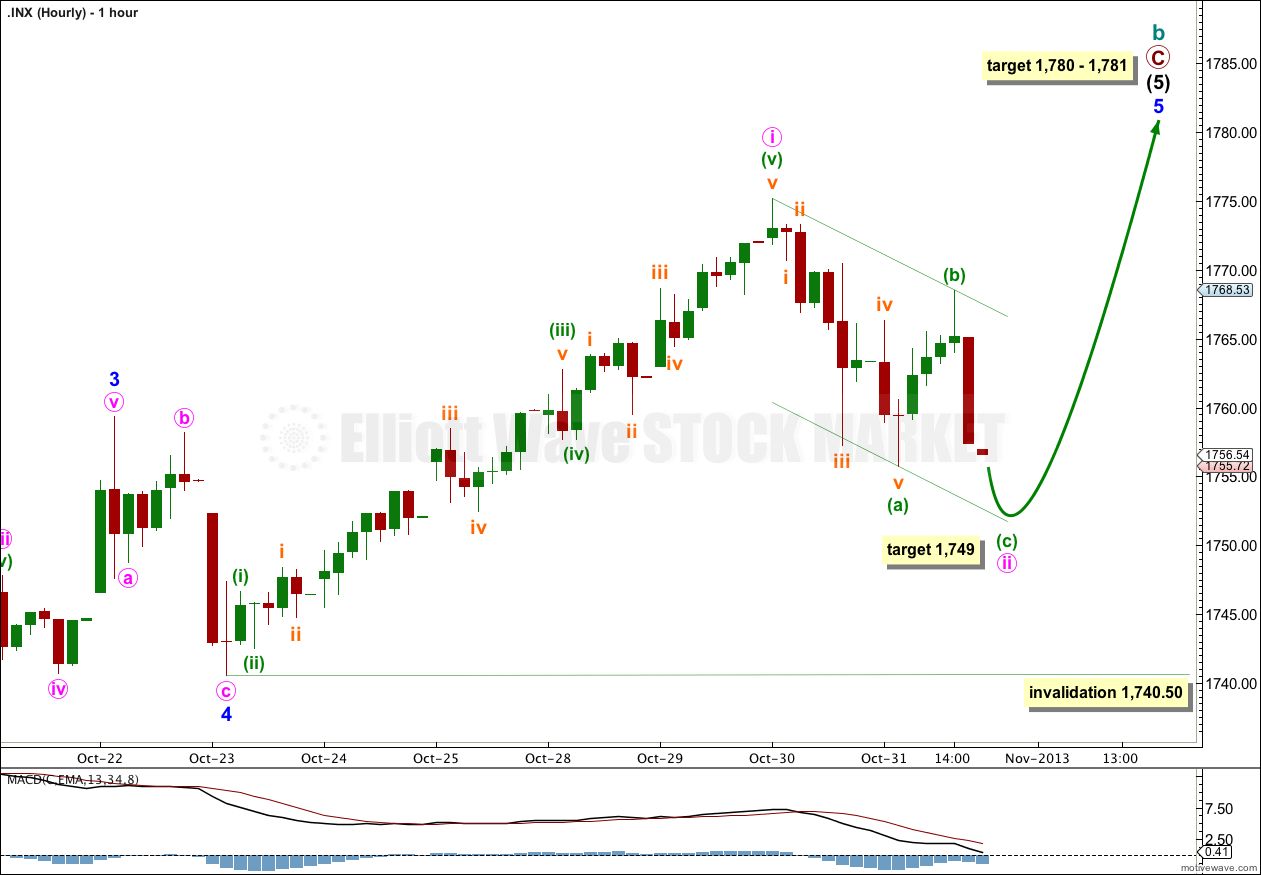
This is the first hourly wave count only because we should always assume that the trend remains the same, until proven otherwise. At this stage we do not have confirmation of a trend change and so I will assume the trend remains upwards.
At this stage downwards movement could be a second wave correction within minor wave 5. However, this wave count expects that minor wave 5 would therefore be extending. Because minor wave 3 is slightly shorter than minor wave 1 this idea does not have a good probability.
I have drawn a parallel channel about this possible zigzag of minute wave ii. If this downwards movement is a zigzag then I would expect minute wave c to end about the lower end of this channel.
Minor wave ii may not move beyond the start of minor wave i below 1,740.50. If price moves below this point then the only hourly wave count for this main daily wave count would be the chart below.
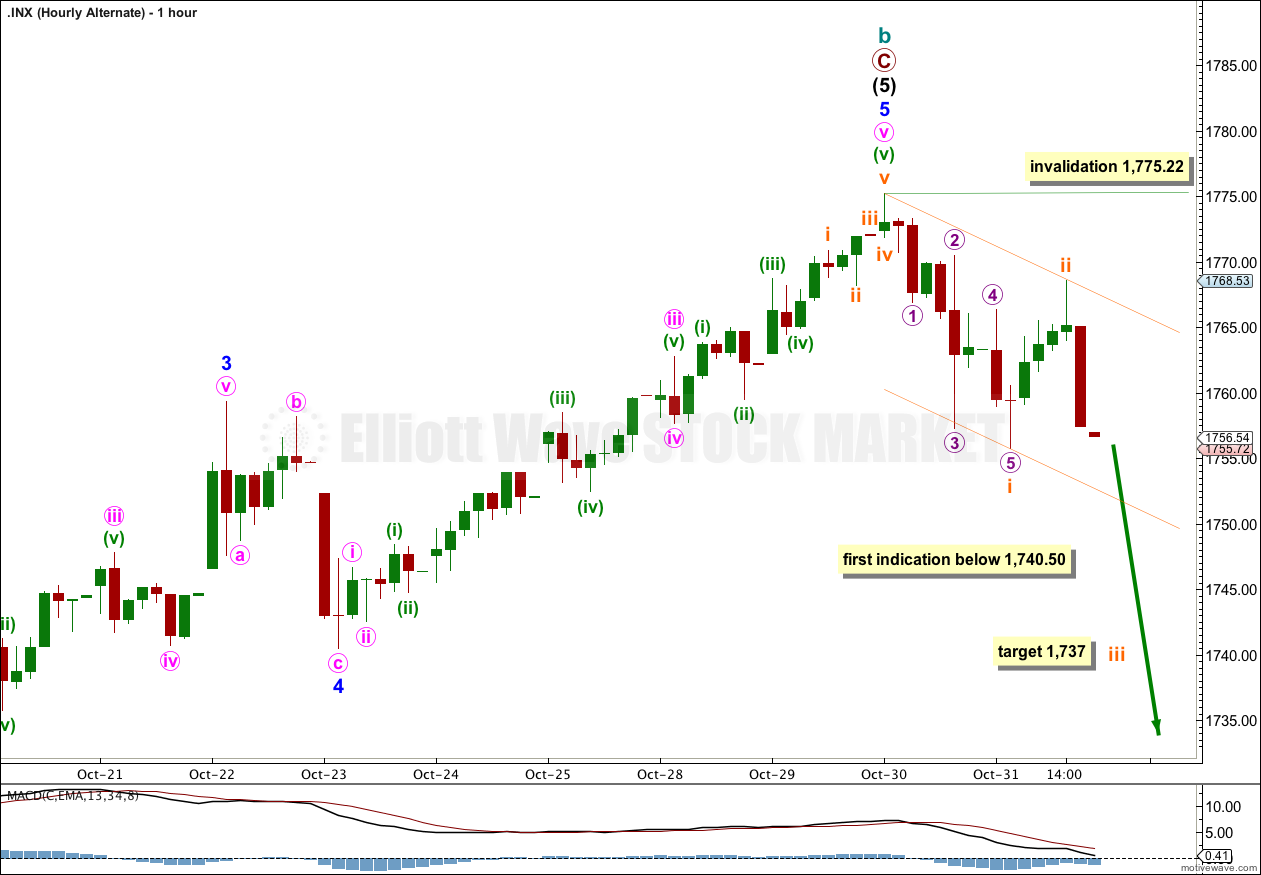
This wave count has a very good look and fit. But A-B-C and 1-2-3 subdivide exactly the same way. Not until we have a clear five down and movement below 1,740.50 would I have any confidence in this wave count.
At 1,737 subminuette wave iii would reach 1.618 the length of subminuette wave ii.
The channel drawn here is the same as on the first hourly chart. In this instance it is an acceleration channel. If this current downwards wave is a third wave I would expect it to breach the lower edge of this channel.
In looking for confirmation and confidence in this wave count I will look for the following (in order):
1. Movement below 1,740.50.
2. Movement below 1,646.47.
3. A clear breach of the black channel on the daily chart containing primary wave C.
4. A clear breach of the larger maroon channel on the monthly chart containing cycle wave b.
5. Final price confirmation with movement below 1,370.58.
As each condition is satisfied my confidence in a trend change would increase. When all conditions are satisfied I would have confidence in downwards targets and this would be my only wave count.
At this stage if subminuette wave ii continues higher it may not move beyond the start of subminuette wave i above 1,775.22.
Alternate Bullish Wave Count.
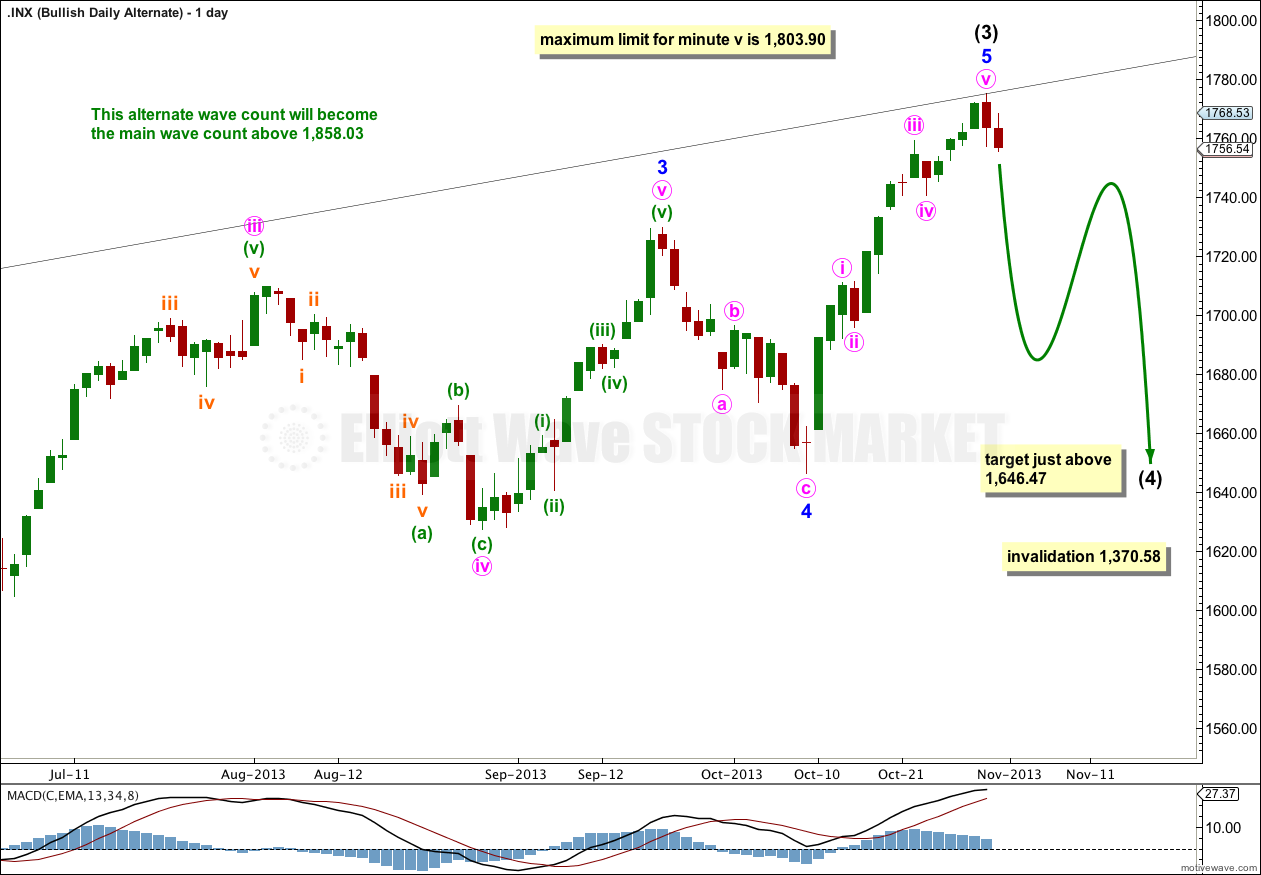
It is possible that we are and have been in a new bull market for a cycle degree fifth wave. Cycle waves should last from one to several years (as a rough guideline).
For this alternate downwards movement may have now begun for intermediate wave (4). This downwards movement must subdivide as a corrective structure, most likely a flat, combination or a triangle.
Intermediate wave (4) may not move into intermediate wave (1) price territory. This wave count would be invalidated with movement below 1,370.58.
Lara,
Any possibility that the recent top was only the end of blue 1 of black (5) rather than black (5) in its entirety?
Thanks,
Peter
That is exactly how I’m going to be labeling it from this point onwards. This recent downwards movement is too large in size and duration for a second wave correction within minor wave 5.