
Last analysis main wave count expected upwards movement as most likely, and the alternate count expected downwards movement. Price has moved lower to complete an impulse and turned up slightly at the end of the session.
I am swapping over the main and alternate wave counts today. I will explain my reasoning with weekly charts.
Click on the charts below to enlarge.
Main Wave Count.
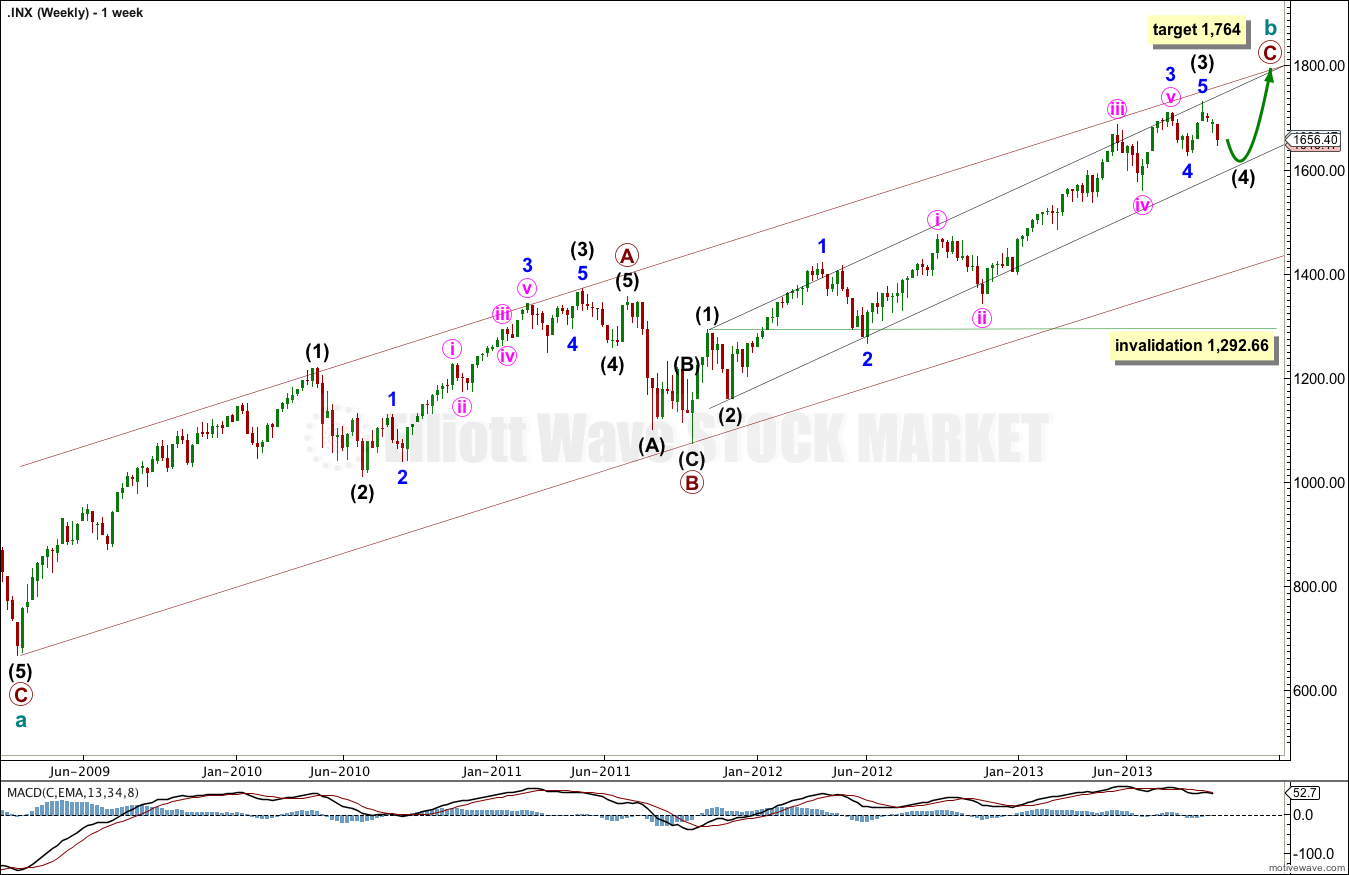
Recent movement on the S&P for the last few weeks looks like a series of fourth and fifth waves, not first and second waves. If I were to label this long movement for primary wave C without having seen it before, this is how I would label it.
This main wave count has the main difference from the alternate wave count in the first wave up from the low at 666.79. This wave count must see this upwards wave as a five wave impulse. This is possible, but overall does not have as good a look as seeing it as a three.
If the first wave up labeled primary wave A is a five wave impulse, then cycle wave b is a single zigzag, and now the recent movement fits very nicely as a series of fourth wave corrections.
At 1,764 primary wave C would reach equality with primary wave A.
Intermediate wave (4) may not move into intermediate wave (1) price territory. This wave count is invalidated with movement below 1,292.66.
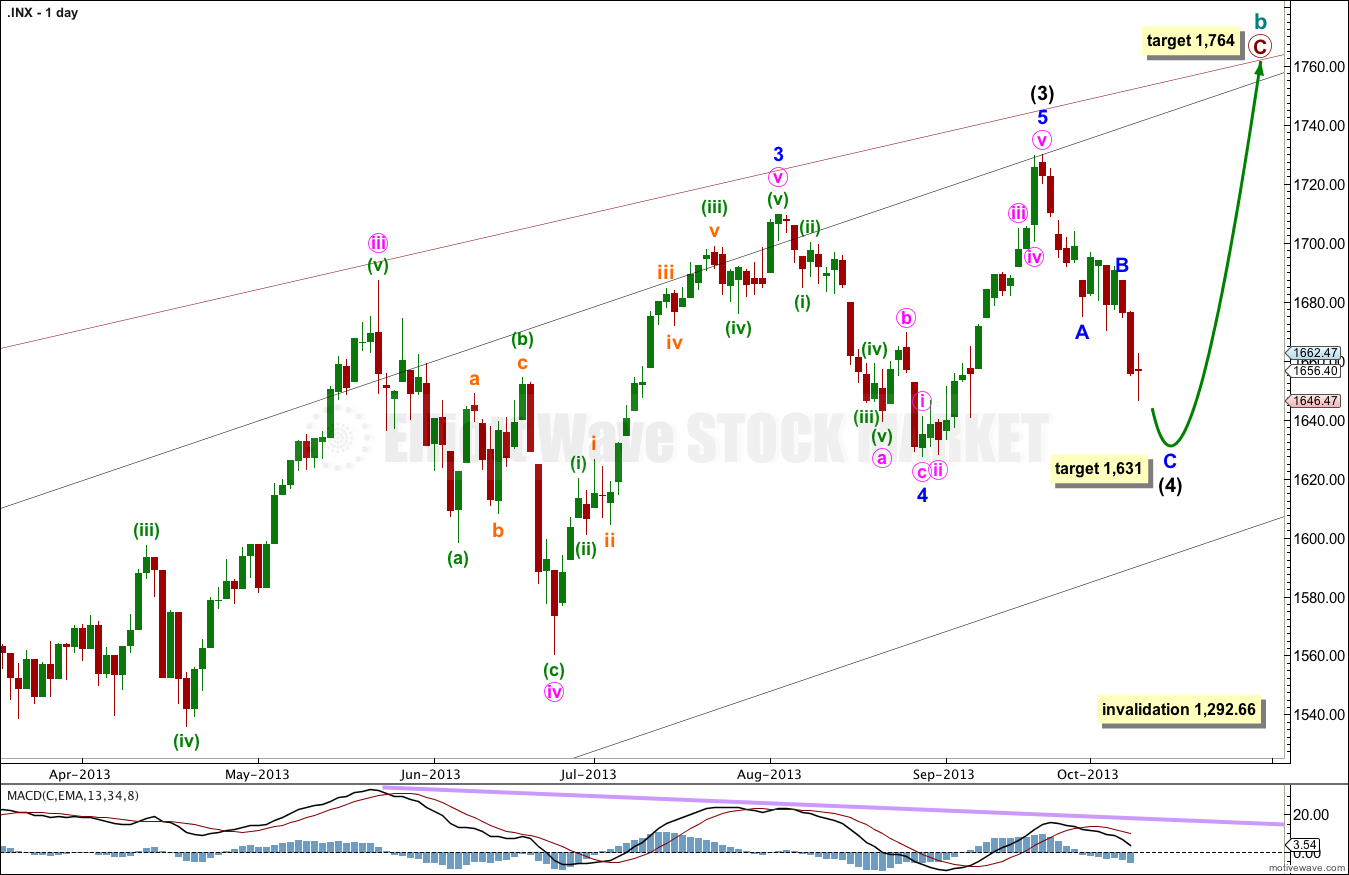
If this current downwards movement is an intermediate degree fourth wave then I would expect it to most likely last longer. At 1,631 minor wave C would reach equality in length with minor wave A, and intermediate wave (4) would end just a little above the end of minor wave 4 giving this wave count a typical look.
If price moved lower I would expect strong support at the lower edge of the black channel copied over here from the weekly chart.
Intermediate wave (4) may not move into intermediate wave (1) price territory. This wave count is invalidated with movement below 1,292.66.

Within minor wave C it is either over now, or only minute wave i within it is complete. An invalidation of this wave count at the hourly chart level would indicate that intermediate wave (4) is completed.
What is most likely is that intermediate wave (4) would continue further. Minute wave ii is probably incomplete, and should move a little higher to start tomorrow’s session. At 1,674 minuette wave (c) would reach equality in length with minuette wave (a).
When minute wave ii is complete I would expect an increase in downwards momentum as a third wave begins.
Alternate Wave Count.
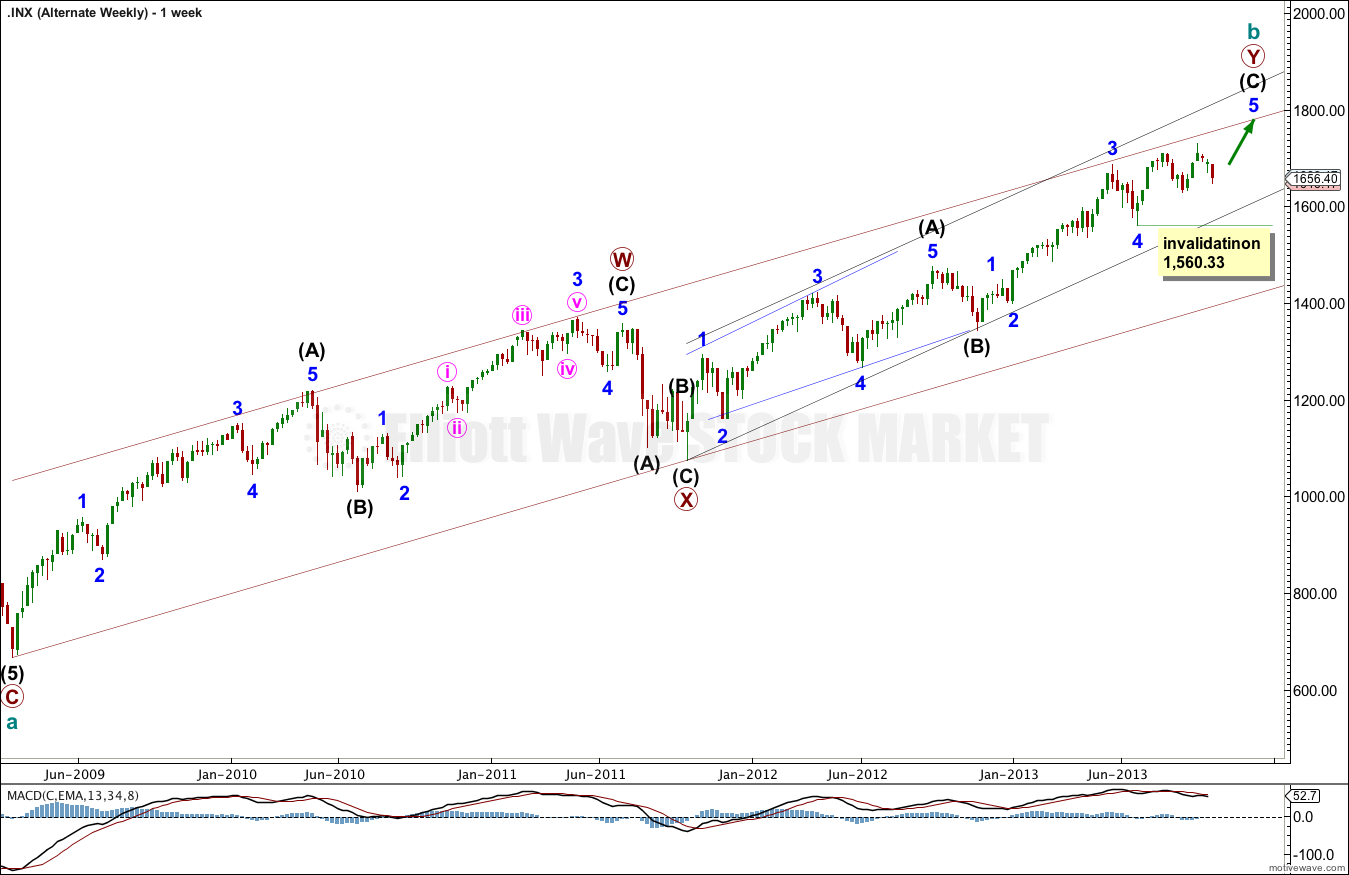
Because the first wave upwards from the low at 666.79 looks strongly like a three wave structure, this wave count sees cycle wave b as a double zigzag.
Within the second zigzag of primary wave Y intermediate wave (C) is incomplete, and minor wave 5 is incomplete.
Within minor wave 5 no second wave correction may move beyond the start of the first wave. This wave count is invalidated with movement below 1,560.33.
At 1,740 intermediate wave (C) would reach equality with intermediate wave (A). At 1,739 minor wave 5 would reach 0.618 the length of minor wave 3.
If price rises through this first target the next target will be used. At 1,849 minor wave 5 would reach equality with minor wave 3.
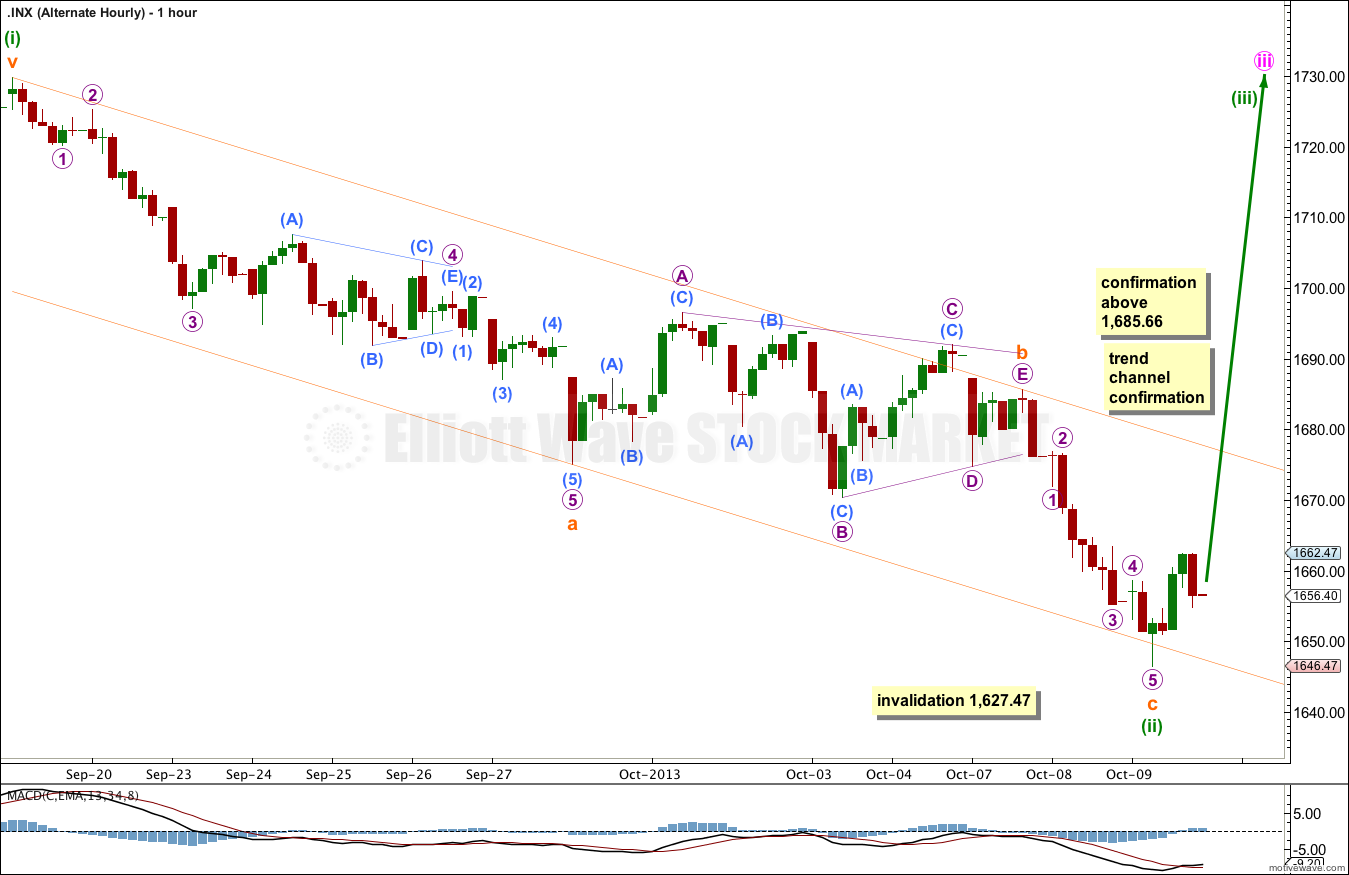
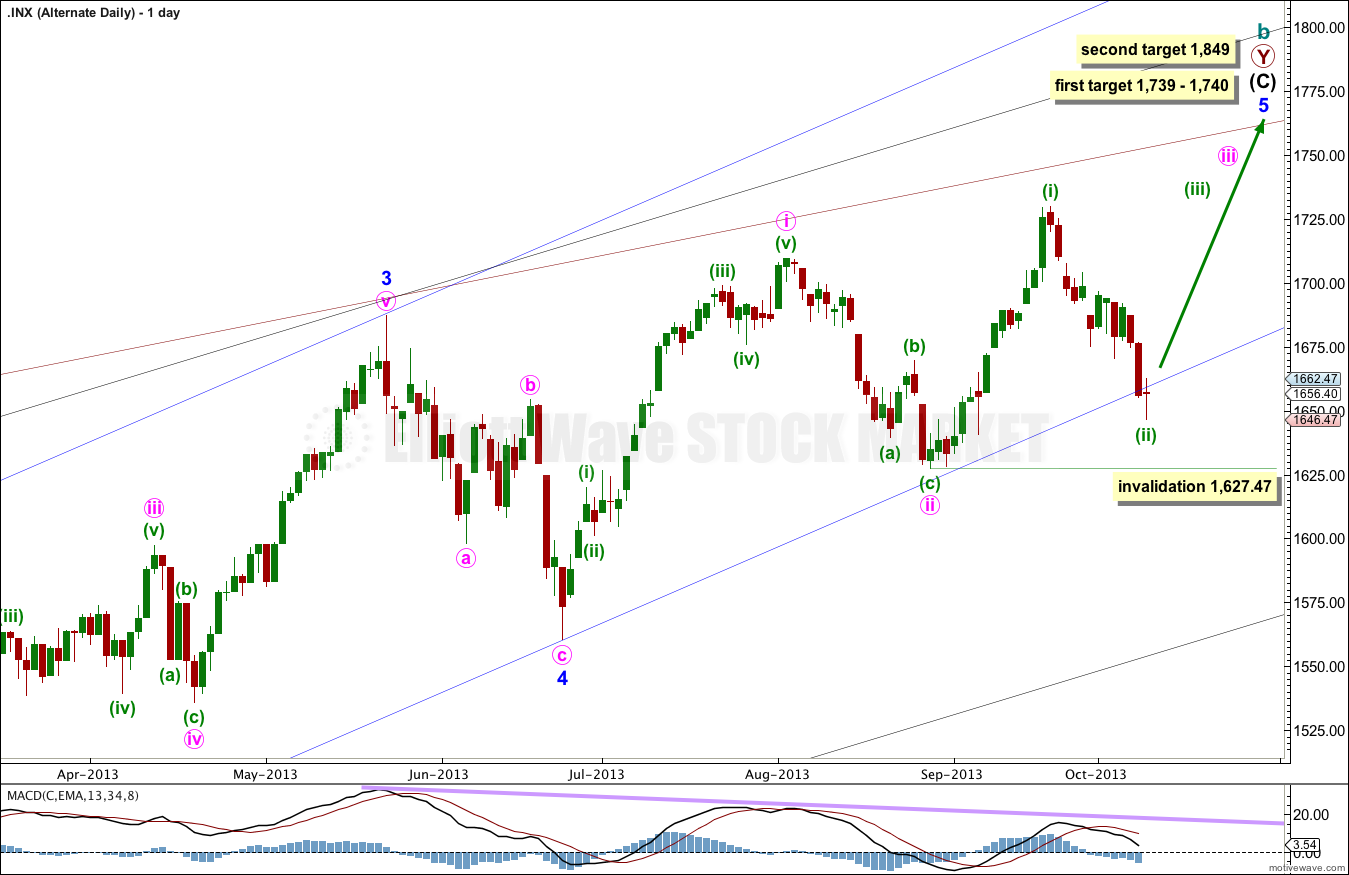
If downwards movement is a minuette degree second wave then I would expect it to be over already. There is no Fibonacci ratio between subminuette waves a and c.
When price eventually moves above 1,685.66, and above the parallel channel drawn here, then I will have confidence that downwards movement is over and the next wave up has begun. While price remains within the channel and below 1,685.66 the invalidation point must remain at the start of minuette wave (i).
Minuette wave (ii) may not move beyond the start of minuette wave (i). This wave count is invalidated with movement below 1,627.47.
Alternate Monthly Wave Count.
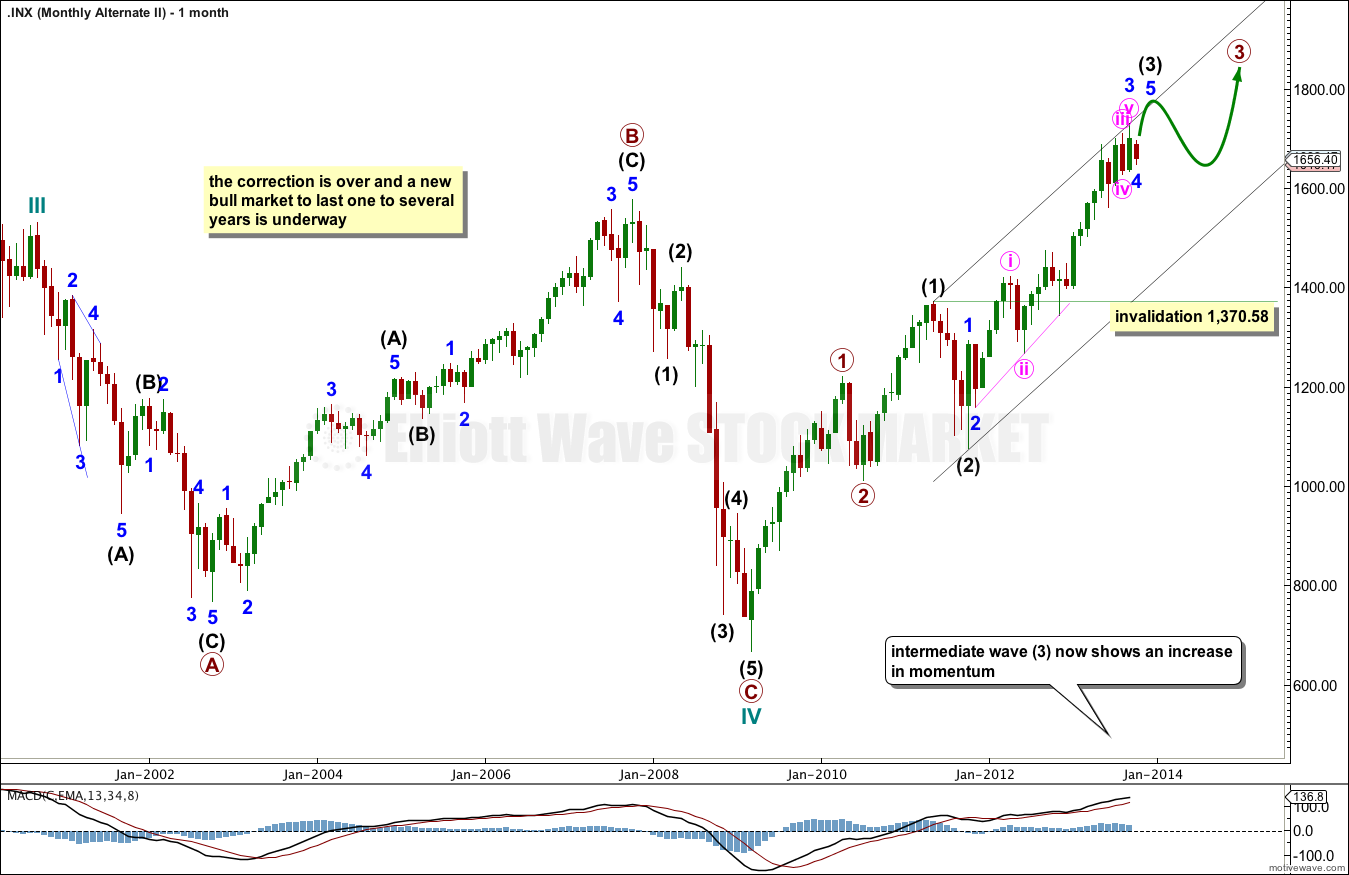
To ensure this analysis looks at all current wave counts, this is the long held alternate monthly wave count.
At this stage there is some upwards increase in momentum which fits for this bullish alternate.
It is possible that the S&P 500 is in a bull market which began in March, 2009. This cycle wave V should last between one to several years. It has passed the middle, and intermediate wave (3) is almost complete.
Intermediate wave (4) may not move into intermediate wave (1) price territory. This wave count is invalidated with movement below 1,370.58.
Eventually if price invalidated this alternate wave count then the main wave count would be confirmed at cycle degree, and I would then have confidence that price should move to new lows below 666.79.
Lara,
Have you looked at the Dow, as well. It seems that your main wave count here is also a better fit for the Dow. In fact, I think your alternate here has already been invalidated on the Dow with the recent downwards movement. Is that correct?
Thanks,
Peter