
Yesterday’s analysis expected upwards movement which is not what happened. Price made a new low then moved sideways.
The wave count on the hourly chart is adjusted.
Click on the charts below to enlarge.
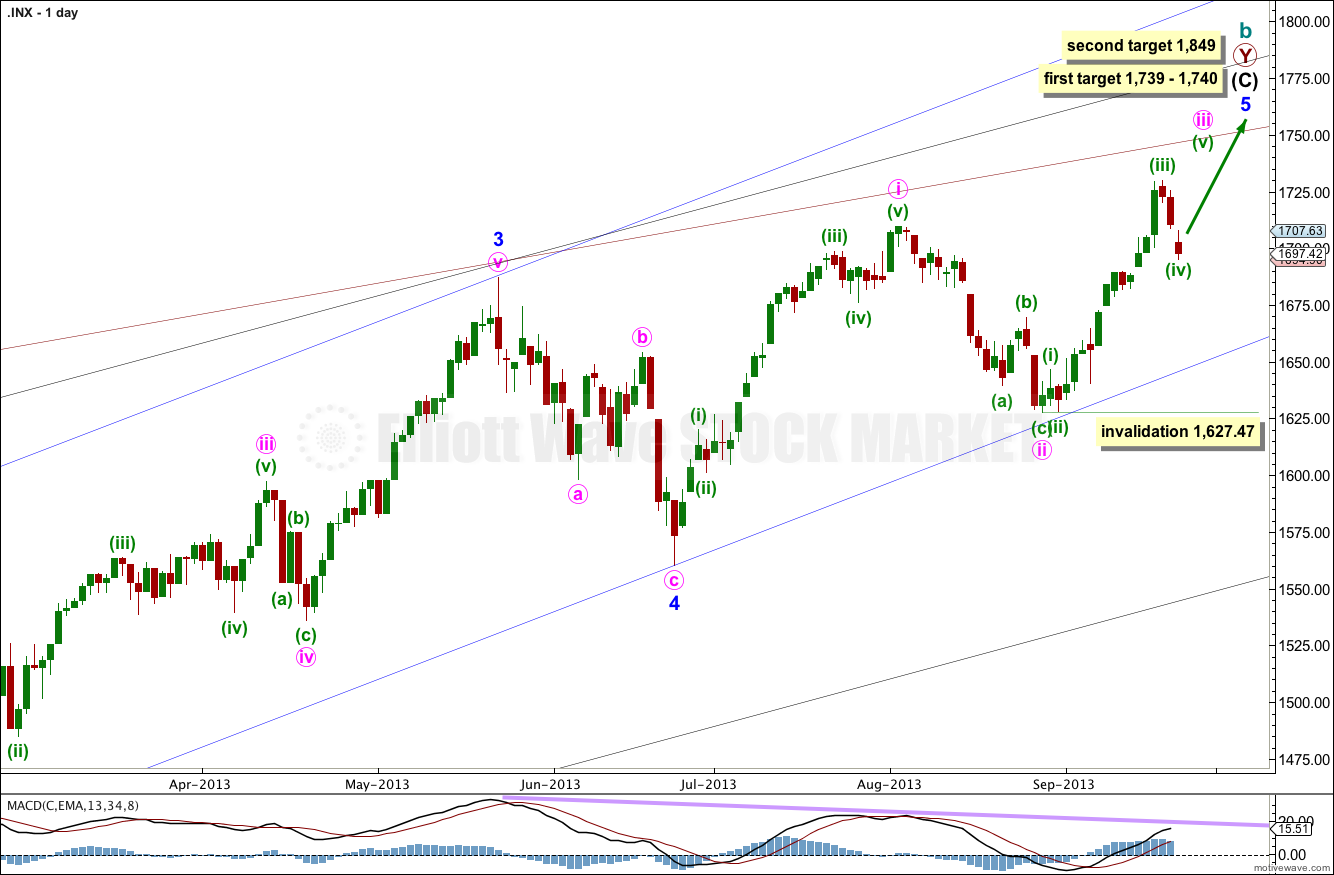
At 1,740 intermediate wave (C) would reach equality with intermediate wave (A). At 1,739 minor wave 5 would reach 0.618 the length of minor wave 3.
If price rises through this first target the next target will be used. At 1,849 minor wave 5 would reach equality with minor wave 3.
When minute waves iii and iv within minor wave 5 are complete I will add to the target calculation at minute wave degree, so at that stage it may change.
Minor wave 1 lasted a Fibonacci 21 days, minor wave 2 lasted a Fibonacci 8 days, minor wave 3 has no Fibonacci duration at 98 days, and minor wave 4 lasted 22 days, just one day longer than a Fibonacci 21.
Minor wave 5 may not exhibit a Fibonacci time relationship. The next possibility may be the 29th of October (give or take two days either side of this date) where minor wave 5 would have lasted a Fibonacci 89 days. This is a date to look out for, but cannot be relied upon because Fibonacci time relationships do not occur often enough to be reliable.
Keep drawing the wider parallel channels from the monthly chart and copy them over to the daily chart.
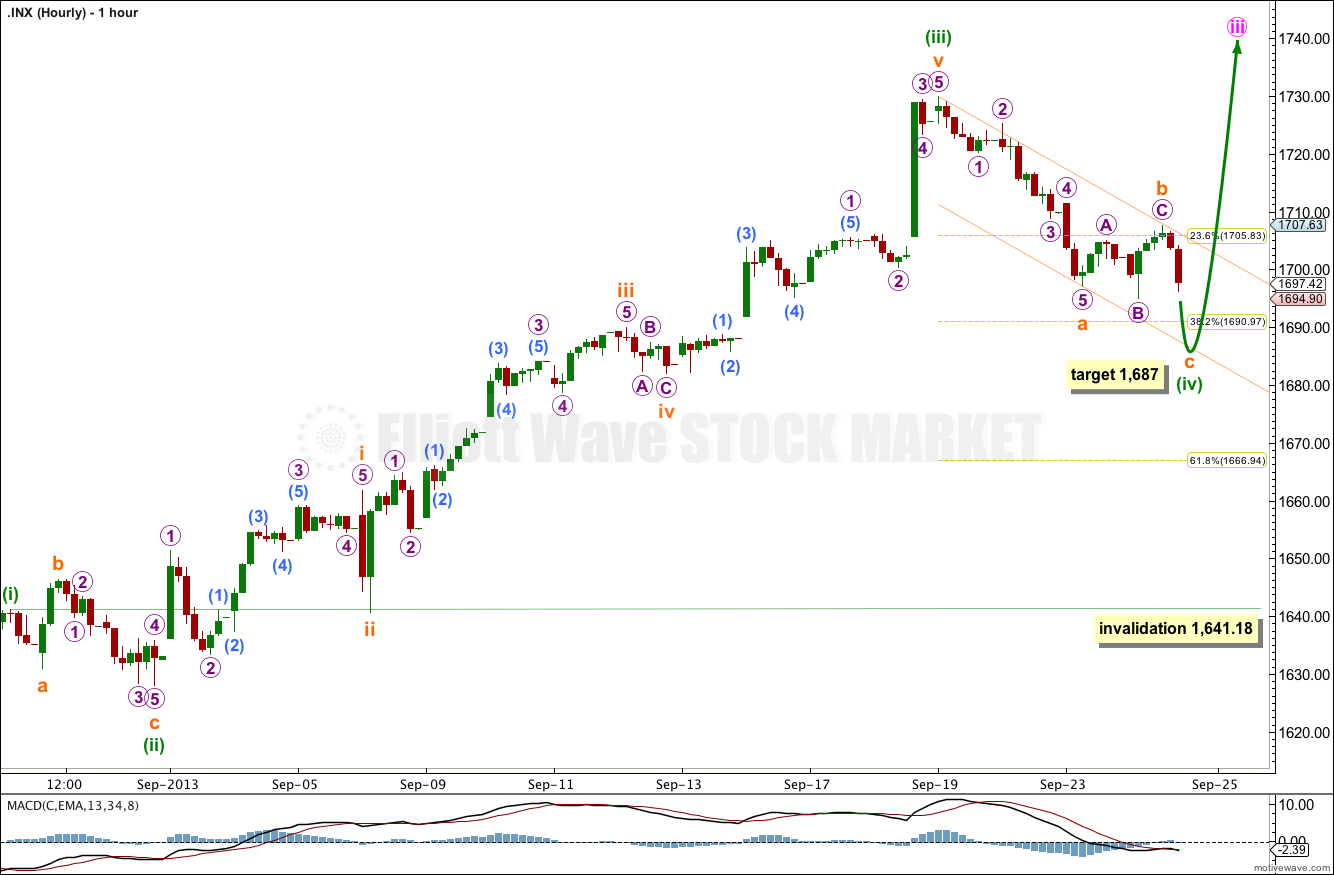
Sideways movement including the new low looks very much like a B wave correction. Minuette wave (iv) is unlikely to be completed. At 1,687 subminuette wave c would reach 0.618 the length of subminuette wave a.
Redraw the parallel channel about minuette wave (iv). Draw the first trend line from the start of subminuette wave a to the end of subminuette wave b, then place a parallel copy upon the end of subminuette wave a. Subminuette wave c may end mid way within the channel, or should find support at the lower edge. When this channel is clearly breached by subsequent upwards movement then minuette wave (v) should be underway.
Minuette wave (iv) may not move into minuette wave (i) price territory. This wave count is invalidated with movement below 1,641.18.
Alternate Daily Wave Count.
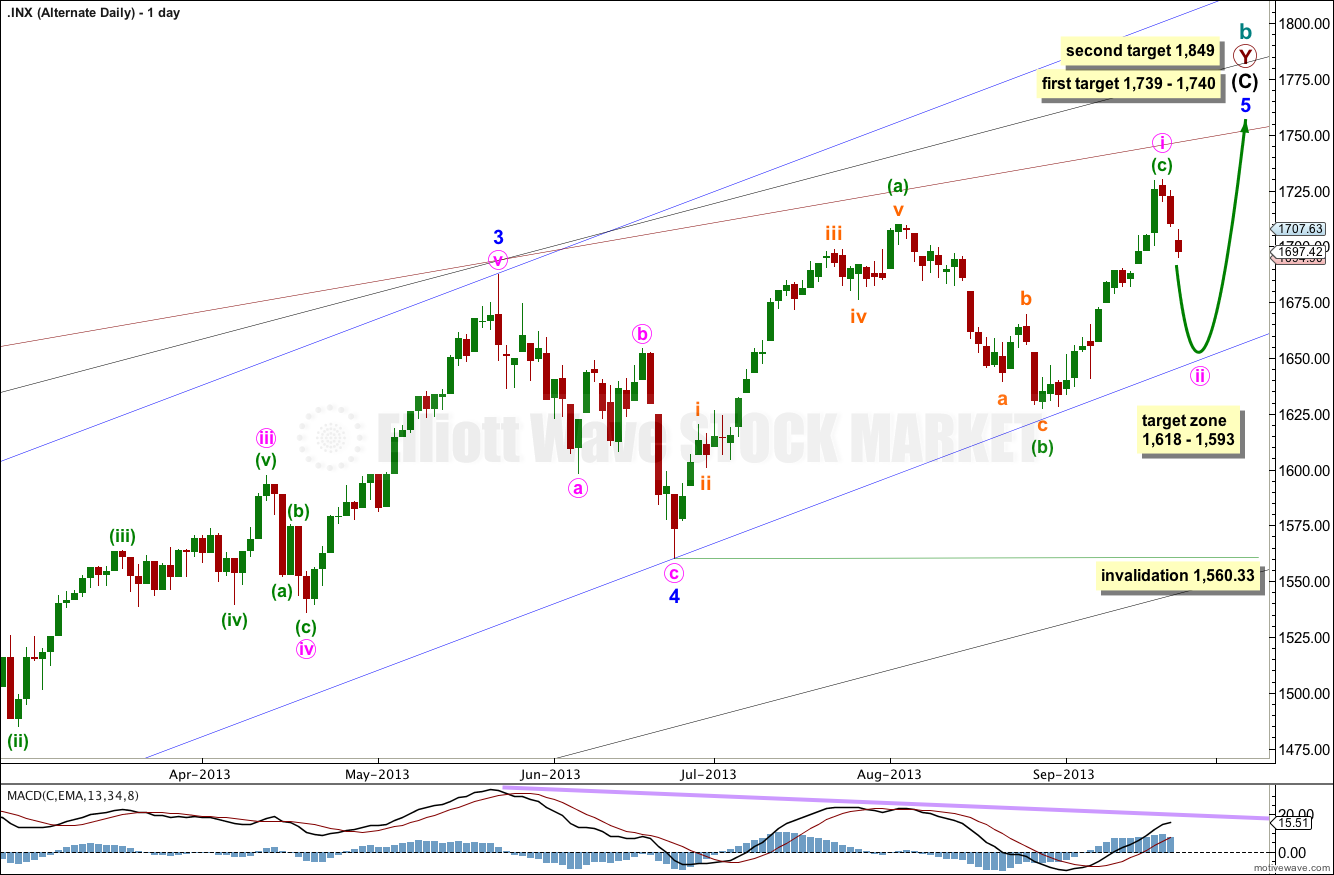
There are two structural possibilities for minor wave 5. The main wave count looks at the most likely structure of an impulse. This alternate will consider the less likely possibility of an ending diagonal.
The ending diagonal may be contracting. All the subwaves must subdivide into zigzags, and the fourth wave must overlap back into first wave price territory.
Minute wave i may be recently completed. Downwards movement may be the start of minute wave ii.
Second waves within diagonals are commonly between 0.66 to 0.81 the length of the first wave. This gives us a target zone between 1,618 and 1,593. I would expect downwards movement to find support at the lower edge of the blue parallel channel (or slightly above this line).
Minute wave ii may not move beyond the start of minute wave i. This wave count is invalidated with movement below 1,560.33.
Very good, Karen!
ESZ3 NEW LOWS 1687.25 holding LONG // will add if we go down a bit more
Lara, thank you!!
Your welcome! Stoked it’s working for you.
Still… I’ve taken a look at what happened while I slept and I’m not convinced we’ve turned yet. Maybe a little lower first.
and as an aside, that candlestick for 23rd is still AWOL. very strange.
We might not fill the gap this week .. NYMO closed in the green http://scharts.co/1fjx2VX with SPX in the RED 1697.42 // which would mean Wave 4 ended today with the higher low.
which would see a truncated C wave…
entirely possible
Just curious…
Yes, I’m using NY session data only.
The size of minute wave i for the alternate is my biggest reason for judging the alternate to have a low probability… it looks huge, it looks out of proportion and this would give the wave count an odd look. It would also either have a shallow second wave (unusual for diagonals) or the second wave would breach the blue channel.
And finally, ending diagonals are less likely than impulses for fifth waves. Not by a huge amount, but they have a lower probability.
Hi Lara,
What makes the ending diagonal less likely than your primary count?
Also I notice the charts have a lot of gaps on them are you charting using only the regular session data?
The CME ES globex contract doesn’t seem to have as many gaps..?