
Last analysis expected again more upwards movement to begin the new trading week, which is what happened. The short term target has not yet been reached, but may be tomorrow. The short term structure is incomplete.
The wave counts remain the same.
Click on the charts below to enlarge.
Main Wave Count.
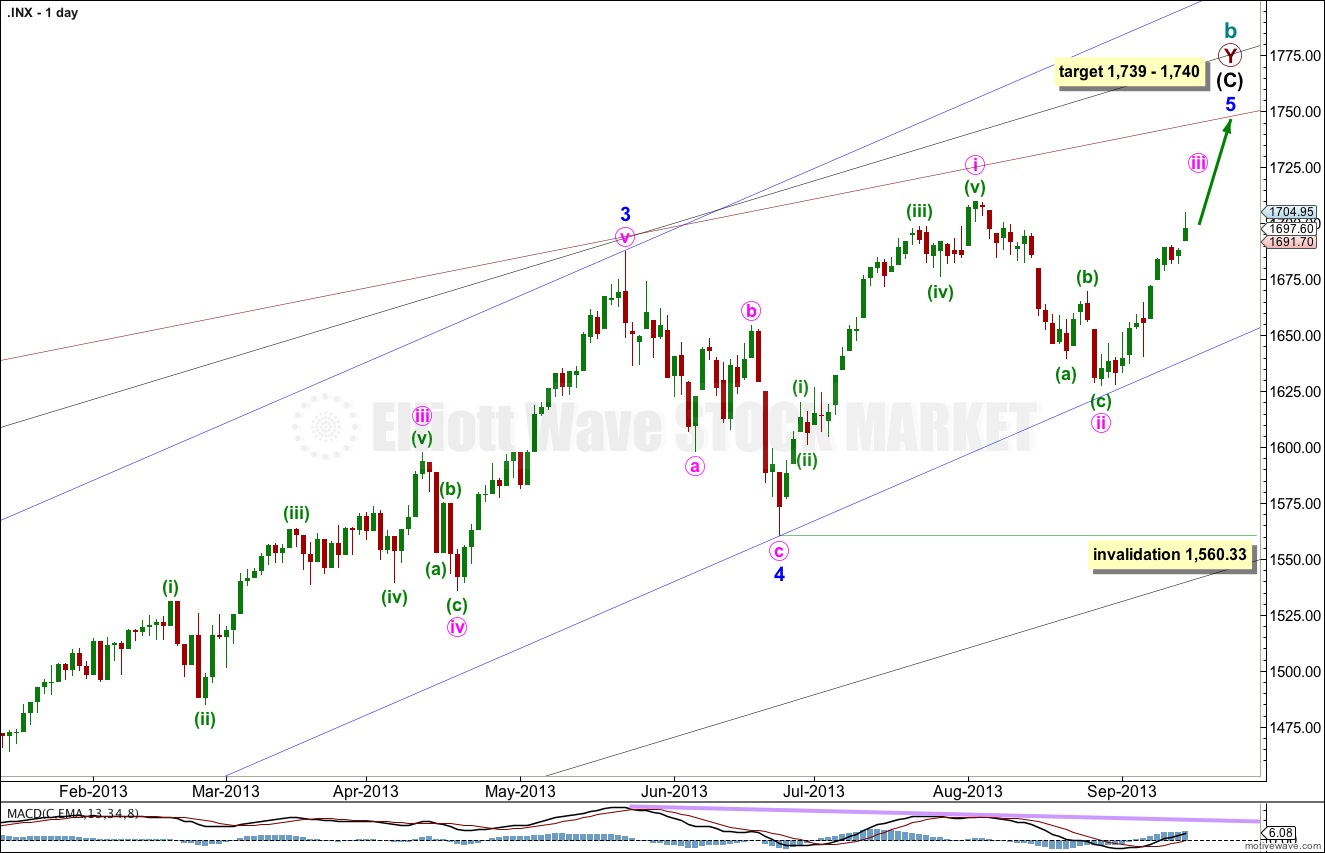
This wave count agrees with MACD and has some nice Fibonacci ratios in price and Fibonacci relationships in time.
Minor wave 3 is 15.1 points longer than 2.618 the length of minor wave 1.
Ratios within minor wave 3 are: there is no Fibonacci ratio between minute waves iii and i, and minute wave v is 5.44 points longer than equality with minute wave iii.
At 1,740 intermediate wave (C) would reach equality with intermediate wave (A). At 1,739 minor wave 5 would reach 0.618 the length of minor wave 3.
Within minor wave 5 minute wave ii may not move beyond the start of minute wave i. This wave count is invalidated with movement below 1,560.33.
Minor wave 1 lasted a Fibonacci 21 days, minor wave 2 lasted a Fibonacci 8 days, minor wave 3 has no Fibonacci duration at 98 days, and minor wave 4 lasted 22 days, just one day longer than a Fibonacci 21.
Minor wave 5 may not exhibit a Fibonacci time relationship. The next possibility may be the 29th of October (give or take two days either side of this date) where minor wave 5 would have lasted a Fibonacci 89 days. This is a date to look out for, but cannot be relied upon because Fibonacci time relationships do not occur often enough to be reliable.
Keep drawing the wider parallel channels from the monthly chart and copy them over to the daily chart.
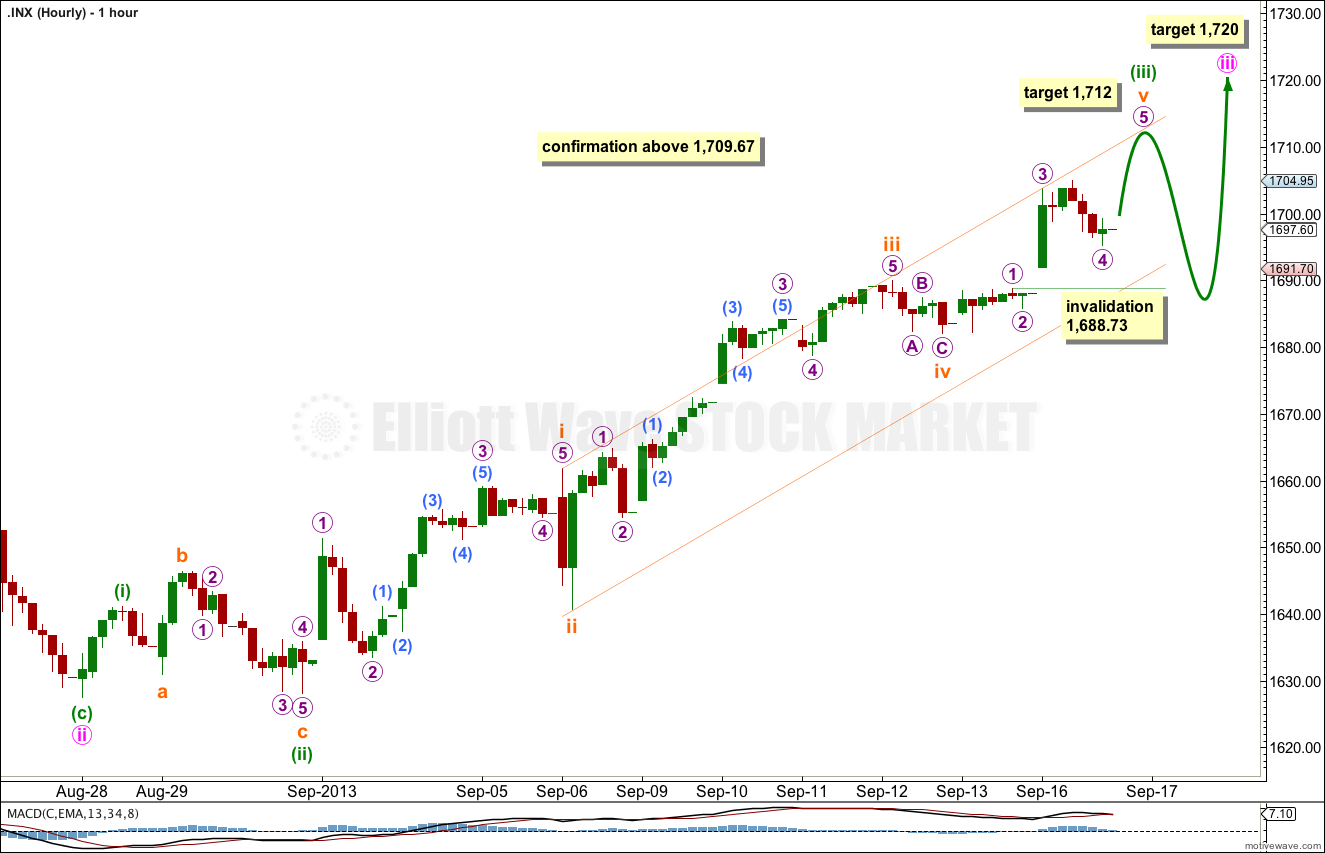
Upwards movement found resistance at the upper edge of the channel for this wave count. The structure for subminuette wave (v) is incomplete, and it needs one more wave up.
Within subminuette wave v micro wave 3 is just 0.24 points longer than 2.618 the length of micro wave 1. There may not be a Fibonacci ratio for micro wave 5 and either of 1 or 3, so I shall leave the target calculation at subminuette wave degree. At 1,712 subminuette wave v would reach 0.618 the length of subminuette wave iii.
At 1,720 minute wave iii would reach 0.618 the length of minute wave i. I am using this Fibonacci ratio to calculate the target for minute wave iii because minute wave i is clearly extended. Minute wave iii may not extend. If it were to reach equality with minute wave i it would end about 1,777. The targets for the whole movement to end would be recalculated.
When minuette waves (iii) and (iv) are completed then I will add to the target calculation for minute wave degree at minuette wave degree. The target of 1,720 may change or widen to a zone. I may be able to do this for you by the end of the week.
Tomorrow, when markets open, any further downwards movement of micro wave 4 may not move into micro wave 1 price territory. This wave count is invalidated in the very short term with movement below 1,688.73.
When micro wave 5 completes (and it should be over during tomorrow’s session) then the short term invalidation point no longer applies. At that stage we should expect a more time consuming correction for minuette wave (iv) to begin.
Minuette wave (ii) was a very deep 96% expanded flat correction of minuette wave (i). We may expect minuette wave (iv) to be a shallow correction of minuette wave (iii), and the 0.382 Fibonacci ratio would be the most likely target. It may be a zigzag, combination or triangle. It may also be a flat correction.
When minuette wave (iii) is complete redraw the parallel channel on this hourly chart. Draw the first trend line from the high of minuette wave (i) to wherever minuette wave (iii) ends. Place a parallel copy upon the low of minuette wave (ii). Expect minuette wave (iv) to find support at the lower trend line.
The invalidation point for minuette wave iv is at the high of minuette wave i at 1,641.18.
Alternate Wave Count.
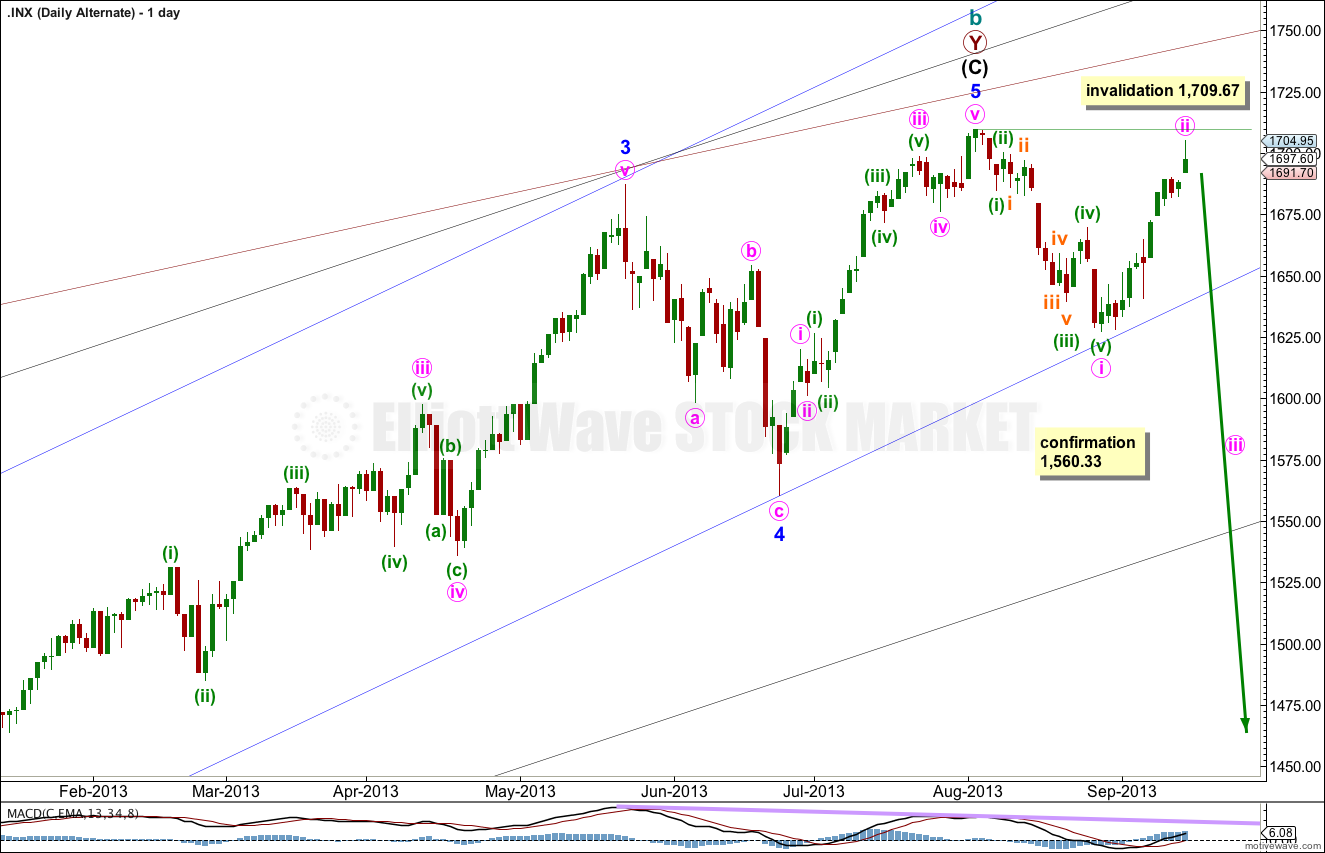
While price remains below 1,709.67 it will remain possible that we have recently seen a trend change at cycle degree. However, we should always assume the trend remains the same until proven otherwise. If the main wave count is correct then this alternate may be invalidated this week.
This is a huge trend change. The new downwards trend should last from one to several years and take price substantially below 666.76. We need some confirmation before having confidence in this wave count.
We should assume the trend is upwards until this wave count is confirmed with movement below 1,560.33, and then with a breach of the black parallel channel on the daily chart.
This wave count is the same as the main wave count, except the degree of labeling in the final upwards wave of minor wave 5 is moved up one degree.
This alternate also requires one final upwards wave at micro degree to complete the zigzag structure for minute wave ii.
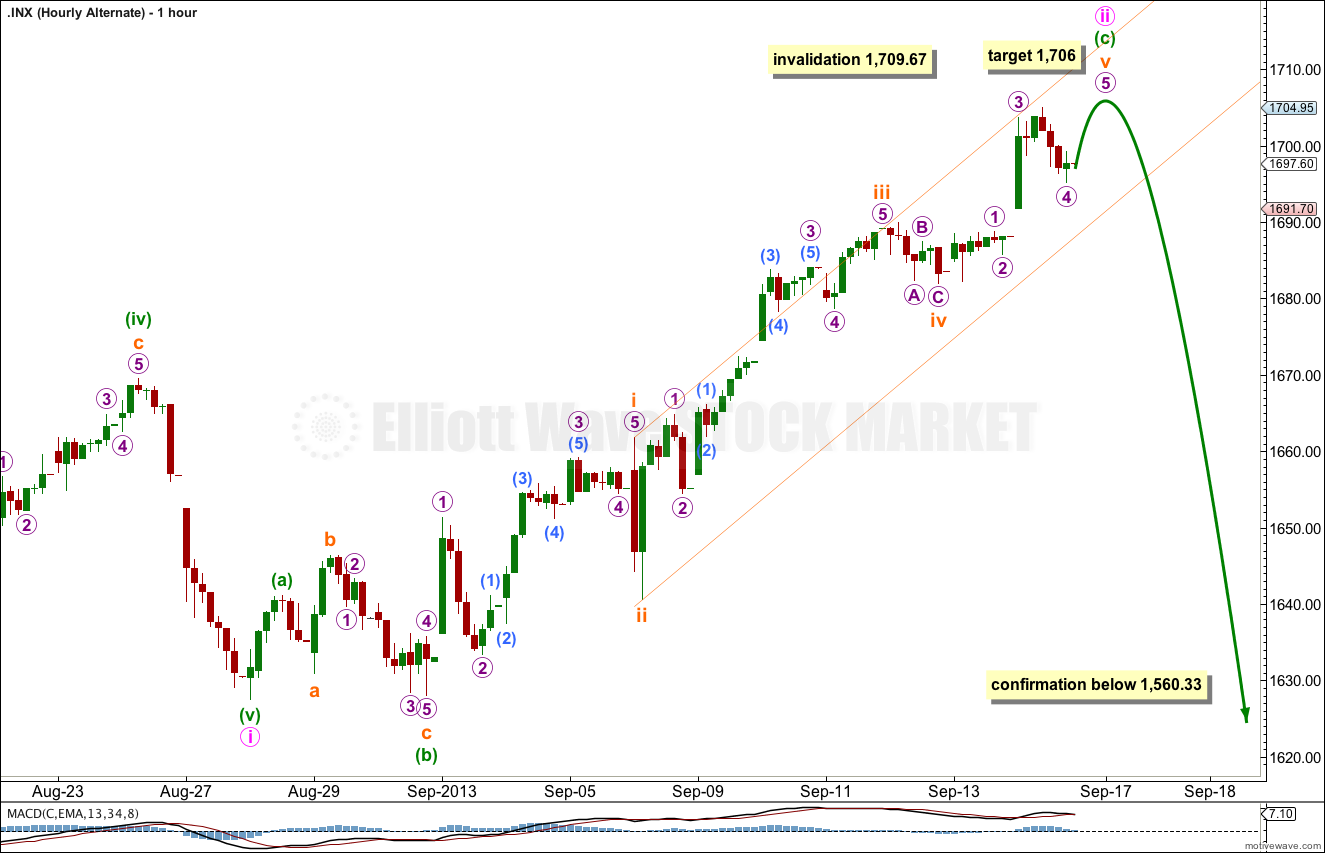
There will be no Fibonacci ratio between minuette waves (a) and (c). Minuette wave (c) has passed 1.618, 2.618 and 4.236 the length of minuette wave (a). The next Fibonacci ratio in the sequence is 6.854 which would take price above the invalidation point.
Within minuette wave (c) there is no Fibonacci ratio between subminuette waves i and iii. Subminuette wave v has passed 0.618 the length of subminuette wave i and the structure is incomplete. All other Fibonacci target calculations at subminuette wave degree are above the invalidation point. There may be no Fibonacci ratios between subminuette waves i, iii and v.
At 1,706 micro wave 5 would reach 0.618 the length of micro wave 3.
This wave count expects an end tomorrow to this correction for minute wave ii. The next wave should be a strong third wave down. If this alternate is correct then that third wave should take price below 1,560.33 and provide confirmation.
Minute wave ii may not move beyond the start of minute wave i. This wave count is invalidated with movement above 1,709.67.
Hi Lara,
No footsie this week ?
working on it now… I don’t have time today to do a full analysis, so it may be charts and a brief comment only
Nice pop up … now let’s see if our drop keeps falling which will setup Ascending Triangle http://thepatternsite.com/at.html on the 4hour