
Last analysis expected more upwards movement for Friday which is what happened. The wave count remains the same.
Click on the charts below to enlarge.
Main Wave Count.
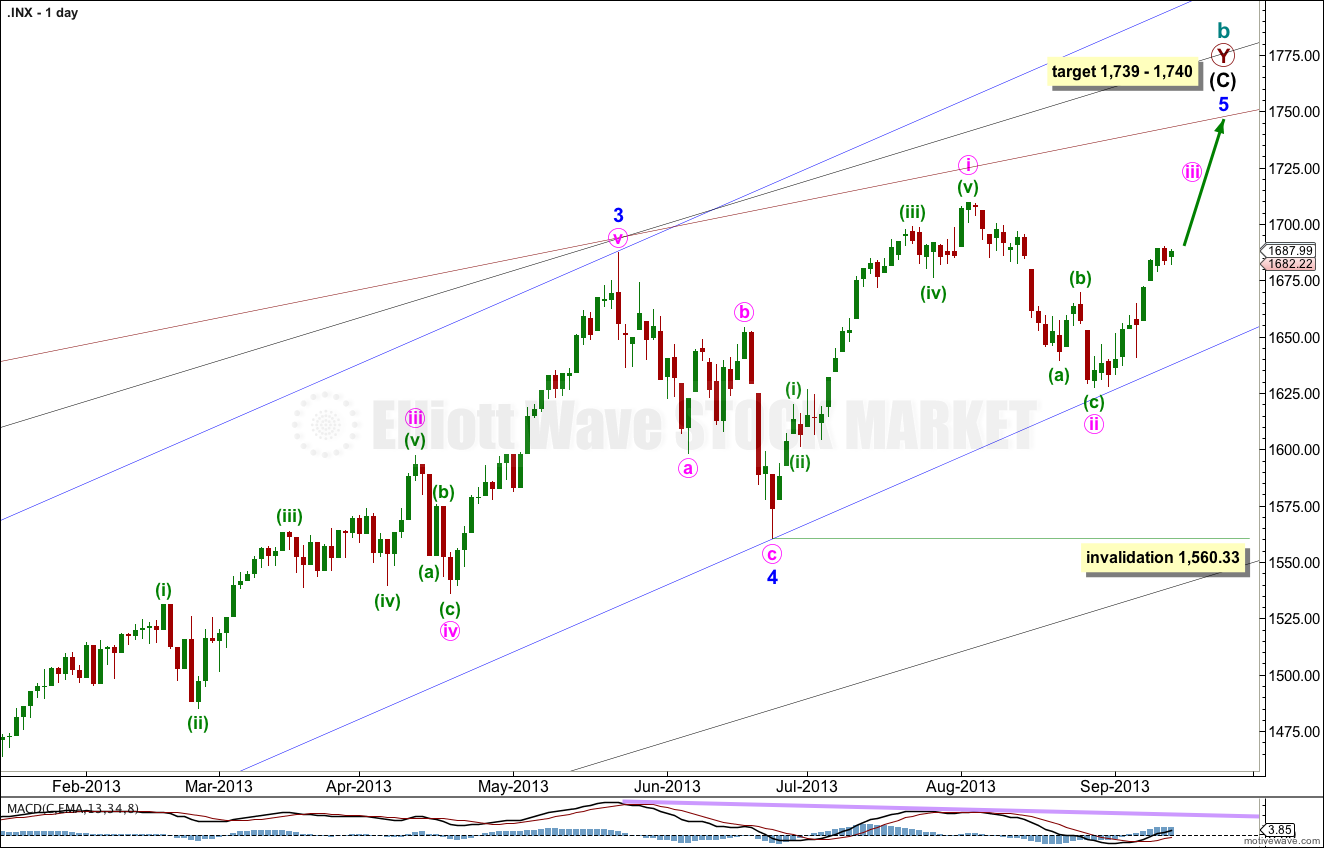
This wave count agrees with MACD and has some nice Fibonacci ratios in price and Fibonacci relationships in time.
Minor wave 3 is 15.1 points longer than 2.618 the length of minor wave 1.
Ratios within minor wave 3 are: there is no Fibonacci ratio between minute waves iii and i, and minute wave v is 5.44 points longer than equality with minute wave iii.
At 1,740 intermediate wave (C) would reach equality with intermediate wave (A). At 1,739 minor wave 5 would reach 0.618 the length of minor wave 3.
Within minor wave 5 minute wave ii may not move beyond the start of minute wave i. This wave count is invalidated with movement below 1,560.33.
Minor wave 1 lasted a Fibonacci 21 days, minor wave 2 lasted a Fibonacci 8 days, minor wave 3 has no Fibonacci duration at 98 days, and minor wave 4 lasted 22 days, just one day longer than a Fibonacci 21.
Minor wave 5 may not exhibit a Fibonacci time relationship. The next possibility may be the 29th of October (give or take two days either side of this date) where minor wave 5 would have lasted a Fibonacci 89 days. This is a date to look out for, but cannot be relied upon because Fibonacci time relationships do not occur often enough to be reliable.
Keep drawing the wider parallel channels from the monthly chart and copy them over to the daily chart.
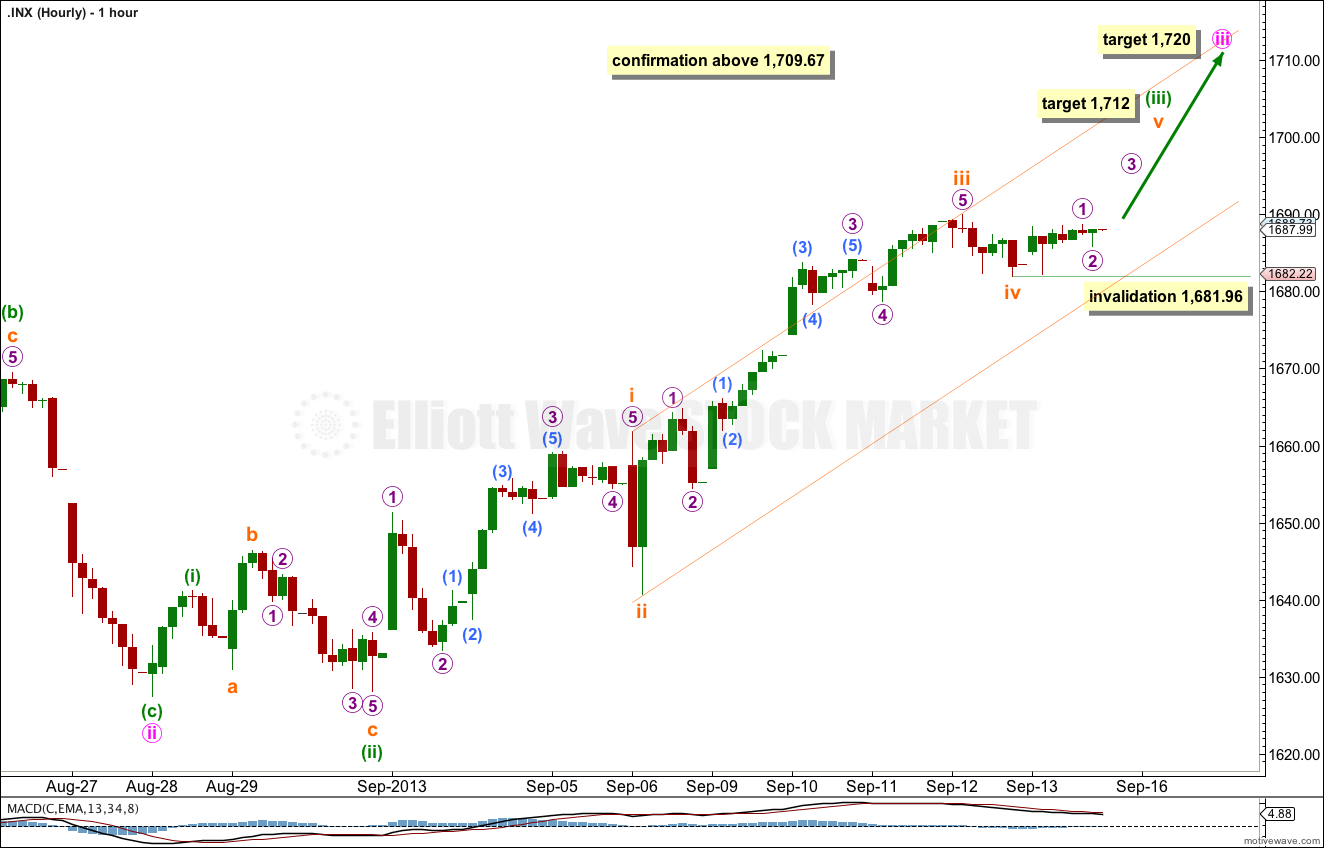
On the five minute chart the upwards movement from the end of subminuette wave iv subdivides into a five wave structure; it looks like a leading contracting diagonal. If my analysis of this structure on the five minute chart is right then subminuette wave iv is over and subminuette wave v is underway.
The targets remain the same. At 1,712 subminuette wave v would reach 0.618 the length of subminuette wave iii.
At 1,720 minute wave iii would reach 0.618 the length of minute wave i. I am using this Fibonacci ratio to calculate the target for minute wave iii because minute wave i is clearly extended. Minute wave iii may not extend.
Within subminuette wave v no second wave correction may move beyond the start of the first wave. This wave count is invalidated with movement below 1,681.96.
Alternate Wave Count.
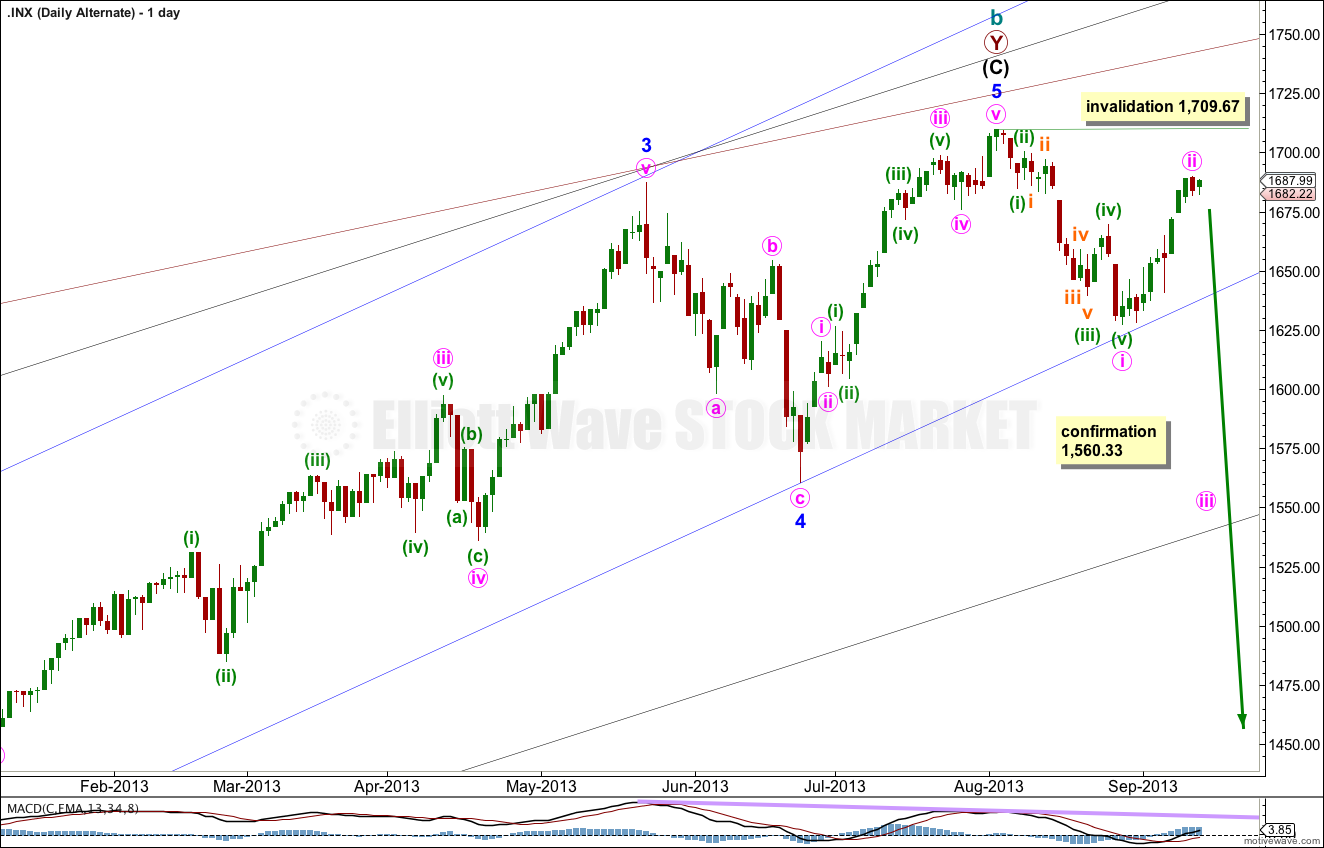
While price remains below 1,709.67 it will remain possible that we have recently seen a trend change at cycle degree. However, we should always assume the trend remains the same until proven otherwise.
This is a huge trend change. The new downwards trend should last from one to several years and take price substantially below 666.76. We need some confirmation before having confidence in this wave count.
We should assume the trend is upwards until this wave count is confirmed with movement below 1,560.33, and then with a breach of the black parallel channel on the daily chart.
This wave count is the same as the main wave count, except the degree of labeling in the final upwards wave of minor wave 5 is moved up one degree.
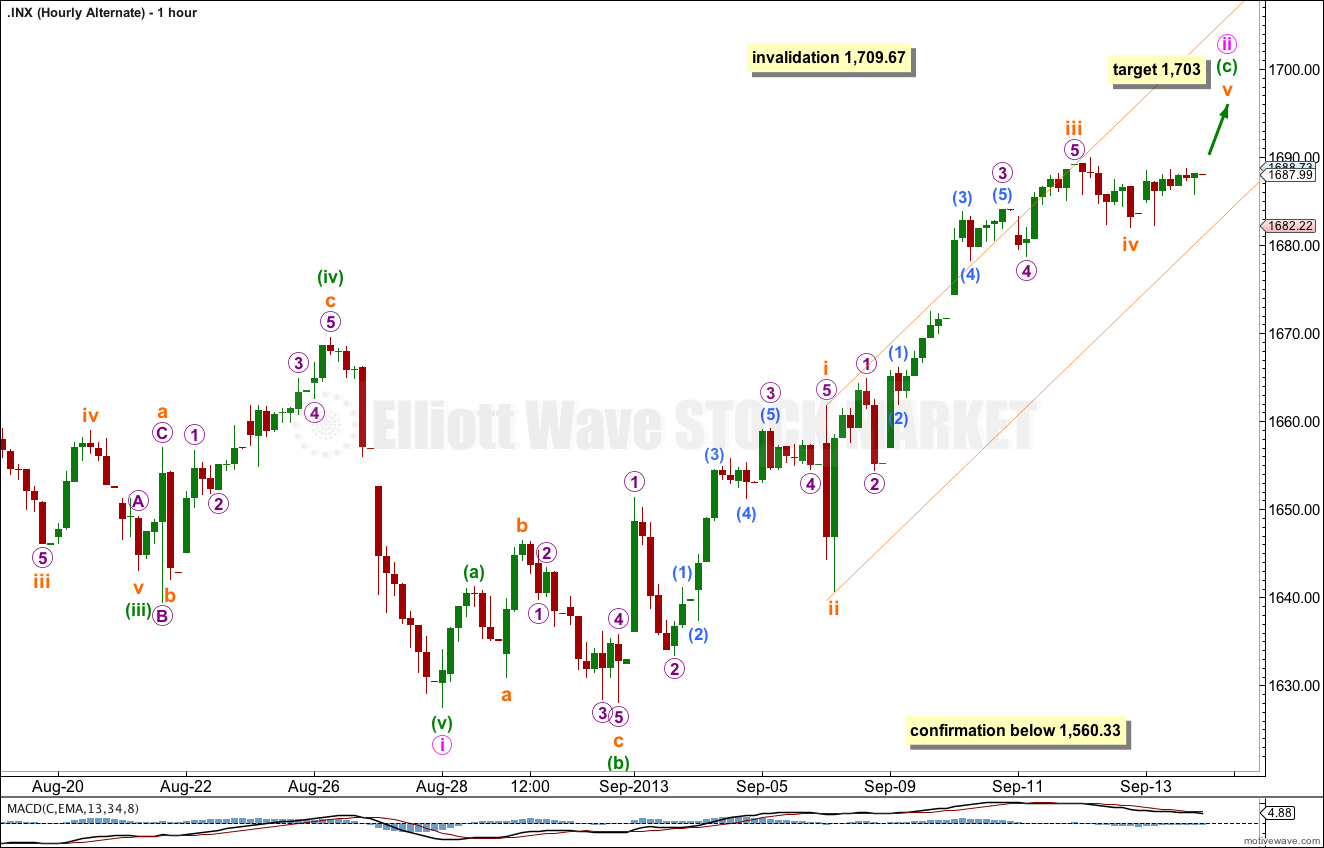
I have changed the structure of minute wave ii to a zigzag. This resolves the problem of seeing it as a regular flat trending sharply upwards. But the problem of such a short minuette wave (a) in relation to minuette wave (c) still remains.
At 1,703 subminuette wave v would reach 0.618 the length of subminuette wave i.
Minute wave ii may not move beyond the start of minute wave i. This wave count is invalidated with movement above 1,709.67.
Lara,
Is your target for the end of pink iii 1720? This just seems too low given that pink i ended at 1709. This does not give much room for pink iv to unfold.
Peter
At this stage, yes, it is.
At this stage I can only calculate the target at minute degree. I do not think minute iii will be equal in length with minute i, but it may be.
When minuette waves (iii) and (iv) are completed then I can calculate a more accurate target. I expect 1,720 may be the lower end of a zone.
Minute iii was relatively deep, so minute iv should be shallow and sideways.
But, yeah, you’re right. 11 points is not enough room for minute wave iv even if we are expecting it to be shallow.
NYMO lower highs … 55.40% high point http://scharts.co/1gfIeOB
‘Breakthrough’: Syrian chemical weapons deal // pop and drop setting up // looking for 50% retrace back to the SM(20)