
Yesterday’s analysis expected upwards movement for the main wave count. This is not what happened.
Both wave counts remain valid. Downwards movement was not enough to invalidate the main wave count. We must assume the trend remains the same, until proven otherwise.
Click on the charts below to enlarge.
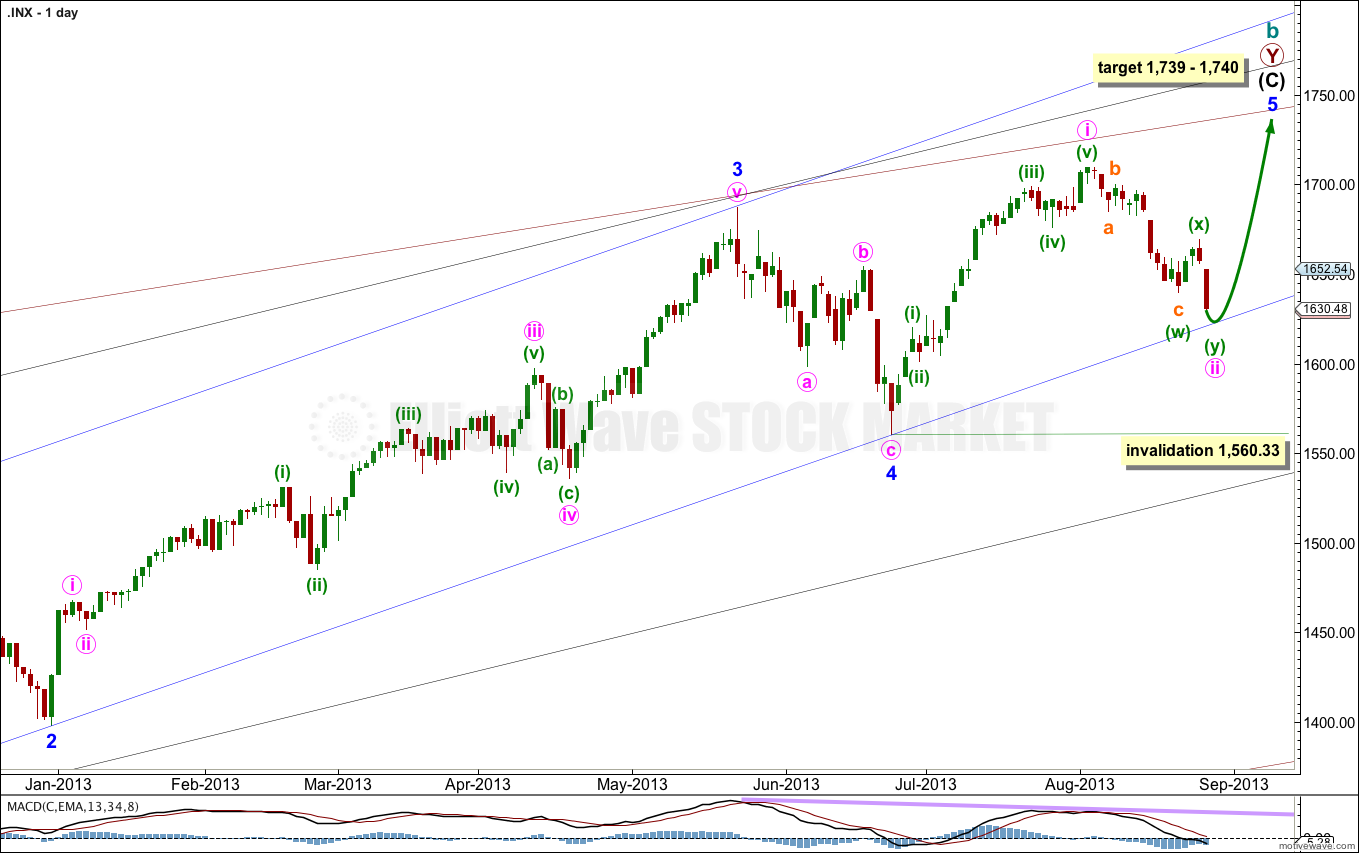
This wave count agrees with MACD and has some nice Fibonacci ratios in price and Fibonacci relationships in time.
Minor wave 3 is 15.1 points longer than 2.618 the length of minor wave 1.
Ratios within minor wave 3 are: there is no Fibonacci ratio between minute waves iii and i, and minute wave v is 5.44 points longer than equality with minute wave iii.
At 1,740 intermediate wave (C) would reach equality with intermediate wave (A). At 1,739 minor wave 5 would reach 0.618 the length of minor wave 3.
Within minor wave 5 minute wave ii may not move beyond the start of minute wave i. This wave count is invalidated with movement below 1,560.33.
Minor wave 1 lasted a Fibonacci 21 days, minor wave 2 lasted a Fibonacci 8 days, minor wave 3 has no Fibonacci duration at 98 days, and minor wave 4 lasted 22 days, just one day longer than a Fibonacci 21.
Minor wave 5 may not exhibit a Fibonacci time relationship. However, the next Fibonacci number in the sequence is 55 which could see minor wave 5 ending on 10th September (give or take a day or two either side). This may be the next possibility. At that time I will see if the structure could be considered complete, or not.
Keep drawing the wider parallel channels from the monthly chart and copy them over to the daily chart.
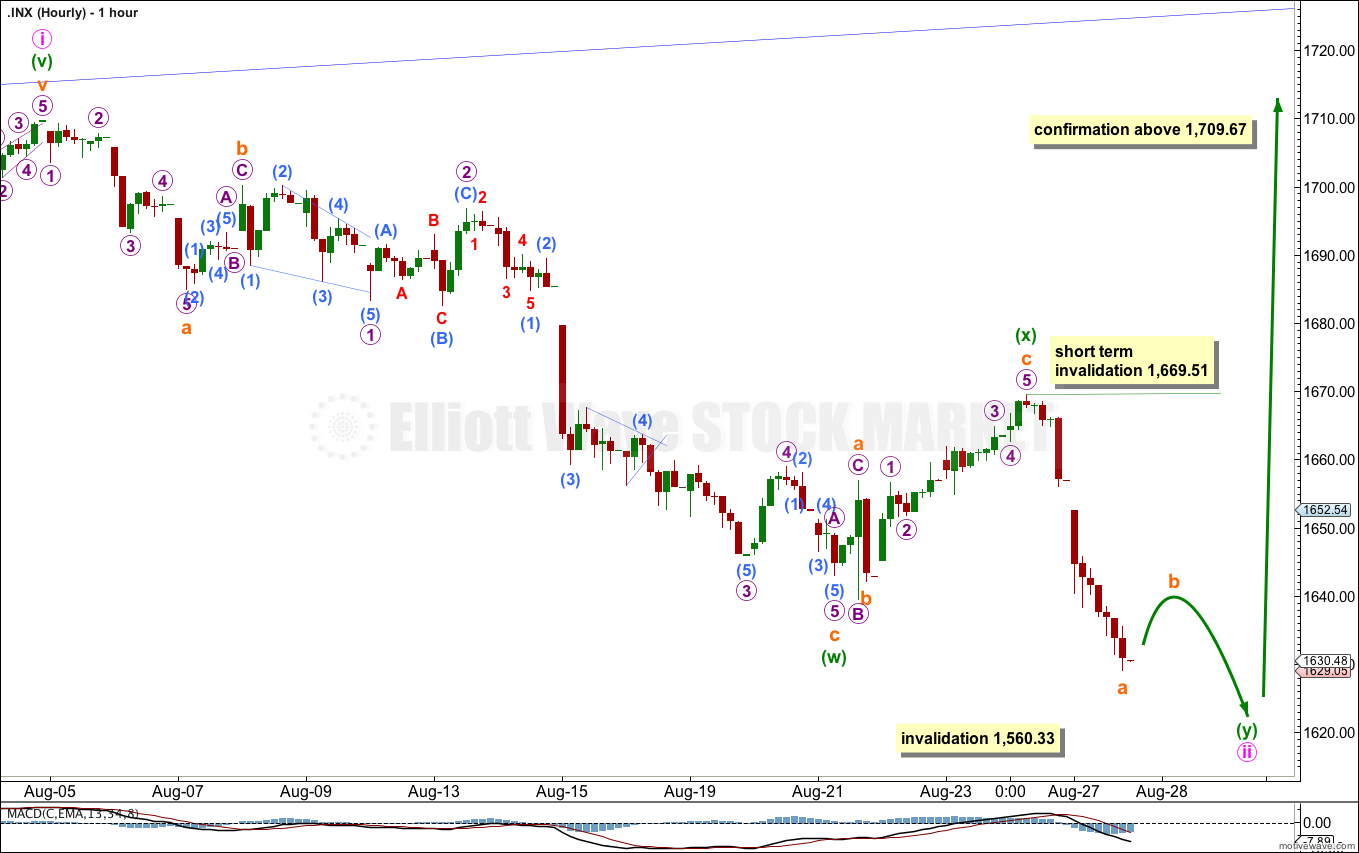
The only wave count which fits on the hourly chart for the main daily wave count is a double zigzag for minute wave ii.
The subdivisions remain the same as previously labeled for the first zigzag down. The first zigzag labeled minuette wave (w) was only 45% of minute wave i, so a second zigzag may be unfolding to deepen this correction for minute wave ii.
Within the second zigzag labeled minuette wave (y) subminuette wave b may not move beyond the start of subminuette wave a. This wave count is invalidated in the short term with movement above 1,669.51.
When subminuette wave b upwards is a completed corrective structure then we should expect more downwards movement to new lows for subminuette wave c.
Minute wave ii may not move beyond the start of minute wave i. This wave count is invalidated with movement below 1,560.33.
Keep drawing the parallel channel on the daily chart about intermediate wave (C). Draw the channel from the lows of minor waves 2 to 4, then place a parallel copy upon the high of minor wave 3. Copy this channel over to the hourly chart. We may see downwards movement find support at the lower end of this channel.
Alternate Wave Count.
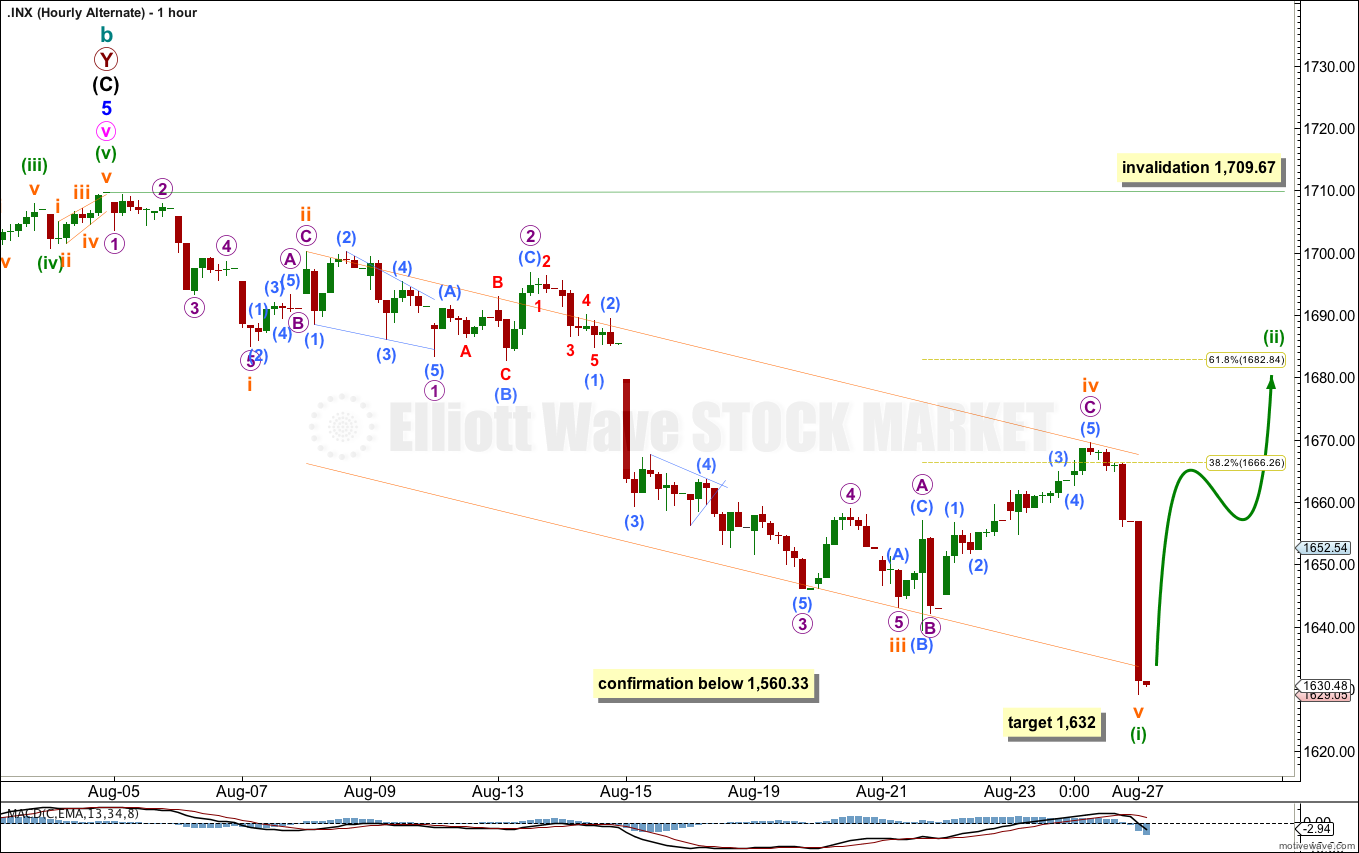
While price remains below 1,709.67 it will remain possible that we have recently seen a trend change at cycle degree. However, we should always assume the trend remains the same until proven otherwise.
We should assume the trend is upwards until this wave count is confirmed with movement below 1,560.33, and then with a breach of the black parallel channel on the daily chart.
This alternate hourly chart sees a five wave structure downwards now complete. This should be followed by a deep second wave correction. Minuette wave (ii) would be most likely to reach up to about the 0.618 Fibonacci ratio of minuette wave (i) at 1,682.84.
Minuette wave (ii) may not move beyond the start of minuette wave (i). This wave count is invalidated with movement above 1,709.67.
I agree it’s very subjective and I do use TA. This allowed me not to go by main count. I’m not the expert so I would expect a paid site to do the same. I apologize by the words I chose and I wasn’t looking for anyone to pick a top. I do believe 1710 will be broken, but it won’t be Minor 5. This is most likely a routine 10% correction and not a trend change at cycle degree.
What I am doing is just pure Elliott wave analysis, supported by MACD as an indicator of momentum and sometimes volume to help determine the wave count. EW analysis also uses trend lines.
I am doing this because if it is as pure as I can make it, then each member can use it in their own way. Members will be using a variety of other TA methods. It’s up to them to pick which ones they use, then they add my EW analysis to their decision making toolkit.
From a pure EW perspective, the main and alternate wave counts would really have about an even probability. I could not pick either one. But it is my experience that EW has a tendency to pick turning points too early. It is a method which always expects change. And for this reason I have the mantra “always assume the trend remains the same, until proven otherwise” and “the trend is your friend”.
With this approach I am able to balance the tendency of EW to call turns too early. I can indicate when a turn may have occurred, and then advise at which price point we know for sure (confirmation).
Since May 2011 there have been several points along the way up where the trend may have changed from up to down. But at each point none were finally confirmed. If I was trying to pick the top, I probably would have done so several times along the way now (and in fact have done this at least twice before I think), and members would be quite rightly… annoyed with me.
So… I can either get it wrong multiple times (picking the top) or once (when the top is finally confirmed).
My job is to show you as many EW counts as I can find in this market, and rank them according to probability. I try to keep my analysis as neutral and accurate as possible.
Please also keep in mind that this is a HUGE trend change. The new downwards trend should last one to several years and should take price substantially below 666.76. It’s a major market crash. I’m not going to call that without confirmation.
blackjak…. isnt that the point? EW always has alternatives, so therefore there are only certain times when you can use it to accurately predict where the market will go.
Its for you to use this as a tool in your toolbox. Sometimes counts are contrived and can be made to fit the vast percentage of moves. Even EW core rule that W4 must not enter the price territory of W1 is broken if its a LD or ED. That really says it all. Unless there was a recommendation – i.e. +@ x; stop @ y, target z, then you will never get a proper analysis of the profitability or otherwise of any method.
Because it is so subjective, I believe its your responsibility to use other TA tools to confirm which count you weight as the most likely.
Lara-
Do you use classic TA to supplement your EW analysis? If you did, I believe you would have swapped the main and alternate count a few weeks back? I’ll be honest the minute ii is underway for 3 weeks count wreaks of stubborness and a bad trader. This wave today looks like more like a 3 than a 5 and is debatable.
Firstly, you’re asking me to pick a top. I’m not going to do this. What I am going to do is use alternates and confirmation / invalidation points to indicate a trend change.
It’s a trend change at cycle degree. It’s huge. Having patience about such a big trend change would, I think, be wise.
Your words “for 3 weeks count wreaks of stubborness and a bad trader” is out of line. If you don’t agree with my Elliott wave analysis you are welcome to cancel your membership.
Please read the comments policy before making any further comments.