
Yesterday’s main wave count had two hourly charts. The first was invalidated with movement below 1,645.84. Price continued lower to reach 2.57 points below the target on the second hourly chart.
The main wave count remains the same.
Click on the charts below to enlarge.
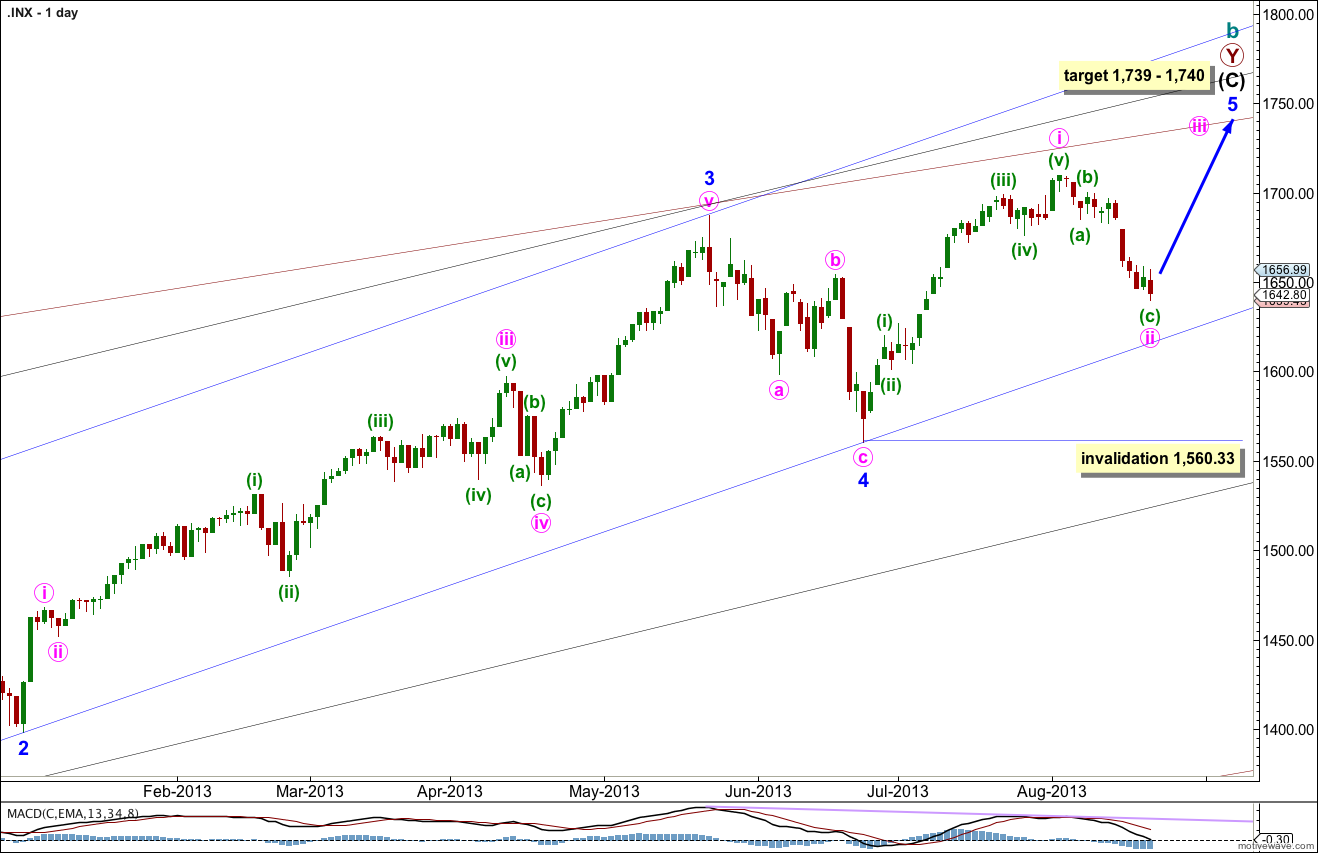
This wave count agrees with MACD and has some nice Fibonacci ratios in price and Fibonacci relationships in time.
Minor wave 3 is 15.1 points longer than 2.618 the length of minor wave 1.
Ratios within minor wave 3 are: there is no Fibonacci ratio between minute waves iii and i, and minute wave v is 5.44 points longer than equality with minute wave iii.
At 1,740 intermediate wave (C) would reach equality with intermediate wave (A). At 1,739 minor wave 5 would reach 0.618 the length of minor wave 3.
Within minor wave 5 minute wave ii may not move beyond the start of minute wave i. This wave count is invalidated with movement below 1,560.33.
Minor wave 1 lasted a Fibonacci 21 days, minor wave 2 lasted a Fibonacci 8 days, minor wave 3 has no Fibonacci duration at 98 days, and minor wave 4 lasted 22 days, just one day longer than a Fibonacci 21.
Minor wave 5 may not exhibit a Fibonacci time relationship. However, the next Fibonacci number in the sequence is 55 which could see minor wave 5 ending on 10th September (give or take a day or two either side). This may be the next possibility. At that time I will see if the structure could be considered complete, or not.
Keep drawing the wider parallel channels from the monthly chart and copy them over to the daily chart.
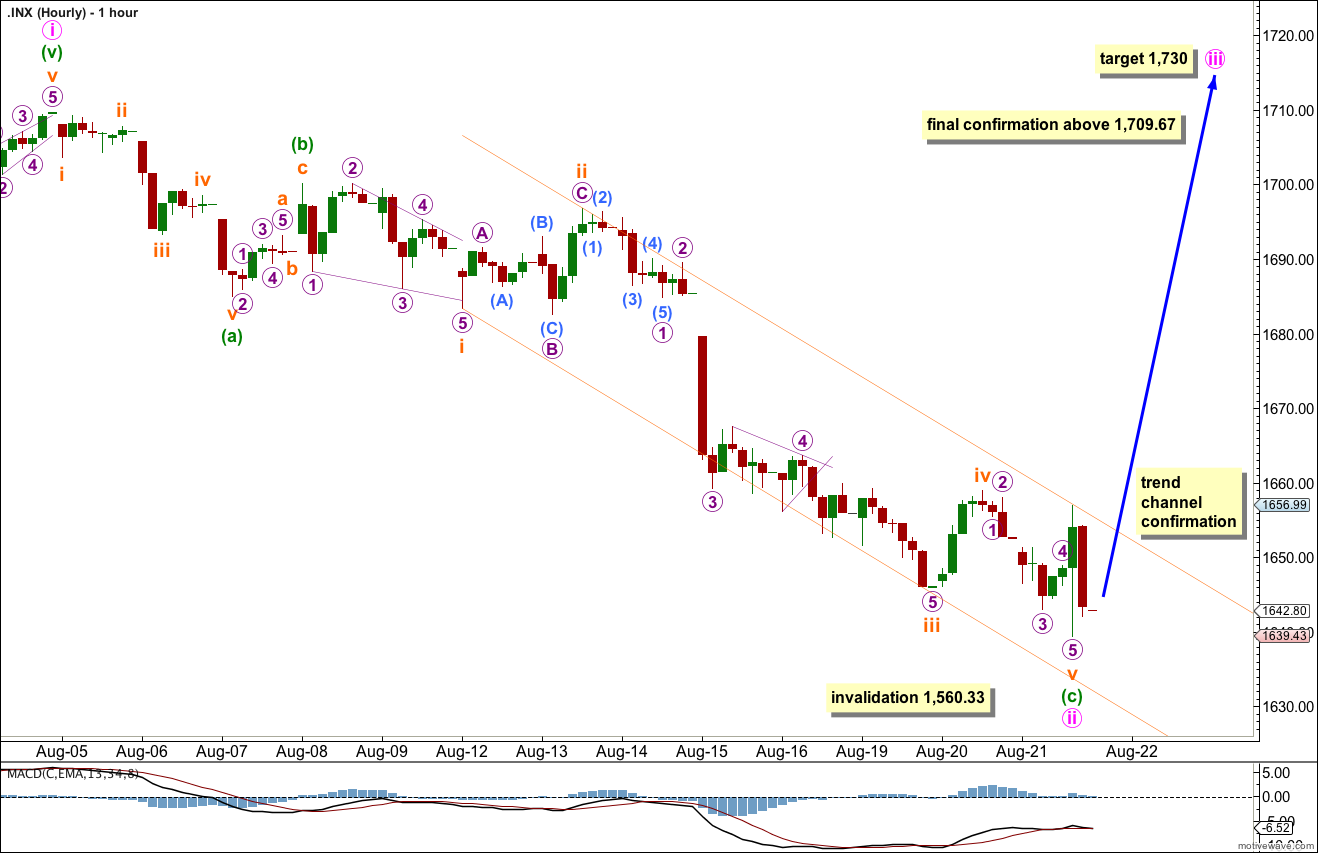
Minute wave ii has now lasted a Fibonacci 13 days and the structure may be seen as complete. It is reasonably likely that it is over here and the next wave should be a third wave upwards.
Within minute wave ii zigzag minuette wave (c) is 4.07 points short of 2.618 the length of minuette wave (a).
Ratios within minuette wave (a) are: subminuette wave iii has no Fibonacci ratio to subminuette wave i, and subminuette wave v is 0.88 points short of equality with subminuette wave iii.
Ratios within minuette wave (c) are: subminuette wave iii has no Fibonacci ratio to subminuette wave i, and subminuette wave v is just 0.02 short of 0.382 the length of subminuette wave iii.
There is alternation between subminuette waves ii and iv: subminuette wave ii was a deep expanded flat, and subminuette wave iv is a shallow zigzag.
When we see movement above the parallel channel containing minuette wave (c) then we shall have trend channel confirmation of a trend change. Movement above 1,709.67 will provide full and final confirmation of this wave count and invalidation of the alternate.
At this stage I expect it is unlikely that minute wave ii would continue lower, but while price remains firmly within the channel containing minuette wave (c) we must allow for this possibility. For this reason I will leave the invalidation point the same today. Minute wave ii may not move beyond the start of minute wave i. This wave count is invalidated with movement below 1,560.33.
Alternate Wave Count.
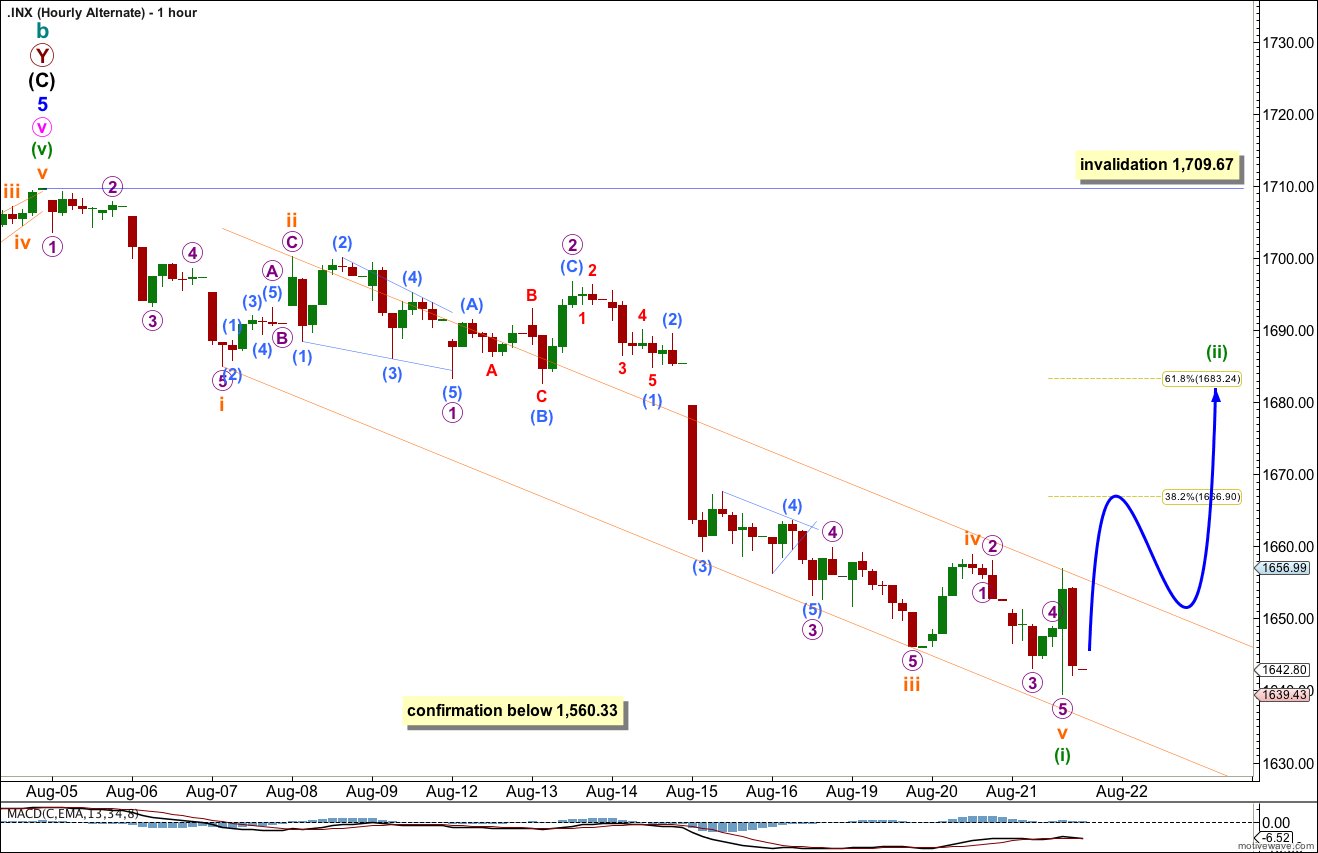
While price remains below 1,709.67 it will remain possible that we have recently seen a trend change at cycle degree. However, we should always assume the trend remains the same until proven otherwise.
We should assume the upwards trend remains valid until this wave count is confirmed with movement below 1,560.33, and then with a breach of the black parallel channel on the daily chart.
The subdivisions of this hourly wave count are now different to the main wave count. It is possible to see this downwards movement as a five wave structure, although it does have a better fit as a three.
This downwards impulse for minuette wave (i) may have just completed. This alternate wave count now expects upwards movement to be a second wave correction for minuette wave (ii). Movement above 1,709.67 would invalidate this alternate wave count and confirm the main wave count.
Fun ride up and down … but I think you are right time to go up … with a HIGHER NYMO http://scharts.co/17LbnxI and lower SPX at the close.