
Movement below 1,676.03 invalidated both hourly wave counts for the main daily wave count. This strong downwards movement does fit for the alternate, but it is not enough to give us confirmation.
Click on the charts below to enlarge.
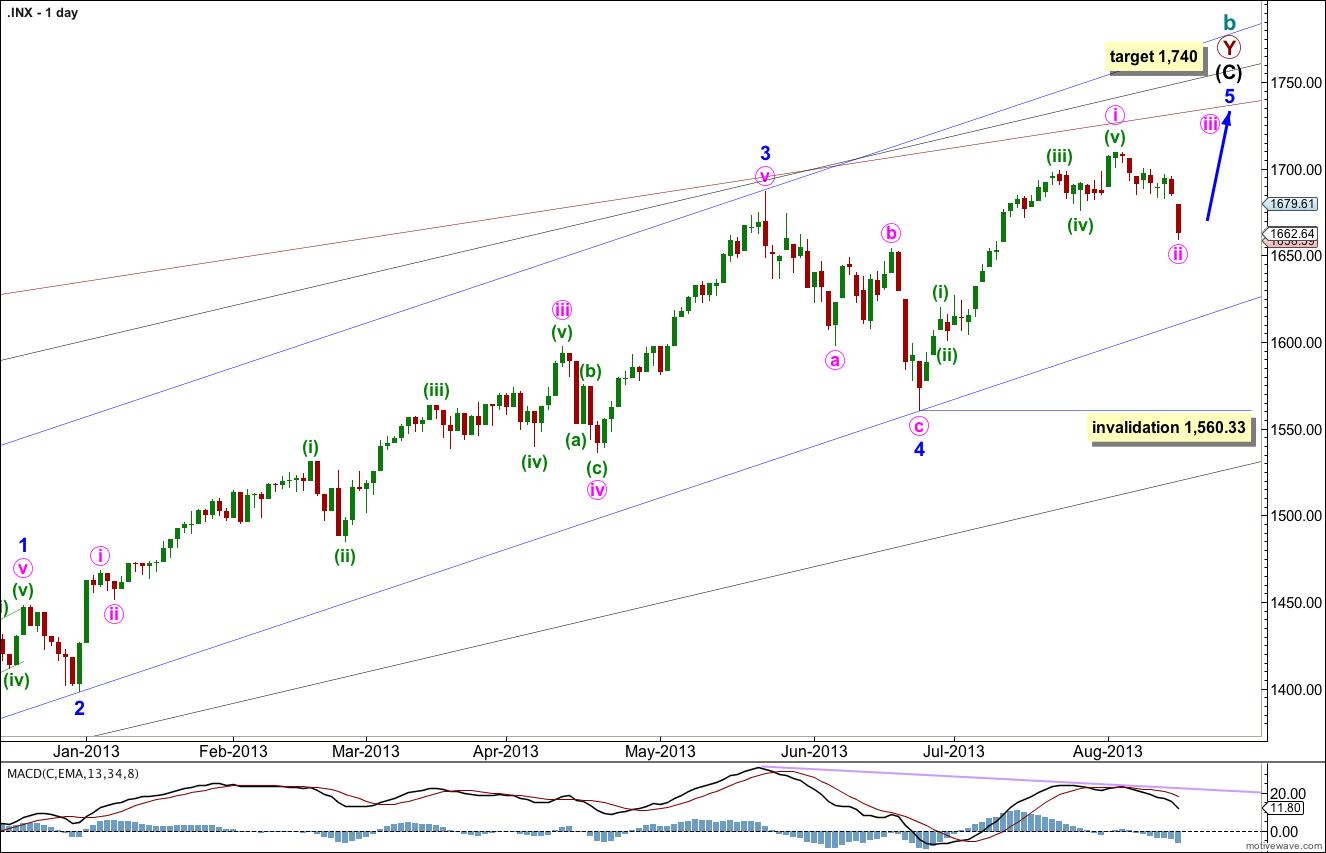
This wave count agrees with MACD and has some nice Fibonacci ratios in price and Fibonacci relationships in time.
Minor wave 3 is 15.1 points longer than 2.618 the length of minor wave 1.
Ratios within minor wave 3 are: there is no Fibonacci ratio between minute waves iii and i, and minute wave v is 5.44 points longer than equality with minute wave iii.
At 1,740 intermediate wave (C) would reach equality with intermediate wave (A).
Within minor wave 5 minute wave ii may not move beyond the start of minute wave i. This wave count is invalidated with movement below 1,560.33.
Minor wave 1 lasted a Fibonacci 21 days, minor wave 2 lasted a Fibonacci 8 days, minor wave 3 has no Fibonacci duration at 98 days, and minor wave 4 lasted 22 days, just one day longer than a Fibonacci 21.
At this stage it looks like minor wave 5 may not exhibit a Fibonacci time relationship. However, the next Fibonacci number in the sequence is 55 which could see minor wave 5 ending on 10th September (give or take a day or so either side). This may be the next possibility. At that time I will see if the structure could be considered complete, or not.
Keep drawing the wider parallel channels from the monthly chart and copy them over to the daily chart.
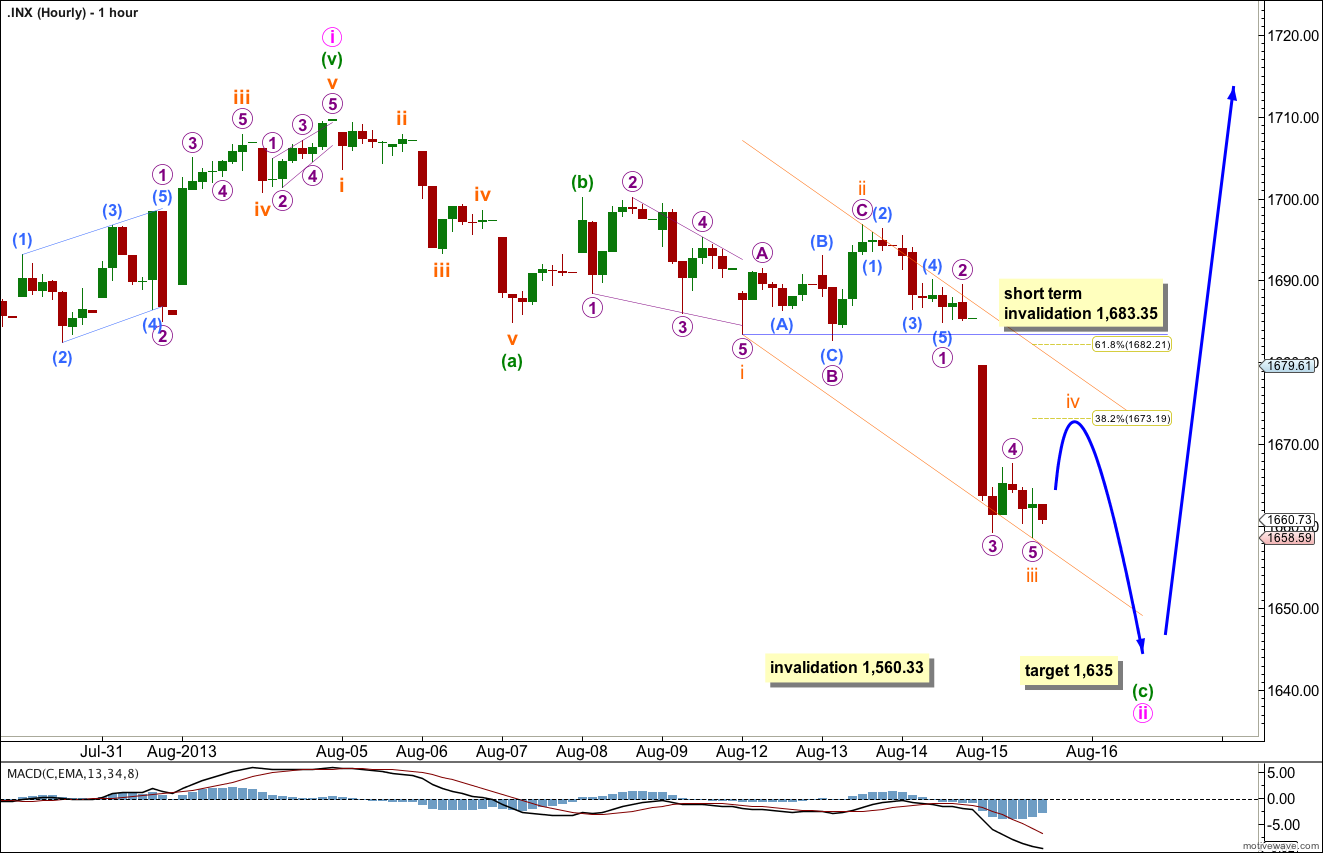
If we simply move the labeling within minor wave 5 all down one degree from yesterday’s labeling then this downwards movement may be minute wave ii following a completion of minute wave i.
The main difference now between this main wave count and the alternate below is the degree of labeling within the final upwards impulse from 1,560.33 to 1,709.67.
If downwards movement is minute wave ii then it may be unfolding as a single zigzag. Within the zigzag the strong downward movement of Thursday’s session is a third wave within minuette wave (c).
At 1,635 minuette wave (c) would reach 2.618 the length of minuette wave (a).
Within minuette wave (c) subminuette wave iii just finished during Thursday’s session. There is no Fibonacci ratio between subminuette waves iii and i.
Ratios within subminuette wave iii are: micro wave 3 is 1.10 points short of 2.618 the length of micro wave 1, and micro wave 5 has no Fibonacci ratio to either of micro waves 3 or 1.
Subminuette wave iv should move price at least a little higher, and show alternation with subminuette wave ii which was a deep 80% zigzag. Subminuette wave iv is likely to be shallow reaching up to about the 0.382 Fibonacci ratio or below, and should be a sideways moving flat, combination or triangle.
Subminuette wave iv may not move into subminuette wave i price territory. This wave count is invalidated in the short term with movement above 1,683.35.
When minuette wave (c) is completed with subminuette waves iv and v then we should expect a resumption of the upwards trend.
Alternate Wave Count.
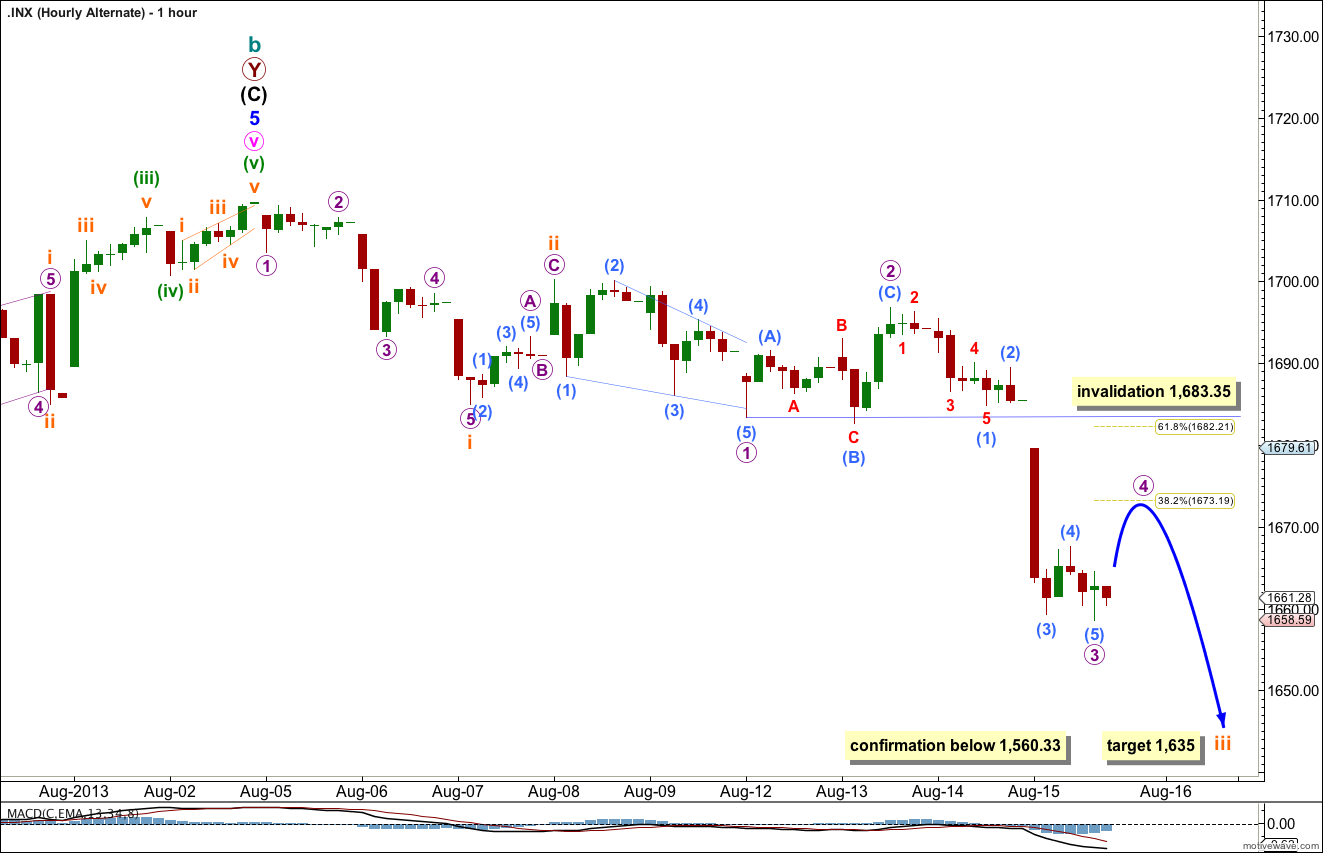
While price remains below 1,709.67 it will remain possible that we have recently seen a trend change at cycle degree. However, we should always assume the trend remains the same until proven otherwise.
We should assume the upwards trend remains valid until this wave count is confirmed with movement below 1,560.33, and then with a breach of the black parallel channel on the daily chart.
The increase in downwards momentum during Thursday’s session fits nicely with this wave count, but it is not enough to confirm it.
The subdivisions of this hourly wave count are the same as for the main wave count because A-B-C and 1-2-3 both subdivide in exactly the same way, 5-3-5.
At 1,635 subminuette wave iii would reach 2.618 the length of subminuette wave i.
Micro wave 4 may not move into micro wave 1 price territory. This wave count is invalidated with movement above 1,683.35.
Monthly and weekly … no impulsive action in the S&P since 2009’s low // have to look for 3 or more all time new highs coming this year. // STARTING to buy again 1654 – 1645 (cash)