
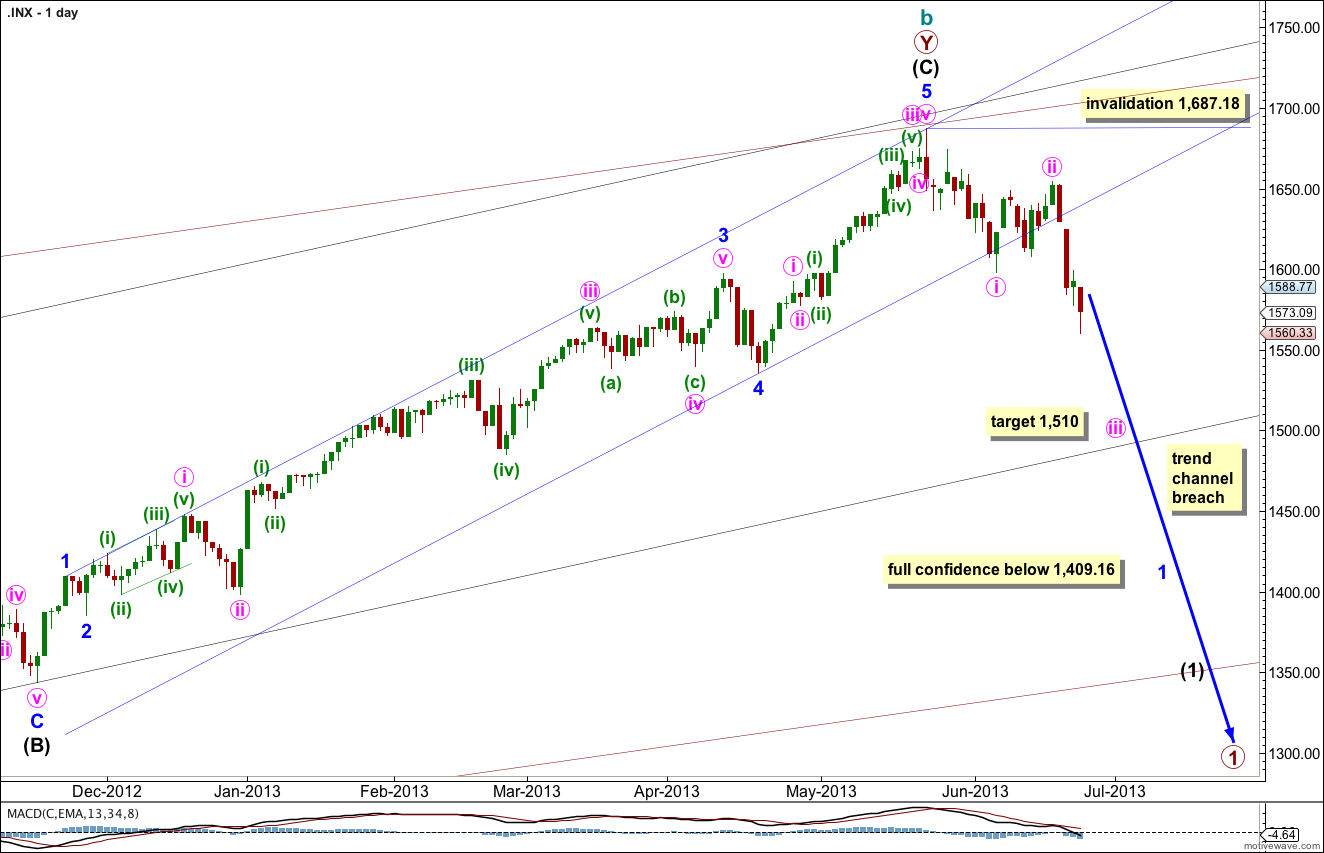
Further downwards movement has invalidated the labeling of the main wave count and confirmed the alternate daily wave count. This downwards movement clearly breaches any best fit channel containing intermediate wave (C) upwards and as a result the wave counts are now swapped over. I will review the bigger picture today with the monthly chart.
Click on the charts below to enlarge.
Main Wave Count.
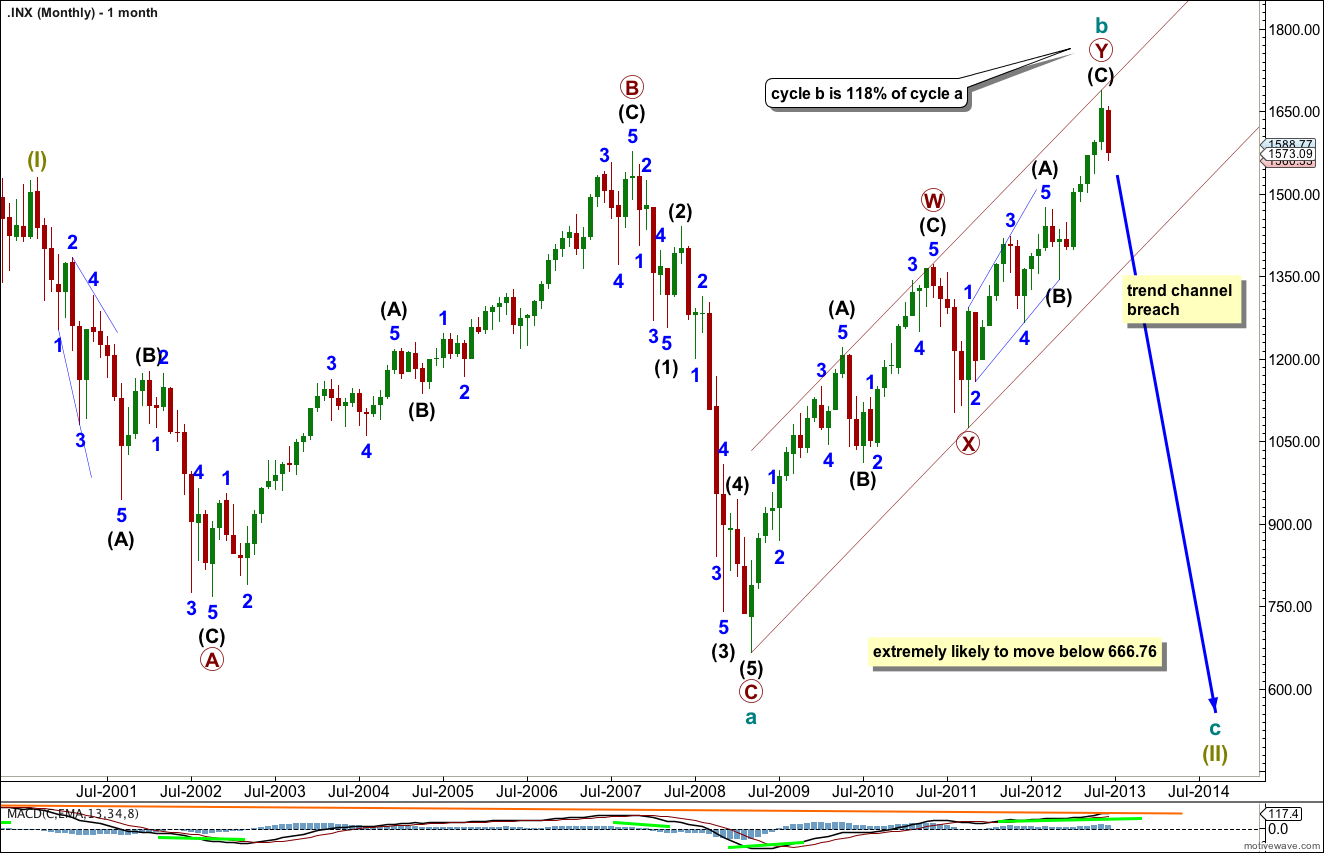
The bigger picture sees a super cycle second wave unfolding as an expanded flat correction. Within the expanded flat cycle wave a subdivided into a three (flat) and cycle wave b may now be over as a three (double zigzag) and therefore cycle wave c downwards must subdivide as a five.
When the parallel channel drawn about cycle wave b is clearly breached we shall have full and final confirmation that the trend has changed.
I will not calculate targets until we have a channel breach on the daily chart. It would be premature to do so prior to that confirmation.
Super cycle wave II is an expanded flat because cycle wave b is over 105% the length of cycle wave a, at 118%. This structure normally sees a C wave which moves substantially beyond the end of the a wave, and we would expect movement substantially below 666.76.
I have redrawn trend channels today. The widest maroon channel is copied over from the monthly chart and is unchanged. It may be that price found final resistance at the upper edge of this channel.
The black channel in the middle is drawn about the zigzag of primary wave Y. Draw the first trend line from the start of primary wave Y to the end of intermediate wave (B). Place a parallel copy upon the extreme within intermediate wave (A). The upper edge of this channel also may be where price found resistance and where intermediate wave (C) ended. It crosses over nicely with the monthly maroon trend channel.
The smallest blue channel is the most conservative best fit I can see for intermediate wave (C). It is very clearly breached by downwards movement.
I have looked back to September 2000 on the daily chart at smaller narrow channels about intermediate degree movements. Most of the time a breach like this indicates a trend change, but not always. What would give me more confidence in this trend change is a clear breach of the black intermediate degree channel. When that is breached I will calculate downwards targets for you.
There is no classic technical divergence between price and MACD on the daily or weekly charts. This is possible, but unusual for the S&P 500. This must reduce the probability of this wave count. We must still seriously consider the alternate.
Minor wave 2 may not move beyond the start of minor wave 1. This wave count is invalidated with movement above 1,687.18.
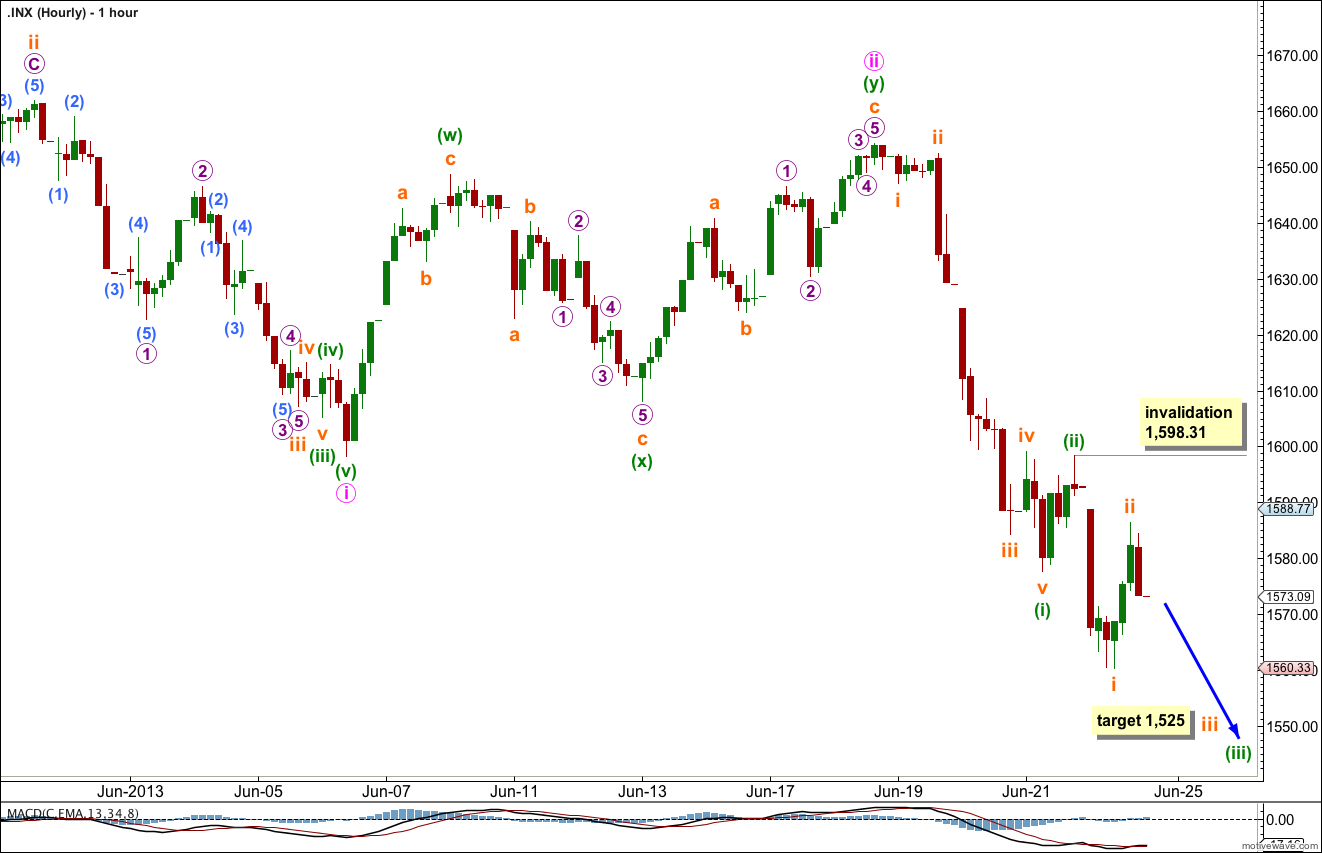
Minuette wave (ii) completed as a very brief second wave correction. This is certainly possible within a third wave. Minuette wave (iii) within minute wave iii may have just begun.
At 1,525 subminuette wave iii would reach 1.618 the length of subminuette wave i. This target may be one or two days away.
Any further upwards movement of subminuette wave ii may not move beyond the start of subminuette wave i. This wave count is invalidated with movement above 1,598.31. If subminuette wave ii moves higher then the target for subminuette wave iii must move correspondingly higher also.
Subminutte wave ii may not move beyond the start of subminuette wave i. This wave count is invalidated with movement above 1,598.31.
Alternate Wave Count.
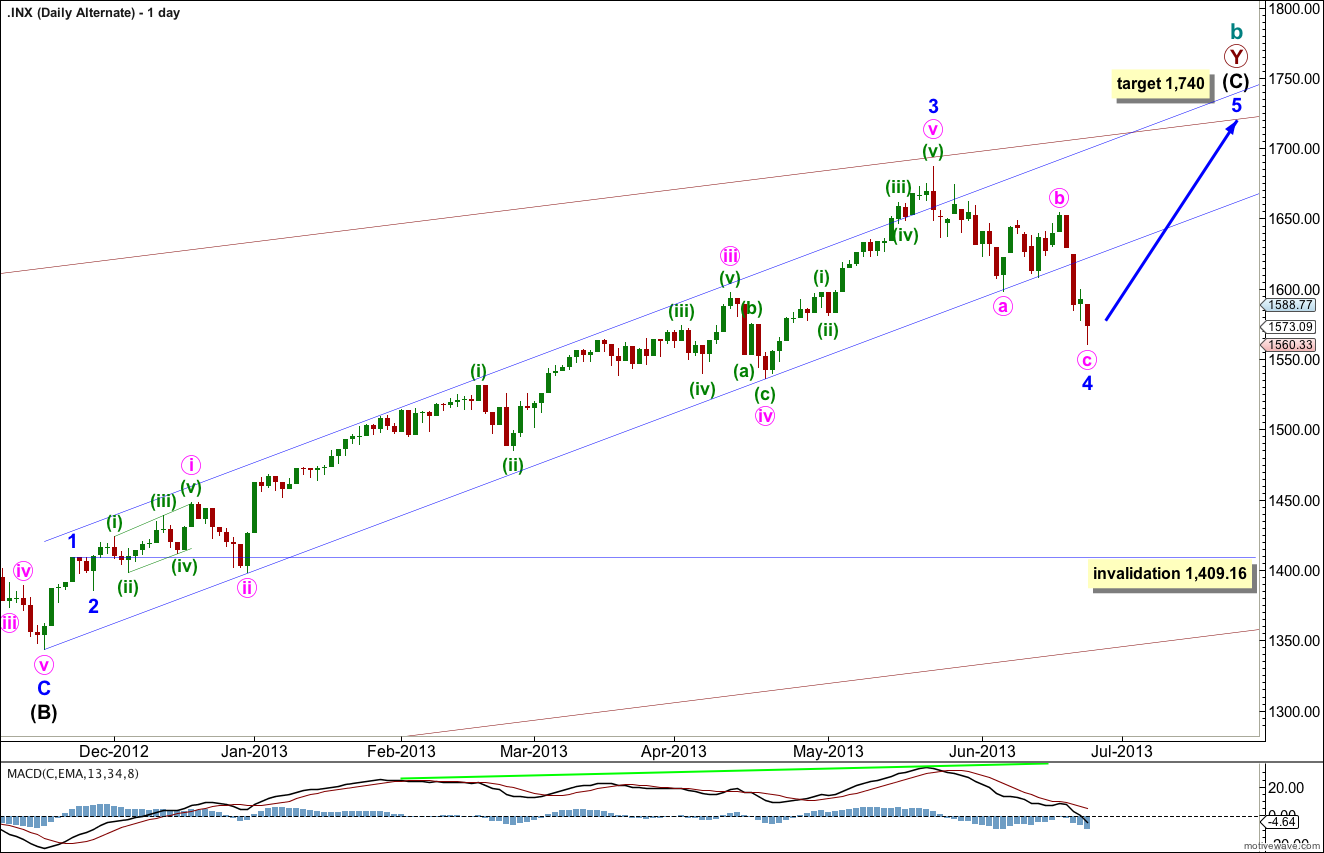
This wave count moves minor wave 1 down to the same point as on the main daily wave count. The biggest problem with this wave count and the reason it is an alternate is the size of minor wave 4: it is out of proportion to all the other corrections within intermediate wave (C) and clearly breaches a channel containing intermediate wave (C) no matter how that channel is drawn. Sometimes fourth waves do this and we must consider this possibility.
Within intermediate wave (C) minor wave 3 is 23 points longer than 4.236 the length of minor wave 1.
The lack of classic technical divergence between price and MACD also supports this wave count.
At 1,740 intermediate wave (C) would reach equality with intermediate wave (A).
Minor wave 4 may not move into minor wave 1 price territory. This wave count is invalidated with movement below 1,409.16.
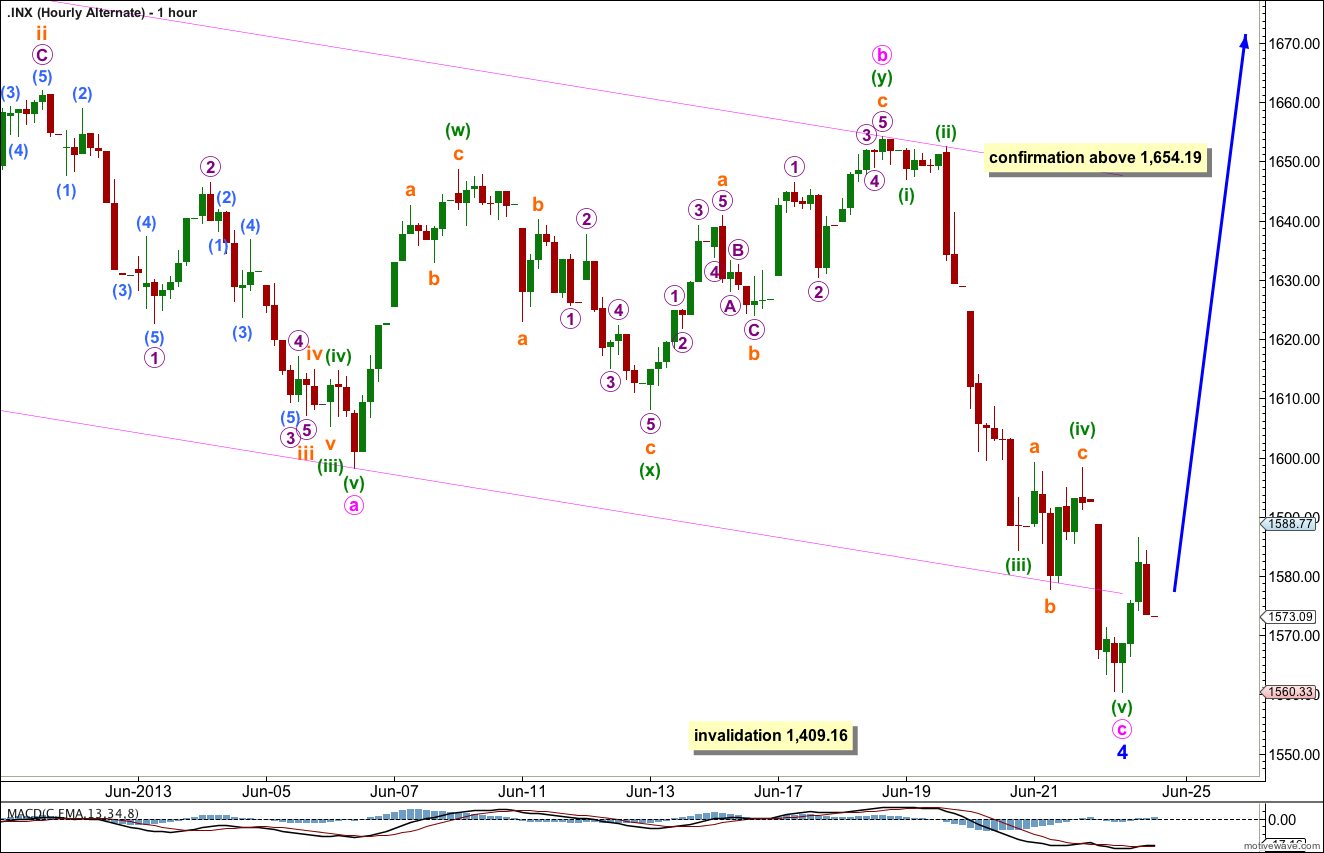
Within minor wave 4 there is no Fibonacci ratio between minute waves a and c. Within minute wave c subminuette wave (iv) must be seen as a running flat which further reduces the probability of this wave count. The subdivisions can fit, but it is a very low probability structure.
We need to see movement above 1,654.19 to have confidence in this wave count. Full confidence would come with movement to a new high above 1,687.18.
Lara,
Even though you are not currently favoring your alternate bullish count from the historical posting, can you give us an idea of where we would currently be within that count? Thanks.
Peter
It would be in or just approaching the middle of a third wave at 4 degrees. So it should see a strong increase in upwards momentum, really strong.
The bears have 30 days to push it under 1531.54 http://scharts.co/10Rh3bb if that happens 70-75% chance we can see 666 area before 1687.19